We use cookies to enhance your browsing experience, serve personalized content, and analyze our traffic.
By clicking "Accept All", you consent to our use of cookies. See our
Privacy Policy
for more information.
Economic Laws for Business Strategy: Principles Every Executive Must Know
January 23, 2026Wasil Zafar180 min read
Comprehensive guide to economic laws across 16 strategic categories—from market dynamics and innovation to platforms, negotiation, risk management, macroeconomics, regulation, and labour markets/immigration—that drive pricing, scaling, competitive advantage, and strategic decision-making across every business function.
Every business decision—from pricing strategies to hiring plans, from market entry to product launches—is fundamentally an economic decision. Yet many executives lack a systematic framework for applying economic principles to business strategy. This comprehensive guide bridges that gap by connecting 103+ timeless economic laws to modern business practice, organized into 16 strategic categories spanning market fundamentals, innovation, platforms, negotiation, risk management, macroeconomics, regulation, and labour markets/immigration.
Why Economic Laws Matter for Business
Economic laws aren't abstract theories—they're practical frameworks that explain why certain strategies work and when they fail. Understanding these laws helps executives:
Let's explore each law with real-world examples from companies like Amazon, Tesla, Netflix, Apple, and leading startups, then provide actionable frameworks for executives and business teams across all functions.
CATEGORY A: CORE MARKET & PRICING LAWS
Fundamental laws governing supply, demand, pricing power, and market equilibrium
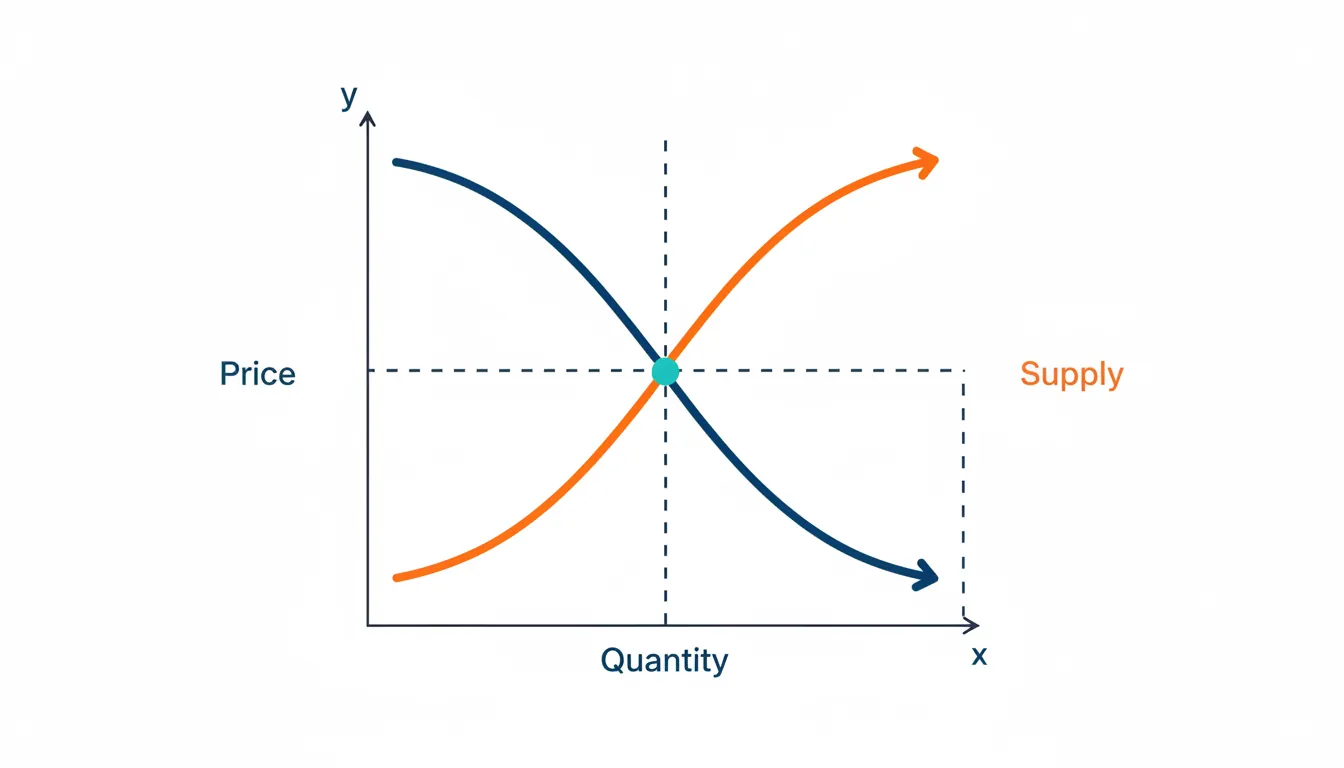
1. Law of Demand & Supply: The Foundation of Pricing
Core Principle: When supply exceeds demand, prices fall. When demand exceeds supply, prices rise. The equilibrium price occurs where supply equals demand.
The law of demand and supply showing equilibrium price at the intersection of supply and demand curves
Real-World Application: Airline Dynamic Pricing
Case Study
Delta Airlines: Demand-Based Revenue Management
Challenge: Fixed capacity (seats per flight) with fluctuating demand patterns
Strategy: Dynamic pricing based on real-time demand signals:
Low demand periods (Tuesday 2pm): Prices drop 40-60% to fill empty seats
High demand (Friday evening, holidays): Prices surge 200-300%
Advance booking: Lower prices when demand uncertainty is high
Last-minute booking: Premium prices for urgent business travel
Result: Revenue per available seat mile (RASM) increased 15-20% through demand-based pricing algorithms
Demand & SupplyPrice Elasticity
Business Applications
For Product Teams: Use A/B testing to find demand curves—test price points to identify where revenue maximizes (price × quantity). Don't assume lower prices always increase total revenue.
For Marketing Teams: Demand generation shifts the demand curve right (more willing buyers at every price). Focus on creating urgency and scarcity when supply is genuinely limited.
For Finance Teams: Model scenario planning around supply shocks (raw material shortages) and demand shocks (competitor moves, economic downturns). Build pricing flexibility into contracts.
Common Mistake: Ignoring supply constraints when stimulating demand. Marketing campaigns that succeed too well can destroy customer satisfaction if you can't fulfill orders. Amazon's early lesson: Don't promote what you can't ship in 2 days.
Amazon's Supply-Demand Mastery
Strategic Example
Amazon Web Services (AWS): Elastic Supply Model
Innovation: Created infinite supply elasticity through cloud infrastructure
Traditional hosting: Fixed capacity = supply shortages during traffic spikes
AWS auto-scaling: Supply expands/contracts with demand in real-time
Pricing model: Pay-per-use eliminates waste from over-provisioning
Business Impact: AWS became a $90B business by solving the supply-demand mismatch in computing
2. Law of Diminishing Returns: When More Becomes Less
Core Principle: Adding more of one input (while holding others constant) eventually yields smaller marginal increases in output. The first engineer adds huge value; the 50th adds incrementally less.
Real-World Application: Startup Hiring Mistakes
Case Study
Scaling Too Fast: The 2021 Tech Hiring Bubble
Context: Tech startups raised massive rounds in 2020-2021 and hired aggressively
Engineers 51-100: 20% productivity (bureaucracy, duplicated work, communication chaos)
2022-2023 Reality Check: Meta, Amazon, Google, Twitter cut 10-20% of workforce—recognizing diminishing returns had set in
Lesson: Growth in headcount ? growth in output. Organizational complexity grows faster than linear headcount.
Diminishing ReturnsEconomies of Scale
Business Applications
For Operations Teams: Measure marginal productivity. If adding the 5th person to a project doesn't increase output by at least the cost of their salary, you've hit diminishing returns. Use small, autonomous teams (Amazon's "two-pizza teams").
For Marketing Teams: Track cost per acquisition (CPA) by channel. The first $100K in Google Ads might yield $500K revenue; the next $100K might only yield $120K. Know when to stop scaling a channel and diversify.
For Finance Teams: Model marginal ROI for capital investments. A factory expansion might have 30% ROI, but the second expansion might only yield 12%. Compare to alternative uses of capital.
Setup: 2016-2017, Uber aggressively recruits drivers in major cities. San Francisco: first 5,000 drivers = 95% utilization (high rider demand, instant pickup). Added 5,000 more drivers (10,000 total) = 70% utilization (more competition for rides). Added another 10,000 (20,000 total) = 40% utilization (drivers waiting 30+ minutes between rides).
Diminishing Returns Impact: First 5,000 drivers: each earns $30/hour (busy constantly). Next 5,000: each earns $20/hour (more idle time). Next 10,000: each earns $12/hour (barely above minimum wage). Marginal productivity declining sharply—too many drivers chasing same rider demand. Driver churn spikes from 15% monthly to 40% monthly as earnings drop.
Key Insight: Adding more supply (drivers) hits diminishing returns when demand (riders) doesn't scale proportionally. Uber learned to model "optimal driver density" per market—beyond this point, adding drivers hurts both driver income and company efficiency (paying incentives to recruit drivers who then quit due to low earnings).
Quantifying Diminishing Returns Formula: Marginal Product = Change in Output ÷ Change in Input Decision Rule: Continue adding resources while Marginal Revenue > Marginal Cost Warning Sign: When marginal product falls below average product, you're over-investing
3. Law of Opportunity Cost: The Hidden Price of Every Decision
Core Principle: The true cost of any choice is what you give up by not choosing the next-best alternative. Money spent on Project A cannot be spent on Project B.
2005 Decision: Launch Prime with free 2-day shipping for $79/year
Opportunity Cost Analysis:
What Amazon gave up: $1-2 billion in annual shipping revenue
Alternative use of capital: Could have built 10 new fulfillment centers
Short-term impact: Profit margins compressed 3-5%
What Amazon Gained:
200M+ Prime members paying $139/year = $28B recurring revenue
Prime members spend 2-3x more than non-Prime customers
Customer lifetime value increased 5-10x
Lesson: Bezos chose long-term customer lock-in over short-term profits. The opportunity cost was worth it.
Opportunity CostTime Value of Money
Business Applications
For Strategy Teams: Every "yes" to a new initiative is a "no" to something else. Use a decision matrix that explicitly lists trade-offs. Ask: "What are we NOT doing because we're doing this?"
For Product Teams: Feature prioritization is opportunity cost management. Building Feature A means delaying Feature B. Use ROI ranking: Value ÷ (Cost + Opportunity Cost).
For HR Teams: Hiring one VP of Sales means you can't hire a VP of Product this quarter. Model the revenue impact of each role's first year. Choose the higher NPV option.
Executive Decision Framework
Before any major decision, answer three questions:
What is the explicit cost? (Money, time, resources)
What is the opportunity cost? (Next-best alternative foregone)
What is the total cost? (Explicit + Opportunity)
Only proceed if Total Value > Total Cost
4. Law of Price Elasticity: Understanding Pricing Power
Core Principle: Elasticity measures how much quantity demanded changes when price changes. High elasticity = price-sensitive customers (commodities). Low elasticity = pricing power (luxuries, necessities).
Real-World Application: Luxury vs. Budget Airlines
Comparative Analysis
Inelastic Demand: Business Class Travel
Elasticity: -0.3 (relatively inelastic)
10% price increase: Only 3% decrease in bookings
Why: Corporate travelers don't pay out-of-pocket, value comfort/time
Result: Airlines can charge $3,000 for a seat that costs $400 in economy
Margin: Business class generates 50-70% of airline profits despite 10% of passengers
Elastic Demand: Budget Airlines (Spirit, Ryanair)
Elasticity: -2.5 (highly elastic)
10% price increase: 25% decrease in bookings
Why: Leisure travelers extremely price-sensitive, have alternatives (driving, trains)
Strategy: Ultra-low base fares + ancillary fees (bags, seats, snacks)
Result: Can't raise prices without losing customers—must compete on cost efficiency
Price ElasticityCompetition
Factors That Reduce Elasticity (Increase Pricing Power)
For Pricing Teams: Segment customers by elasticity. Charge high prices to inelastic segments (enterprise), low prices to elastic segments (SMBs). Use versioning (Basic/Pro/Enterprise) to capture both.
For Marketing Teams: Reduce elasticity through differentiation. Generic product = high elasticity. Branded product with unique features = low elasticity. Invest in branding to reduce price sensitivity.
For Sales Teams: Identify switching costs. If a prospect has high switching costs from their current vendor, you must offer 30-50% more value to justify the change. Conversely, defend your own customers by increasing switching costs (integrations, custom features, data lock-in).
Setup: Starbucks operates 35,000+ stores globally with regional pricing power. US market: premium positioning (coffee + "third place" experience), price inelastic. Emerging markets (China, India): more price sensitive, elastic demand.
Elasticity Test Results: US stores: 2018-2023 raised prices 5% annually (accumulated 28% increase over 5 years). Customer count declined 2% total (very inelastic, elasticity = -0.07). Revenue per store increased 25% (price increases > volume declines). China stores: 2019 test 8% price increase ? 12% traffic decline (elastic, elasticity = -1.5). Revenue declined 5% (price increases < volume losses). Reversed price increase, focused on store expansion instead.
Strategic Implication: Same brand, different elasticity by market. US: brand loyalty, lack of substitutes (independent coffee shops closed during COVID), habit formation = inelastic. Can raise prices aggressively. China: intense competition (Luckin Coffee 10,000+ stores, cheaper alternative), emerging middle class price-sensitive = elastic. Must compete on value. Starbucks adapts pricing strategy to local elasticity: US focus on price realization (raise prices, premiumize), China focus on volume growth (affordable pricing, rapid expansion to 9,000 stores by 2025).
Testing Price Elasticity Formula: Elasticity = (% Change in Quantity) ÷ (% Change in Price) Elastic (>1): Revenue falls when price rises ? lower prices to maximize revenue Inelastic (<1): Revenue rises when price rises ? raise prices to maximize revenue Unit Elastic (=1): Revenue unchanged when price changes ? optimize for other factors
5. Cross Elasticity of Demand: Understanding Product Substitution
Core Principle: Cross elasticity measures how demand for Product A changes when the price of Product B changes. Positive cross elasticity = substitutes (Coke vs. Pepsi). Negative cross elasticity = complements (printers vs. ink).
When Disney+ launched at $6.99: Netflix saw 15% churn increase in households with children
Why: Both offer streaming video, similar content types, easy to switch
Business Impact: Netflix had to invest billions in original content to differentiate
Result: Price war—Netflix couldn't raise prices without losing customers to Disney+
Low Substitution: Spotify vs. Apple Music
Cross Elasticity: +0.3 (weak substitutes)
Why low: Playlists, algorithms, social features create switching costs
User behavior: Once users invest time curating Spotify, they stay despite price increases
Strategic lesson: Build features that reduce cross elasticity with competitors
Cross ElasticityCompetition
Business Applications
For Product Teams: Build features that reduce substitutability. Proprietary data formats, integrations, network effects—anything that makes switching costly. Salesforce's AppExchange (10,000+ apps) makes it hard to switch to competitors.
For Pricing Teams: Monitor competitor pricing closely when cross elasticity is high. In commodity markets (gasoline, airline tickets), match competitor price changes within hours or lose share immediately.
For Strategy Teams: Map your competitive landscape by cross elasticity. High cross elasticity = intense price competition. Low cross elasticity = pricing power. Invest in differentiation to reduce cross elasticity.
Cross Elasticity Decision Framework Formula: Cross Elasticity = (% Change in Qty of A) ÷ (% Change in Price of B) Substitutes (Positive): When competitor raises price, your demand increases Complements (Negative): When complement's price rises, your demand falls Example: When gas prices rise, demand for SUVs falls (complements)
6. Income Elasticity of Demand: Economic Cycles & Consumer Behavior
Core Principle: Income elasticity measures how demand changes when consumer income changes. Normal goods (elasticity > 0) see demand rise with income. Inferior goods (elasticity < 0) see demand fall as income rises.
Real-World Application: Recession-Proof vs. Cyclical Businesses
2021 Recovery: Revenue surged 60% as incomes rebounded
Strategic implication: Luxury brands are highly cyclical—need cash reserves for downturns
Staples: Low Income Elasticity (+0.2)
Example: Walmart, Dollar General, generic brands
2008 Recession: Walmart revenue grew 7% while Target fell 3%
Why: People still need groceries, household goods regardless of income
Strategic advantage: Recession-resistant business model attracts stable investors
Inferior Goods: Negative Income Elasticity (-0.5)
Example: Instant ramen, used cars, public transportation
Recession boom: Nissin (instant noodles) revenue up 25% in 2008-2009
Recovery decline: As incomes recovered, consumers switched to fresh food
Income ElasticityMarket Cycles
Business Applications
For Finance Teams: Use income elasticity to forecast revenue during economic cycles. High elasticity = volatile revenue, need larger cash reserves. Low elasticity = stable revenue, can operate with higher leverage.
For Strategy Teams: Portfolio diversification by income elasticity. Luxury conglomerate LVMH owns both high-elasticity brands (Louis Vuitton) and low-elasticity brands (Sephora cosmetics) to smooth revenue cycles.
For Marketing Teams: Adjust messaging by economic climate. Recession: emphasize value, durability, necessity. Boom: emphasize status, aspiration, premium features.
Income Elasticity Strategy Matrix
Product Category
Income Elasticity
Recession Strategy
Luxury (+2 to +4)
Very High
Build cash reserves, cut costs fast, focus on ultra-wealthy
Normal Goods (+0.5 to +1.5)
Moderate
Shift to value messaging, introduce economy tiers
Necessities (0 to +0.5)
Low
Maintain prices, gain market share from premium brands
Inferior Goods (-0.5 to -2)
Negative
Increase production, recession is growth opportunity
7. Law of Scarcity: Artificial Limits & Psychological Value
Core Principle: Scarcity increases perceived value. Limited availability creates urgency and demand, even when artificial. Humans value rare items more than abundant items, regardless of utility.
The law of scarcity showing how limited availability drives up perceived value and consumer urgency
Drop model: New items every Thursday, sell out in minutes
Limited quantities: Typical drop = 300-500 units per item (vs. 100,000+ for normal retail)
No restocks: Once sold out, item never returns
Result: $20 t-shirt resells for $200+ on secondary market
Business Impact:
Brand value: Supreme sold to VF Corp for $2.1B (2020)
Margin: 60-70% gross margin (vs. 40% for normal apparel)
No discounting: Items never go on sale—scarcity maintains value
Free marketing: Scarcity creates FOMO, drives organic social buzz
ScarcityPricing Power
Types of Strategic Scarcity
Scarcity Type
Example
Business Mechanism
Quantity Scarcity
Limited editions, numbered prints
Nike's limited sneaker drops, Hermès Birkin bags
Time Scarcity
Flash sales, seasonal items
Amazon Prime Day, McDonald's McRib
Access Scarcity
Waitlists, invite-only
Gmail beta (2004), Clubhouse invites (2020)
Geographic Scarcity
Regional exclusives
Tesla only in select cities initially
Business Applications
For Product Teams: Design scarcity into product launches. Gmail's invite-only beta (2004-2007) created massive demand despite free alternatives (Yahoo, Hotmail). Scarcity = exclusivity = desirability.
For Marketing Teams: Use countdown timers, "Only X left in stock," and limited-time offers. Booking.com's "Only 1 room left!" messaging increases conversion 15-25% through urgency.
For Sales Teams: Create artificial scarcity through limited allocations. SaaS companies use "Limited beta slots available" to speed up enterprise sales cycles from 9 months to 3 months.
Scarcity Warnings & Best Practices Ethical Use: Don't fake scarcity—customers will discover truth and backlash (e.g., fake countdown timers that reset) Product-Market Fit First: Scarcity amplifies desire for good products, doesn't create demand for bad ones Balance: Too much scarcity = lost revenue (Supreme leaves money on table). Too little = no urgency Best Formula: Produce 70-80% of potential demand to create scarcity without maximizing revenue loss
CATEGORY B: CHOICE, VALUE & INVESTMENT LAWS
Laws governing strategic trade-offs, decision-making, and value maximization
8. Law of Comparative Advantage: Build vs. Buy Decisions
Core Principle: Focus on activities where you have the lowest opportunity cost, even if you're not the absolute best at them. Outsource everything else.
Last-mile delivery: Increasingly using third-party drivers (Uber model)
Decision Framework: Build if (1) core competency, (2) strategic moat, (3) cheaper at scale. Otherwise buy.
Comparative AdvantageEconomies of Scale
Business Applications
For Strategy Teams: Map your value chain. For each activity, ask: "Are we 10x better than best-in-class vendors?" If no, consider outsourcing. Focus resources on the 2-3 activities that create competitive moats.
For Product Teams: Buy vs. build frameworks for features. Use third-party APIs for non-core features (payments, auth, analytics). Build proprietary features that differentiate you. Stripe succeeded by letting companies outsource payment infrastructure.
For HR Teams: Hire for comparative advantage. Don't hire a $200K engineer to do $50K ops work. Use contractors/offshore for tasks without strategic value. Reserve full-time hires for core competencies.
Background: In March 2018, Trump imposed 25% tariffs on steel imports and 10% on aluminum, citing national security. The policy aimed to protect domestic steel/aluminum producers from foreign competition, particularly from China.
Classical Comparative Advantage Prediction:
China specialization: Lower labor costs, economies of scale ? comparative advantage in steel production
US specialization: Higher productivity in tech, aerospace, finance ? comparative advantage in capital-intensive industries
Free trade outcome: US imports steel cheaply, focuses resources on high-value sectors ? both countries gain
Tariff Impact (Violating Comparative Advantage):
Effect
Outcome
Data
Import Volume
Steel imports dropped
Down 15% (2018-2019)
Domestic Prices
Steel prices rose sharply
+30% spike (2018)
Protected Jobs
Steel industry jobs increased
+8,700 jobs
Downstream Job Losses
Manufacturers paid more for steel
-75,000 jobs (est.)
Consumer Impact
Higher prices (cars, appliances, construction)
+$900/household/year
Trade Diversion
Companies sourced from Vietnam, Mexico instead
40% import shift
Retaliation
EU, China, Canada imposed counter-tariffs
$13B US exports targeted
Economic Analysis:
Deadweight loss: Tariffs created inefficiency ? resources shifted from efficient uses (tech, services) to inefficient steel production. Net cost: $7.2B/year (higher prices + job losses - protected jobs)
Terms of trade manipulation: Attempted to force China to lower export prices, but retaliation offset gains
Who paid the tariff: US consumers and manufacturers, not Chinese exporters (inelastic demand ? passed through as higher prices)
Job opportunity cost: $900,000 per steel job saved (could have retrained workers for $50K ? massive inefficiency)
Key Insight: Protectionism violates comparative advantage ? both countries worse off. Short-term political gains (visible jobs saved) masked larger invisible costs (consumer prices, downstream job losses, retaliation). Free trade maximizes total welfare; tariffs redistribute gains (to protected industry) while creating deadweight loss (net economic harm).
Comparative AdvantageProtectionismDeadweight Loss
2025 Update: Trump's Second Term Tariff Escalation
Current Policy2025-2026
Continuation and Expansion of Protectionist Strategy
Background: Upon assuming office in January 2025, Trump immediately resumed aggressive tariff policy, building on 2018-2020 precedents but with broader scope. Key actions (January 2025-January 2026):
Economic prediction: Tariff burden split between consumers and foreign producers based on demand/supply elasticity
Actual incidence (2025 data): US consumers/businesses paying 92-95% of tariff costs (similar to 2018-2020)
Why: Inelastic demand for many imports (semiconductors, rare earths, specialized machinery) + rapid trade diversion to third countries limits foreign exporters' pricing power
Household impact: Average +$2,100/year in higher costs (vs. $1,277 in 2018-2020) due to broader tariff scope
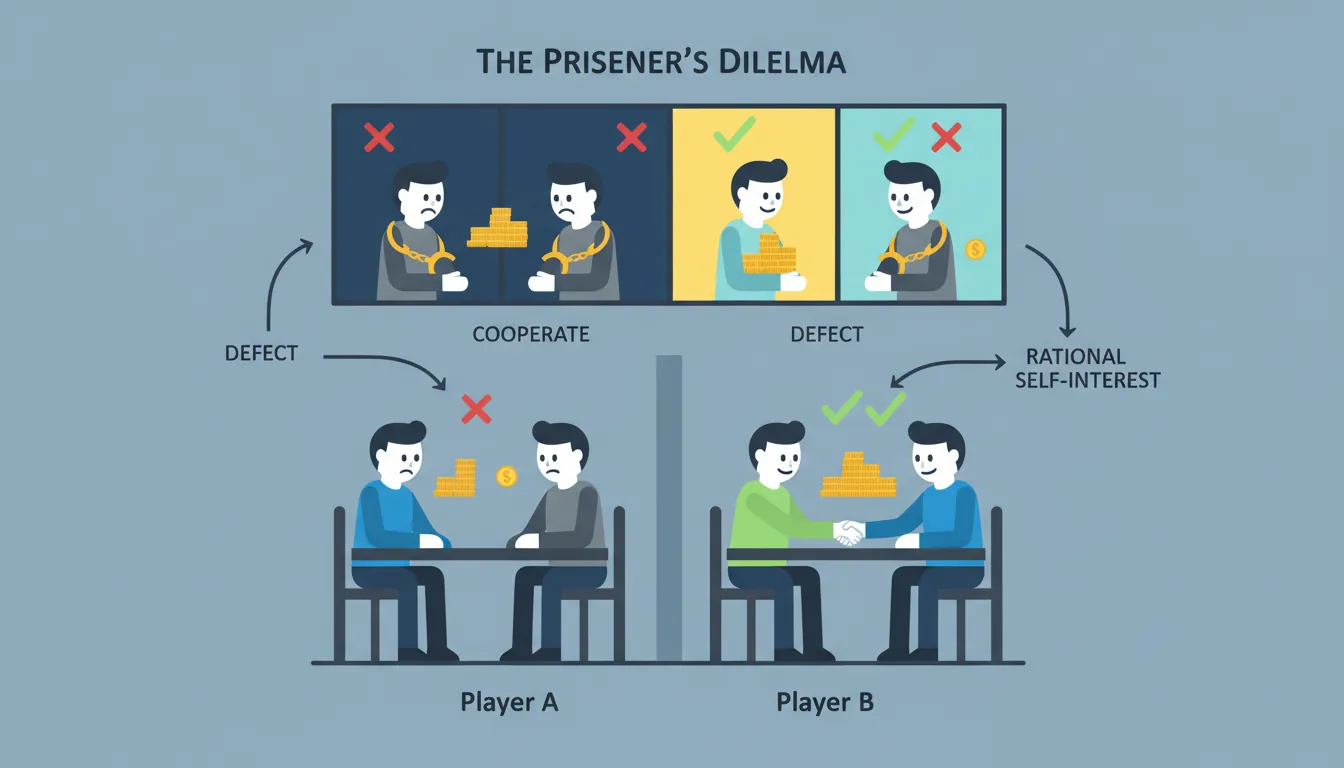
4. Retaliation & Game Theory (Prisoner's Dilemma Intensified):
Counter-measures (2025-2026): China: 60% tariffs on US ag exports, rare earth export restrictions. EU: €250B in retaliatory tariffs (Boeing, agriculture, tech). Mexico: 25% on US corn, machinery (USMCA violations alleged)
Escalation spiral: Each round of tariffs triggers counter-tariffs ? both sides worse off but locked in by domestic politics
Global impact: World trade growth: -1.5% (2025), projected -2.8% (2026) due to uncertainty and fragmentation
5. Trade Diversion (Inefficient Substitution):
Pattern: Rather than producing in US, companies shift sourcing to third countries (Vietnam, India, Indonesia, Thailand)
2025 data: Chinese exports to US: -$180B. Vietnam/India exports to US: +$95B. US domestic production increase: +$12B only
Efficiency loss: Vietnam/India often less efficient than China for many products ? higher global production costs (consumer harm) without US job creation
Example: iPhone production shifting to India (30% higher labor costs, lower productivity) ? retail prices up 8-12%
Real-World Implications (2025-2026):
Sector
Impact
Winners
Losers
Manufacturing
Input costs up 20-30%
Domestic steel/aluminum producers (+15,000 jobs)
Auto manufacturers, construction, machinery (-90,000 jobs)
Mexico border enforcement: Tariff threats to force cooperation on immigration ? Mexico deployed 30,000 troops to northern border, increased enforcement
EU defense spending: Auto tariff threats conditional on NATO spending increases ? partial success (Germany committed 2.5% GDP target)
China fentanyl crackdown: 60% tariff leverage to force drug precursor controls ? limited compliance
Market Disruptions:
Stock market volatility: S&P 500 down 15% (Q1 2025) on tariff announcements, recovered 8% on exemption news ? policy whiplash
Currency moves: Dollar strengthened 12% vs Yuan (tariff-driven), weakened 6% vs Euro (retaliation concerns) ? FX instability
Supply chain chaos: Companies scrambling to relocate production, renegotiate contracts ? $80B in restructuring costs (Fortune 500)
Investment freeze: Business CapEx down 18% (2025) due to policy uncertainty ? delayed expansion, hiring
Key Insight (2025-2026 Era): Trump's second-term tariff policy demonstrates systematic manipulation of foundational economic principles. Comparative advantage rejected (forced domestic production regardless of efficiency). Price mechanism distorted (tariffs override market signals). Elasticity ignored (claimed foreigners pay tariffs, data shows 92%+ falls on Americans). Game theory misapplied (assumed unilateral threats work, triggered mutual retaliation). Trade diversion over creation (shifted supply chains to third countries, minimal US production gains).
Political Economy Calculation: Concentrated benefits (visible manufacturing jobs: +15,000) vs. dispersed costs (invisible consumer harm: +$2,100/household × 130M households = $273B). Policy persists because winners (steel workers, domestic producers) are vocal and organized, while losers (all consumers) bear small individual costs and don't mobilize. Classic public choice problem: protectionism survives despite negative net welfare impact because benefits are concentrated and costs are diffuse.
Long-Term Consequences: Fragmentation of global supply chains (US-China decoupling accelerating), higher structural inflation (tariff-driven cost-push), reduced innovation (R&D budgets cut to offset tariff costs), geopolitical tensions (trade wars escalate to tech/investment restrictions), allies alienated (EU, Mexico, Canada relations strained). Net economic cost: -0.8% GDP growth (2025-2026) per consensus estimates, with long-term productivity losses from inefficient resource allocation.
2025 TariffsTrade War EscalationPolicy ManipulationEconomic Distortion
9. Law of Diminishing Marginal Utility: Why More Isn't Always Better
Core Principle: The satisfaction (utility) gained from each additional unit of consumption decreases. First slice of pizza = amazing. Fifth slice = less enjoyable. Tenth slice = negative utility (pain).
Real-World Application: SaaS Pricing Tiers
Pricing Strategy
How Slack Captures Value Through Marginal Utility
Free Tier: High marginal utility per feature
10,000 searchable messages: Huge value for small teams
SAML SSO, compliance exports: Zero value for SMBs, critical for enterprise
24/7 support: Most users never need, but enterprises require
Strategy: Price on willingness-to-pay, not utility (enterprise can afford it)
Marginal UtilityPrice Discrimination
Business Applications
For Product Teams: Design good/better/best tiers based on marginal utility curves. Front-load high-utility features in basic tier to drive adoption. Reserve low-utility features for premium tiers—charge high prices because alternatives are expensive (build custom SSO vs. pay for Business+ tier).
For Marketing Teams: Message marginal benefits correctly. Don't oversell features with low marginal utility—customers won't pay. Focus messaging on high-utility differentiators.
For Finance Teams: Revenue optimization = maximize area under marginal utility curve. Tiered pricing captures different utility segments—free tier (first units, high utility), pro tier (middle units, moderate utility), enterprise tier (last units, low utility but high willingness-to-pay).
Diminishing Marginal Utility in Action Freemium Model: Gives away high-marginal-utility features free ? customers hooked ? pay for moderate-utility features Subscription Fatigue: 15th streaming service has near-zero marginal utility ? churn increases Decision Rule: Stop adding features when marginal cost > marginal utility for target customer
10. Sunk Cost Fallacy: When to Cut Your Losses
Core Principle: Sunk costs are past expenses that cannot be recovered. Rational decision-making ignores sunk costs and focuses only on future costs/benefits. Yet humans irrationally factor sunk costs into decisions ("I've already invested so much...").
Real-World Application: Google Glass & Strategic Pivots
Failure Analysis
When Google Fell for Sunk Cost Fallacy (Initially)
2012-2014: Sunk Costs Accumulate
R&D Investment: $500M+ in hardware, software, partnerships
Team Size: 50+ engineers, designers, product managers
Marketing: Super Bowl ads, celebrity endorsements
Market signal: Terrible reception—called "Glassholes," privacy concerns, no product-market fit
Pivoted to enterprise: Refocused on warehouses, factories (actual use case)
Key insight: Ignored sunk costs, made decision based on future prospects
Contrast: If trapped by sunk costs, would've poured another $500M into doomed consumer product
Sunk Cost FallacyStrategic Pivots
Common Sunk Cost Traps in Business
Business Context
Sunk Cost Trap
Rational Response
Failed Product
"We've spent $10M building this, we can't give up now"
If future expected value < future costs, shut it down regardless of past spend
Underperforming Employee
"We invested 2 years training them, can't fire now"
Past training is sunk. If current output < current cost, replace
Bad Acquisition
"We paid $1B, must make it work"
Acquisition price is sunk. If integration costs > expected value, divest
Legacy Tech Stack
"We've customized this CRM for 10 years"
Past customization is sunk. If migration cost < (old TCO - new TCO), migrate
Business Applications
For Strategy Teams: Quarterly portfolio review—ask "If we were starting today, would we invest in this project?" If no, shut it down regardless of sunk costs. Amazon's "two-way door" framework: easily reversible decisions should be made fast, ignoring sunk costs.
For Finance Teams: Use incremental analysis for go/no-go decisions. Only factor in future cash flows. Spreadsheet discipline: never include past expenditures in NPV calculations for continuing projects.
For Product Teams: Feature deprecation based on future maintenance cost vs. future value, not past development cost. Slack sunset Slack Connect features that cost $5M to build but had low engagement—right call despite sunk cost.
Setup: 2011 Netflix: 24M DVD subscribers, $2B invested in DVD distribution infrastructure (58 fulfillment centers, automated sorting machines, logistics network). DVD business highly profitable: $3.2B revenue, 52% operating margins. But streaming emerging: 22M streaming subscribers, growing 60% annually.
Sunk Cost Decision: Reed Hastings (CEO) faces choice: (1) Protect DVD business (slow streaming investment, maximize cash from existing infrastructure), or (2) Cannibalize DVD, accelerate streaming (write off $2B infrastructure over 5 years, invest heavily in streaming content/tech). Wall Street pressures protection of profitable DVD segment. Hastings chooses cannibalization despite massive sunk costs.
Execution: 2011: Netflix splits DVD/streaming into separate services ($15.98/month combined ? $7.99 each if separated). Customer backlash: 800,000 subscribers cancel (stock drops 75%). But strategy: force customers to choose streaming or DVD—accelerate streaming adoption, starve DVD business. 2012-2016: DVD subscribers decline 20M ? 3M. Netflix stops investing in DVD infrastructure, deploys $15B into streaming content (House of Cards, Orange is New Black, international expansion).
Result: 2024: Netflix 260M streaming subscribers, $33B revenue, $280B market cap. DVD business shut down July 2023 (final 1M subscribers). Key lesson: Hastings ignored sunk costs ($2B DVD infrastructure) and opportunity costs (foregone DVD profits) to capture streaming future. Blockbuster made opposite choice—protected $6B retail store infrastructure (sunk cost fallacy), refused to cannibalize. Result: bankruptcy (2010). Sunk cost discipline = competitive advantage.
Sunk Cost Decision Framework Question: "If I had not already invested X, would I invest it now?" If Yes: Continue project (but base decision on future prospects, not past investment) If No: Exit project immediately (sunk costs are irrelevant) Red Flag: Phrases like "We've come too far to quit now" or "Can't waste what we've invested"
11. Risk-Return Tradeoff: No Free Lunch in Finance
Core Principle: Higher potential returns require taking higher risk. Low-risk investments offer low returns. Cannot have both high returns and low risk—markets are efficient at pricing risk.
Real-World Application: Startup vs. Corporate Job
Career Decision
The Risk-Return Spectrum of Career Paths
Low Risk, Low Return: Corporate Job at Fortune 500
Salary: $120K base + $30K bonus = $150K total comp
10-year outcome: $1.5M-$2M total earnings, high certainty
High Risk, High Return: Early-Stage Startup
Salary: $80K base + 0.5% equity = expected value ~$100K year 1
Risk: 90% chance of failure (startup fails, equity worthless)
10-year outcome: 90% chance = $800K total earnings. 10% chance of $10M+ (IPO/acquisition)
Expected value: (0.9 × $800K) + (0.1 × $10M) = $1.72M (similar to corporate, but much higher variance)
Risk-ReturnExpected Value
Business Applications
For Finance Teams: Capital allocation by risk-return profile. Conservative companies (utilities, banks) invest in low-risk, low-return projects (bonds, blue-chip stocks). Growth companies (tech startups) swing for high-risk, high-return bets (R&D, acquisitions).
For Strategy Teams: Portfolio approach to risk. Don't bet entire company on one high-risk project—70% low-risk projects (sustaining innovations), 20% medium-risk (adjacent markets), 10% high-risk (breakthrough innovations). Google's "70-20-10" rule.
For Investors: Startup investing requires power law thinking. Most investments fail (0x return), few succeed (3-5x), rare home runs (100x+). Need portfolio of 20+ investments to achieve statistical edge. Single high-risk bet = gambling, not investing.
Risk-Return Matrix for Business Decisions
Risk Level
Expected Return
Example Investment
Low Risk
5-8% annual
Treasury bonds, savings accounts, core business operations
Medium Risk
10-15% annual
S&P 500 index, adjacent market expansion, product line extensions
High Risk
20-30%+ annual (or total loss)
Startups, new product categories, international expansion, M&A
CATEGORY C: COST, PRODUCTION & SCALING LAWS
Laws governing production efficiency, cost structures, and scaling dynamics
12. Returns to Scale: When Doubling Inputs Doesn't Double Output
Core Principle: Returns to scale describe what happens to output when you proportionally increase all inputs. Increasing returns = output more than doubles. Constant returns = output exactly doubles. Decreasing returns = output less than doubles.
Scenario: Double infrastructure investment (servers, data centers, networking)
Double inputs (cost): $100B ? $200B total infrastructure
More than double output (capacity): Better server utilization (80% vs. 60%), bulk purchasing discounts (40% cheaper per unit), shared services (one global CDN serves 2x customers)
Result: 2.5x capacity increase for 2x cost increase = increasing returns to scale
Strategic advantage: Scale becomes an unbeatable moat—no competitor can match AWS economics without matching scale
Returns to ScaleEconomies of Scale
Business Applications
For Operations Teams: Identify if your business has increasing returns to scale. Software yes (zero marginal cost). Professional services no (linear scaling). Manufacturing maybe (depends on automation vs. labor mix).
For Strategy Teams: In industries with increasing returns to scale, prioritize market share over short-term profitability. First mover advantage is massive—Amazon poured billions into AWS infrastructure when unprofitable, now has 32% market share and 70%+ margins.
For Finance Teams: Model scale scenarios carefully. Decreasing returns to scale = diseconomies emerging (bureaucracy, complexity). Signal to split into smaller units or divest non-core assets.
Identifying Returns to Scale Type Increasing Returns: Software, platforms, networks (fixed costs dominate) Constant Returns: Retail, franchises (replicable business model) Decreasing Returns: Custom services, creative work (key resources don't scale) Red Flag: If scaling from 100 ? 200 employees makes coordination harder, you're hitting decreasing returns
13. Learning Curve Effect: Experience as Competitive Advantage
Core Principle: As cumulative production volume doubles, unit costs decline by a constant percentage (typically 10-30%). Not about time—about repetition. Experience makes you more efficient.
Real-World Application: Tesla Battery Cost Decline
Manufacturing Excellence
How Tesla Achieved 90% Battery Cost Reduction
2010 Roadster (first 2,500 units):
Battery cost: $1,000/kWh
Manufacturing approach: Manual assembly, high defect rates
Cumulative learning: Every doubling of production ? 20% cost reduction
Strategic Moat:
Tesla's 5M+ cumulative vehicle production = decades of learning curve advantage
New EV startups (Lucid, Rivian) start at 2010 Tesla cost levels—can't compete on cost until they achieve similar scale
Learning CurveManufacturing
Business Applications
For Operations Teams: Track learning curve rate for your production processes. Plot log-log chart of cumulative volume vs. unit cost. Slope = learning rate. Use this to forecast future costs at higher volumes.
For Strategy Teams: First mover advantage in manufacturing-heavy industries comes from learning curve, not innovation. Boeing vs. Airbus—decades of production experience = cost advantage new entrants can't match without producing similar cumulative volumes.
For Pricing Teams: Price aggressively early to gain volume, move down learning curve faster than competitors. Once cost advantage achieved, raise prices—competitors can't match profitability. Classic strategy: penetration pricing ? volume ? learning ? cost leadership ? margin expansion.
Learning Curve Formula & Strategy Formula: Y = aX^b (where Y = unit cost, X = cumulative volume, b = learning rate) Typical Rates: Aerospace (80% - every doubling = 20% cost reduction), Electronics (70%), Services (90%) Strategic Implication: Industries with steep learning curves (70-80%) favor early movers and high-volume producers Decision Rule: If learning rate <85%, prioritize volume growth over margins in early years
14. Economies of Scope: Leveraging Shared Resources
Core Principle: Economies of scope occur when producing multiple products together is cheaper than producing them separately. Shared resources (infrastructure, brand, distribution, R&D) reduce average cost per product.
Real-World Application: Amazon's Business Model
Scope Economics
How Amazon Leverages Shared Infrastructure
Shared Resource: Fulfillment Network
Retail: Stores and ships Amazon.com orders
FBA (Fulfillment by Amazon): Same warehouses fulfill third-party seller orders
External product: Sold to enterprises as AWS ($90B revenue)
Scope synergy: R&D costs amortized across 2 customer bases
Shared Resource: Brand & Customer Base
Prime membership: Drives adoption of Prime Video, Music, Reading
Cross-sell: Customer who joins for fast shipping subscribes to video ? no new customer acquisition cost
Economies of ScopePlatform Strategy
Business Applications
For Product Teams: Identify shared resources that can power multiple products. Shopify's merchant dashboard powers online stores, POS, payments, shipping—one codebase, multiple revenue streams.
For Strategy Teams: M&A based on scope economies. Disney bought Marvel, Star Wars, Pixar—shared distribution (Disney+), shared merchandising, shared theme park attractions. Each IP is more valuable in Disney's portfolio than standalone.
For Finance Teams: Calculate scope economies through joint cost allocation. If producing A+B together costs less than producing A alone + B alone, scope economies exist. Quantify synergy value in acquisition models.
Economies of Scope vs. Economies of Scale Scale: Lower cost per unit as volume increases (more of same thing) Scope: Lower cost per product as variety increases (more different things using shared resources) Example: Walmart has scale (bulk purchasing), Amazon has scope (shared fulfillment) Best Strategy: Combine both—shared platform (scope) serving high volume (scale)
15. Law of Increasing Complexity: When Growth Creates Chaos
Core Principle: As organizations grow, complexity increases exponentially (not linearly). Communication pathways = n(n-1)/2 where n = people. 10 people = 45 connections. 100 people = 4,950 connections. Coordination costs can overwhelm productivity gains.
Real-World Application: The Two-Pizza Team Rule
Organizational Design
Amazon's Solution to Complexity Explosion
The Problem: Large Teams Slow Down
5-person team: Ship feature in 2 weeks, minimal meetings, direct communication
20-person team: Ship same feature in 8 weeks—4x slower despite 4x resources
Principle: Team should be small enough to feed with two pizzas (~6-8 people)
Autonomy: Each team owns full feature/service, minimal dependencies
APIs: Teams interact through documented interfaces, not meetings
Result: Reduced complexity—10 small teams outship 1 large team of 100
Evidence of Complexity Costs:
Brooks's Law: "Adding engineers to late project makes it later" (coordination > productivity)
Mythical Man-Month: 9 women can't have a baby in 1 month—some work doesn't parallelize
ComplexityOrganizational Design
Business Applications
For Leadership Teams: Combat complexity through org design. Spotify's "squads and tribes" model, Valve's flat hierarchy, Basecamp's 3-person teams—all minimize coordination overhead. Don't solve problems by adding people—solve by reducing dependencies.
For Operations Teams: Simplify processes as you scale. Each process decision = permanent complexity tax. Amazon's "mechanisms not meetings" philosophy—replace recurring coordination with automated systems.
For Product Teams: Modular architecture reduces complexity. Microservices, APIs, plug-in systems—allow teams to work independently. Monolithic codebases require coordination = exponential complexity growth.
Complexity Warning Signs Red Flags:
Decision velocity slowing despite adding people
Meetings proliferating to align stakeholders
Features taking longer to ship as team grows
Email/Slack volume overwhelming workers
Solutions: Split teams, reduce dependencies, automate coordination, eliminate unnecessary work
CATEGORY D: INCENTIVES & ORGANIZATIONS
Laws governing incentive alignment, organizational behavior, and metrics design
16. Law of Incentives: Aligning Behavior with Strategy
Core Principle: People respond to incentives—often in unintended ways. What you measure and reward becomes what people optimize for, not necessarily what you want.
Incentive Design: Sales quotas tied to number of accounts opened per customer
Goal: Increase cross-selling (get customers to use multiple products)
Metric: Accounts per customer (wanted 8 per household)
Rewards: Bonuses, promotions, job security for hitting quotas
Unintended Consequences:
What happened: Employees opened 3.5M fake accounts without customer consent
Why: Metric rewarded quantity over quality, no penalty for fake accounts
Result: $3B in fines, CEO fired, brand destroyed
Lesson: Narrow incentives create narrow optimization. Must align metrics with long-term customer value, not short-term actions.
IncentivesCompetition
Designing Better Incentives
Best Practice
Amazon's Customer Obsession Metrics
Sales Team Incentives:
? Bad metric: Revenue per customer (encourages upselling junk)
? Good metric: Customer lifetime value (CLV) - repeat purchase rate
Customer Service Team:
? Bad metric: Calls resolved per hour (encourages rushing customers)
? Good metric: Customer satisfaction score + first-contact resolution
Product Team:
? Bad metric: Features shipped (encourages bloat)
? Good metric: User adoption of features + retention impact
Business Applications
For HR/Compensation Teams: Audit all incentive structures quarterly. Ask: "If employees maximally optimize for this metric, what's the worst thing that could happen?" Test incentives with small pilots before rolling out company-wide.
For Sales Teams: Balance short-term metrics (quarterly revenue) with long-term metrics (customer retention, expansion revenue). Weight compensation 60/40 between the two. Punish bad revenue (high churn accounts).
For Leadership: Culture is what you incentivize, not what you say. If you preach collaboration but reward individual performance, you'll get silos. Measure and reward team outcomes.
Incentive Design Checklist
Before implementing any incentive system:
Alignment: Does it drive the behavior we actually want?
Gaming: How could someone game this metric unfairly?
Unintended consequences: What could go wrong if maximized?
Balance: Do we incentivize both quality and quantity?
Long-term: Does it reward sustainable vs. extractive behavior?
17. Goodhart's Law: When Measures Become Targets
Core Principle: "When a measure becomes a target, it ceases to be a good measure." People optimize for the metric instead of the underlying goal, often with perverse outcomes.
The Metric: Cross-sell Ratio (accounts per customer)
Original intent: Measure customer satisfaction and product fit
Became target: Employees judged and compensated on cross-sell numbers
Gaming behavior: Opened 3.5M+ fake accounts without customer permission
Why gaming worked: Metric went up, actual value (customer relationships) went down
Consequences:
Fines: $3B in regulatory penalties
Stock crash: 30% drop in market cap ($35B loss)
CEO resignation: John Stumpf forced out
Lesson: Optimizing for the wrong measure destroys value faster than creating it
Goodhart's LawMetrics Design
Business Applications
For Leadership Teams: Design metrics that are hard to game. Instead of "lines of code" (easily gamed by writing bloated code), use "features shipped that customers use." Instead of "calls handled" (incentivizes rushing), use "issues resolved on first call."
For HR Teams: Avoid single-metric performance reviews. Netflix doesn't track hours worked—managers judge output and impact. Google's OKRs separate ambitious goals (60-70% achievement expected) from performance reviews (prevents gaming by setting easy goals).
For Product Teams: Be skeptical of vanity metrics. "Daily active users" can be gamed by annoying notifications. Better metric: "engaged users who find value" (harder to fake). Goodhart's Law explains why MAU is often misleading—companies game it through spam.
Preventing Goodhart's Law Strategy 1: Use multiple complementary metrics (can't game all simultaneously) Strategy 2: Measure leading indicators AND lagging outcomes Strategy 3: Rotate metrics periodically (prevents long-term gaming) Strategy 4: Qualitative checks alongside quantitative targets (manager discretion)
18. Principal-Agent Problem: Misaligned Interests
Core Principle: The principal-agent problem occurs when one party (agent) makes decisions on behalf of another (principal), but their interests don't align. Classic example: shareholders (principals) vs. executives (agents).
Real-World Application: Executive Stock Options
Alignment Strategy
How Stock Comp Aligns Principal-Agent Interests
The Problem: Executives' Incentives ? Shareholders' Interests
Shareholders want: Long-term value creation, sustainable growth
Salaried execs want: Job security, short-term targets, empire building
Conflict: Exec might reject risky but valuable projects to protect their job
Solution: Stock Options with Vesting
Grant: CEO receives options for 1M shares at $50/share
Vesting: 25% per year over 4 years (must stay to realize value)
Alignment: If stock hits $100, CEO makes $50M (same 2x return as shareholders)
Result: CEO now incentivized to take smart risks that grow company value
Remaining Problems:
Short-termism: Options can incentivize pumping stock before vesting, then dumping
Risk-taking: Options have asymmetric payoff—huge upside, limited downside (can't go below zero)
Better solution: Restricted stock units (RSUs) that align on downside too
Principal-AgentIncentive Design
Common Principal-Agent Problems in Business
Context
Principal
Agent
Misalignment
Solution
Corporate Governance
Shareholders
Executives
Execs prioritize perks, job security over shareholder value
For HR Teams: Design compensation to align interests. Sales reps on commission optimize for closing deals (agent interest). Add customer retention bonuses to align with company's long-term interest (principal).
For Strategy Teams: Recognize when you're the agent, not the principal. Consultants (agents) are paid for recommendations, not results—creates incentive to recommend expensive projects regardless of ROI. Solution: tie fees to implementation success.
For Investors: Due diligence on management alignment. How much stock do founders own? What's the vesting schedule? Are there super-voting shares? Misaligned management = avoid investment.
Solving Principal-Agent Problems Alignment: Make agent's financial outcomes depend on principal's success Monitoring: Regular audits, transparency requirements, oversight boards Incentives: Bonuses tied to long-term metrics, deferred compensation Competition: Multiple agents competing reduces individual power to exploit principal
19. Parkinson's Law: Work Expands to Fill Time
Core Principle: "Work expands so as to fill the time available for its completion." Give someone 1 hour for a task, they'll finish in 1 hour. Give them 1 week, they'll take the full week. Organizational corollary: bureaucracies grow regardless of actual workload.
Real-World Application: Government vs. Startup Efficiency
For Project Managers: Set aggressive deadlines. Amazon's "working backwards" from launch date forces teams to cut scope, not extend timelines. Tight deadlines = creative problem-solving. Loose deadlines = bikeshedding and feature creep.
For Leadership Teams: Combat bureaucratic expansion. Parkinson observed that bureaucracies grow 5-7% annually regardless of workload. Solution: zero-based budgeting (justify every headcount from scratch), regular org reviews, flat hierarchies.
For Product Teams: Time-boxing decisions. Basecamp's "6-week cycles" force teams to ship something in fixed time. Can't extend deadline ? must cut scope or ship MVP. Prevents perfectionism and over-engineering.
Counteracting Parkinson's Law Tight deadlines: Create artificial urgency (ship before conference, beat competitor launch) Resource constraints: Limited budget forces prioritization Public commitments: Announcing launch date creates accountability Incremental delivery: Ship MVPs ? prevents work from expanding indefinitely
20. Peter Principle: Rising to Your Level of Incompetence
Core Principle: "In a hierarchy, people tend to rise to their level of incompetence." Great engineers get promoted to engineering managers (different skillset), great salespeople become sales managers (now bad at their job). Result: organizations fill management ranks with incompetent people.
Real-World Application: The Manager Track Trap
Career Trap
How Companies Lose Great Individual Contributors
Scenario: Top Software Engineer
IC Level 5: Excellent engineer, ships critical features, loves coding
Promotion to Manager: Only path to higher pay/status in most orgs
New role: Now spends 80% time in meetings, performance reviews, hiring—zero coding
Outcome: Company loses great engineer, gains mediocre manager (no management training or aptitude)
Peter Principle in action: Rose to level of incompetence (management)
Solution: Dual Career Tracks (Google, Meta, Netflix)
IC track: Staff Engineer ? Senior Staff ? Principal ? Distinguished (equivalent to Director ? VP)
Manager track: Engineering Manager ? Senior EM ? Director ? VP
Result: Top engineers can earn $500K+ without managing anyone—no forced incompetence
Peter PrincipleCareer Ladders
Business Applications
For HR Teams: Create parallel career tracks. Let people progress in their area of competence. Microsoft's IC track goes to "Technical Fellow" (reports to CEO, $1M+ comp)—no need to switch to management to advance.
For Leadership Teams: Promote based on fit for next role, not performance in current role. Great salesperson ? great sales manager. Require management training before promotion, trial periods as "acting manager," or rotate people back to IC roles if management doesn't work out.
For Individuals: Recognize your zone of genius. If you love individual contribution (coding, design, writing), don't take management job for title/money. Negotiate for IC advancement or leave for company with better IC track.
Preventing the Peter Principle Dual tracks: IC and management paths with equal prestige/compensation Lateral moves: Allow "demotions" without stigma if role isn't working Skills assessment: Promote based on abilities needed for next role, not past performance Management training: Teach skills before promoting, not after failure
CATEGORY E: COMPETITION & MARKET STRUCTURE
Laws governing competitive dynamics, market positioning, and sustainable advantages
21. Law of Competition: The Invisible Hand That Erodes Profits
Core Principle: Perfect competition drives profits to zero. Sustainable profitability requires competitive moats—barriers that prevent rivals from eroding your margins.
Real-World Application: Airline Industry Economics
Industry Analysis
Why Airlines Struggle to Make Money
Perfect Competition Characteristics:
Commodity product: Seat from NYC to LA is identical across carriers
Low switching costs: Customers choose based on price + schedule only
High fixed costs: Planes, gates, staff—costs are same whether full or empty
Easy price comparison: Google Flights shows all options instantly
Result: Competition forces prices down to marginal cost
Industry profit margins: 1-3% (vs. 20-30% for software)
Bankruptcies: Most major airlines filed for Chapter 11 (2000-2010)
Consolidation: Merged down to 4 major carriers to reduce competition
CompetitionEconomies of Scale
Building Competitive Moats
Moat Type
How It Works
Example
Durability
Network Effects
Value increases with users
Facebook, Visa
Very High
Switching Costs
Expensive/painful to leave
SAP, Workday
High
Economies of Scale
Cost advantage from size
Walmart, Amazon
High
Brand/Intangibles
Premium pricing from trust
Apple, Nike
Medium
Regulatory/IP
Legal barriers to entry
Pharma patents, Uber licenses
Medium
Data
Unique dataset others can't replicate
Google Search, Bloomberg
Medium-High
Business Applications
For Strategy Teams: Audit your moats quarterly. Rate each moat 1-10 on strength. If average score < 5, you're vulnerable. Invest aggressively in strengthening moats before competitors erode margins.
For Product Teams: Build features that increase switching costs. Integrations, proprietary data formats, workflows that become muscle memory. Make it painful to leave.
For Sales Teams: In competitive markets, win on relationships and service, not price. Price wars destroy margins. Differentiate on intangibles that justify premium pricing.
Warren Buffett's Moat Test
"The key to investing is determining the competitive advantage of any given company and, above all, the durability of that advantage."
Questions to ask:
If we stopped innovating today, how long until competitors catch up?
What would it cost a new entrant to replicate our position?
Can we raise prices 10% without losing 10% of customers?
How many of our customers would switch if a competitor offered 20% lower prices?
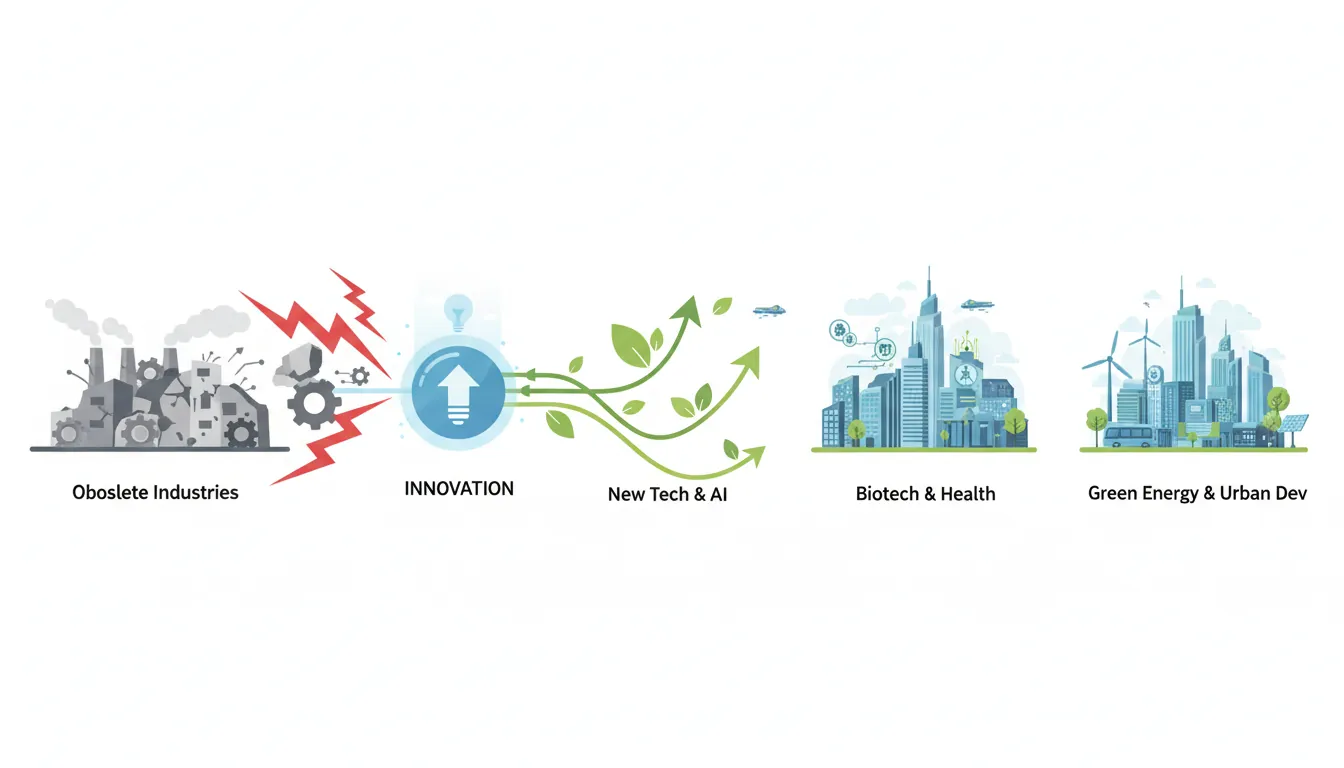
22. Creative Destruction: Innovation That Destroys Incumbents
Core Principle: Innovation creates new industries while destroying old ones. Capitalism's "gale of creative destruction" (Schumpeter) drives economic progress but makes most companies obsolete. Adapt or die.
Creative destruction showing how innovation creates new industries while making established ones obsolete
Real-World Application: Digital Photography Killed Film
Industry Disruption
Kodak's $28B Evaporation
1996: Kodak at Peak
Market cap: $28B, 145,000 employees
Dominance: 70% US film market share, household name globally
Irony: Kodak invented digital camera in 1975 but buried it (cannibalized film business)
2012: Kodak Bankrupt
Digital photography: Smartphones made cameras ubiquitous (iPhone 4S outsold all Kodak cameras)
Revenue collapse: Film sales fell 90% in 10 years
Creative destruction winner: Canon, Sony, and ultimately Apple/Samsung captured $200B+ camera phone market
Kodak mistake: Protected dying business (film) instead of cannibalizing it with digital
Creative DestructionDisruption
Business Applications
For Strategy Teams: Map your "S-curve" lifecycle. Every technology/business model has growth, maturity, decline phases. Netflix destroyed Blockbuster (DVDs ? streaming), then started destroying itself (streaming ? interactive content). Continually innovate before competitors do.
For R&D Teams: Invest in potentially disruptive technologies even if they cannibalize current revenue. Amazon's AWS cannibalized enterprise software sales—but better to cannibalize yourself than let competitors do it. Intel's "next bench" philosophy: always have team working on technology to replace current products.
For Leadership Teams: Cultural willingness to destroy own products. Steve Jobs killed iPod with iPhone ("If we don't cannibalize, someone else will"). Contrast with Microsoft's delay in mobile—protected Windows at expense of smartphone future.
Creative Destruction Strategy Attacker advantage: Startups have nothing to lose—can pursue disruptive tech aggressively Incumbent disadvantage: Protecting existing revenue streams prevents pivoting to new models Solution: Create separate divisions for disruptive innovations (Amazon's AWS started as skunkworks) Decision Rule: If technology could destroy your business in 5-10 years, invest in it TODAY
23. Barriers to Entry: Moats That Protect Profits
Core Principle: Barriers to entry are factors that make it difficult or expensive for new competitors to enter a market. High barriers = sustainable profits. Low barriers = competition erodes margins.
Fab investment: Each new semiconductor fab costs $20B+
R&D spending: $15B+ annually on next-generation processes
Time to replicate: 5-7 years minimum (Moore's Law advancement)
Knowledge barrier: Decades of accumulated manufacturing expertise
Why Barrier Is Weakening:
TSMC, Samsung: Matched Intel's investment, now ahead on 3nm process
Lesson: Capital barriers only work if you maintain technological lead
2024 status: Intel lost manufacturing advantage—barrier eroded by competitors' equal investment
Barriers to EntryCapital Requirements
Business Applications
For Strategy Teams: Build multiple overlapping barriers. One barrier can be overcome (patents expire, regulations change). Combine barriers for durable moat: network effects + economies of scale + brand (e.g., Amazon).
For Startups: Choose markets with low barriers initially, then build barriers after gaining foothold. Software SaaS has low capital requirements (easy to enter) but can build network effects and switching costs over time (hard to displace).
For Investors: Invest in companies with high, durable barriers. Buffett's "wide moat" investing: businesses where competitive advantages are structural, not temporary. Avoid markets where barriers are eroding (newspapers, retail).
Building Durable Barriers Strongest barriers: Network effects (self-reinforcing), regulatory monopolies (government-enforced) Weakest barriers: First-mover advantage alone (easily copied), proprietary tech (expires, reverse-engineered) Best strategy: Combine 2-3 barrier types for defense in depth
24. Winner-Takes-Most Markets: Power Law Distribution
Core Principle: In winner-takes-most markets, the top player captures disproportionate share of profits. Not linear distribution (everyone gets some)—exponential (leader gets 50-90%, everyone else fights for scraps).
Data network effects: More searches ? better algorithm ? more users ? more searches (flywheel)
Advertiser concentration: Advertisers go where users are ? reinforces Google dominance
Default positioning: Google pays Apple $15B+/year to be default iOS search ? locks in users
Switching costs: Low for users, but why switch if Google works best?
Winner-Takes-MostMarket Concentration
Markets That Exhibit Winner-Takes-Most
Market Characteristic
Winner-Takes-Most?
Example
Network effects
? Yes
Social networks, marketplaces, operating systems
High fixed costs, low marginal costs
? Yes
Software, pharmaceuticals, media
Strong brand effects
? Yes
Search, video streaming, cloud
Commoditized products
? No
Agriculture, raw materials, generic drugs
Fragmented preferences
? No
Restaurants, fashion, consulting
High switching costs
?? Maybe
Enterprise software (winner-takes-most within verticals)
Business Applications
For Startups: In winner-takes-most markets, second place is first loser. Prioritize growth over profitability—spend aggressively to win (Uber, DoorDash burned billions racing to dominance). If you can't be #1, don't enter market.
For Investors: Power law portfolio construction. Most startups fail, few become unicorns. In winner-takes-most sectors, returns are extreme—invest in 20+ companies, expect 1-2 to return entire fund (Benchmark's $11M Uber investment ? $7B return).
For Strategy Teams: Recognize when you're in winner-takes-most market and act accordingly. Can't compete on features alone—need network effects, scale advantages, or niche dominance. Example: Zoom focused on ease-of-use to beat Cisco WebEx despite fewer features.
Winner-Takes-Most Strategy If you're #1: Defend position aggressively—pay for exclusivity, undercut on price, acquire threats If you're #2-3: Find defensible niche or merge to achieve scale If you're #4+: Exit market or pivot—long-term viability unlikely Red Flag: Raising more funding to "compete" in winner-takes-most market when already behind
25. Market Power: Pricing Above Marginal Cost
Core Principle: Market power is the ability to raise prices above competitive levels (marginal cost) without losing all customers. Perfect competition = zero market power. Monopoly = maximum market power. Most businesses exist in between.
Real-World Application: Apple's iPhone Pricing Power
Pricing Power Analysis
How Apple Captures 85% of Smartphone Industry Profits
Cost Structure:
iPhone 15 Pro Max: Manufacturing cost ~$500, retail price $1,199
Gross margin: 58% (vs. 10-20% for Android competitors)
Differentiation: iOS ecosystem is genuinely different from Android (not perfect substitute)
Switching costs: Moving to Android means losing iMessage, FaceTime, app purchases
Brand premium: Apple = status symbol, customers willing to pay for logo
Network effects: More iPhone users ? more iMessage groups ? more pressure to stay
Contrast: Commoditized Android Market
Samsung, Xiaomi, OnePlus: Compete mainly on price
Low differentiation: All run Android, similar features
Result: Margins compressed to 10-15%—minimal market power
Market PowerPricing Power
Business Applications
For Product Teams: Build differentiation to gain market power. Commoditized products = no pricing power = race to bottom. Focus on features competitors can't easily copy: brand, design, integration, customer service.
For Pricing Teams: Test pricing power systematically. Raise prices 5-10% on subset of customers, measure churn. If churn < 5%, you have pricing power—keep raising. If churn > 15%, you're commoditized—compete on value, not price.
For Strategy Teams: Monitor market power trends. Increasing competitive pressure = eroding market power = margin compression ahead. Example: Netflix's market power declined as Disney+, HBO Max, Apple TV+ launched—had to cut subscription price growth to retain customers.
Measuring Your Market Power High Market Power Signals:
Gross margins >50% sustained over multiple years
Price increases don't trigger significant churn
Customers complain about price but don't leave
You can dictate terms to suppliers/distributors
Low Market Power Signals:
Can't raise prices without losing customers to competitors
Gross margins <20% and compressing
Customers view you as interchangeable with rivals
You must match competitor pricing instantly
CATEGORY F: SCALE & NETWORK EFFECTS
Laws governing exponential growth, platform dominance, and winner-take-all dynamics
26. Law of Economies of Scale: Size as Strategy
Core Principle: As production volume increases, cost per unit decreases. Larger firms can achieve lower costs through fixed cost spreading, purchasing power, and operational efficiencies.
Logistics network: $50B invested in distribution centers ? 2% logistics cost (vs. 8% for small retailers)
Technology amortization: $10B IT investment spread over $600B revenue = 1.7% of sales
Private label brands: Cuts out middleman, captures 25-40% margin on own brands
Result: 25-30% cost advantage vs. small competitors
Walmart COGS: 75% of revenue
Small retailers COGS: 80-85% of revenue
Implication: Walmart makes profit at prices that bankrupt competitors
Economies of ScaleCompetition
Types of Scale Economies
1. Fixed Cost Spreading: Software companies—$100M development cost spread over 1M users = $100/user. Over 100M users = $1/user. Marginal cost approaches zero.
2. Purchasing Economies: Large buyers negotiate volume discounts. Amazon Web Services gets server hardware 40-60% cheaper than small cloud providers.
3. Learning Curve Effects: Repetition improves efficiency. Tesla's battery cost fell 50% from Model S (2012) to Model 3 (2017) through manufacturing learning.
4. Network Density: Uber's unit economics improve in dense cities. More riders + more drivers = shorter wait times + higher utilization = lower cost per ride.
When Scale Becomes a Disadvantage
Warning
Diseconomies of Scale: When Bigger Is Worse
Bureaucracy: Large orgs require layers of management—decision speed slows
Coordination costs: Communication overhead grows exponentially with team size
Market power limits: Can't raise prices further without triggering anti-trust (Google, Meta)
Innovation inertia: Kodak couldn't pivot to digital despite inventing it—too much invested in film
Tipping point: When marginal coordination cost > marginal scale benefit, split into smaller units
Business Applications
For Operations Teams: Track unit economics by volume tier. Model how costs change at 2x, 5x, 10x current scale. Identify which costs are truly fixed (amortize over more units) vs. variable (scale linearly).
For Finance Teams: Build scale scenarios into pro formas. Show board that path to profitability requires achieving X market share to unlock Y% cost advantage. Justify initial losses as investment in scale.
For Strategy Teams: In winner-take-all markets (high fixed costs, low marginal costs), prioritize market share over profitability early on. Examples: Uber, Spotify, Netflix spent years unprofitable to achieve scale.
Scale Economics Formula Minimum Efficient Scale (MES): Smallest production volume where cost per unit is minimized Decision Rule: If current volume < MES, prioritize growth. If volume > MES, prioritize efficiency. Red Flag: If market size < 3x your MES, market may be too small for sustainable profitability
9. Law of Network Effects: The Ultimate Moat
Core Principle: A product becomes more valuable as more people use it. Unlike traditional goods (pie gets smaller when shared), network goods create exponential value with each new user.
Types of Network Effects
Type
Mechanism
Example
Strength
Direct Network Effects
More users = more value to each user
WhatsApp, Zoom, Email
Very Strong
Two-Sided Marketplaces
More buyers attract sellers, vice versa
eBay, Airbnb, Uber
Very Strong
Data Network Effects
More usage = better product (ML)
Google Search, Waze, Spotify
Strong
Platform Effects
More apps attract users, more users attract apps
iOS, Windows, PlayStation
Very Strong
Social Network Effects
Value from connections (friends/followers)
Facebook, LinkedIn, Twitter
Very Strong
Real-World Application: Facebook's Dominance
Network Effects Case
Why Facebook Crushed MySpace and Google+
Network Effect Flywheel:
2004-2007: College students join ? their friends must join to connect
Critical mass: At 50M users, new user's friends likely already on platform
Tipping point: At 100M users, NOT being on Facebook means social isolation
Switching costs: Your photos, posts, friend graph = years of data lock-in
Why Competitors Failed:
MySpace (2008): Users left for Facebook ? their friends followed ? MySpace lost critical mass
Google+ (2011): Better product, but no one's friends were there ? dead on arrival
Lesson: Can't beat network effects with features alone—need to solve cold start problem
Network EffectsCompetition
Building Network Effects: The Cold Start Problem
Chicken-and-Egg Challenge: Platforms need both sides (buyers + sellers, users + content creators) but neither will join without the other.
Strategies to Solve Cold Start:
Startup Playbook
How Successful Platforms Bootstrapped
1. Single Side First (Airbnb):
Founders manually recruited hosts by photographing apartments
Built supply (listings) first, then drove demand through Craigslist arbitrage
Once 100+ quality listings in NYC, word-of-mouth took over
2. Fake the Other Side (Reddit):
Founders created fake user accounts to post content
Made site appear active to attract real users
Real users joined, created content, attracted more users
3. Subsidize One Side (Uber):
Paid drivers guaranteed hourly wage to ensure supply
Offered free rides to riders to create demand
Lost money until critical mass achieved, then scaled back subsidies
4. Niche ? Expand (Facebook):
Started at single college (Harvard) ? achieved 100% penetration
Expanded college-by-college ? critical mass in each before moving on
Network effects strong within each college, then interconnected
Business Applications
For Product Teams: If building a marketplace, solve single-side value first. Uber = good for drivers even without riders (reliable taxi business). Airbnb = hosts could list on Craigslist too. Don't build pure platforms without single-player utility.
For Growth Teams: Viral coefficient must be > 1.0 for exponential growth. Measure K-factor: (Invites per user) × (Conversion rate). Dropbox's referral program: 35% of users invited friends, 20% converted = K = 0.07. Needed incentives (free storage) to hit K > 1.
For Strategy Teams: Network effects create winner-take-all markets. Second place gets exponentially less value. Go all-in to achieve critical mass or don't enter at all. Half-measures lose to full commitment.
Network Effect Litmus Test
Ask: "Does the 100th user make the product more valuable to the 1st user?"
Yes: You have network effects (Facebook, Uber, Marketplace)
No: You have scale economies, not network effects (Netflix—more users don't improve my experience)
True network effects are rare but nearly unbeatable when achieved.
28. Power Law Distribution: 80/20 Rule on Steroids
Core Principle: Power law distributions follow the principle that a small number of occurrences account for the majority of outcomes. Unlike normal distributions (bell curve), power laws are heavily skewed—top 1% often captures 50%+ of total value.
Real-World Application: Venture Capital Returns
Portfolio Analysis
Why VCs Need 100x Winners
Typical VC Fund: 30 Investments
20 investments (67%): Total loss or minimal returns (0-1x)
7 investments (23%): Modest returns (2-5x)
2 investments (7%): Strong returns (10-20x)
1 investment (3%): Home run (50-100x+) — THIS ONE RETURNS THE ENTIRE FUND
Example: Sequoia's WhatsApp Investment
Investment: $60M across multiple rounds
Exit: Facebook acquisition for $19B (Sequoia's share: $3B+)
Return: 50x — one investment returned 3x the entire $1B fund
Power law in action: 1 out of 200+ companies generated 300% of fund's profits
Power LawVenture Capital
Business Applications
For Strategy Teams: Identify which of your activities follow power law distributions. Customer value: 20% of customers generate 80% of revenue (focus retention there). Product features: 20% of features drive 80% of usage (prioritize those). Employee performance: Top 10% generate 50%+ of value (retain/clone them).
For Sales Teams: Account prioritization by power law. Enterprise sales: top 100 accounts may generate more revenue than next 10,000 combined. Allocate sales resources accordingly—dedicated account managers for top 1%, inside sales for the rest.
For Product Teams: Power law of user engagement. Most users are inactive, small percentage are power users. Design for power users (they drive retention/revenue), make product accessible for casual users (they drive acquisition).
Power Law vs. Normal Distribution Normal Distribution: Averages meaningful (height, test scores)—most people near middle Power Law: Averages meaningless (wealth, book sales)—extreme outcomes dominate Implication: In power law domains, focus on outliers, not averages. Median startup outcome = failure. But top 0.1% = trillion-dollar companies. Decision Rule: If power law applies, use portfolio approach—many small bets to find rare winners
CATEGORY G: GAME THEORY & STRATEGIC INTERACTION
Laws governing competitive strategy, negotiation, and strategic decision-making
29. Nash Equilibrium: When No One Can Improve by Changing
Core Principle: A Nash equilibrium occurs when each player's strategy is optimal given the other players' strategies. No player has incentive to unilaterally change their strategy. Predicts stable outcomes in competitive situations.
Nash equilibrium: Both Best Buy and competitors keep prices high
Why: If Walmart lowers price, Best Buy automatically matches ? Walmart gains no customers ? no incentive to cut price
Result: Prices stabilize at higher level than without price-matching
Nash EquilibriumGame Theory
Business Applications
For Strategy Teams: Map Nash equilibria in your competitive landscape. Understanding stable outcomes helps predict competitor behavior. If price war has no equilibrium (both lose), rational competitors avoid it—unless disrupting incumbent is worth short-term losses.
For Pricing Teams: Find pricing equilibria where no one benefits from changing. Avoid situations where you're incentivized to undercut but so is competitor—leads to margin erosion with no winner.
Identifying Nash Equilibrium Test: Given competitor's current strategy, can I improve my outcome by changing mine? If Yes: Not at equilibrium—expect strategy shifts If No: Nash equilibrium—stable state (for better or worse)
30. Dominant Strategy: The Obvious Best Move
Core Principle: A dominant strategy is optimal regardless of what opponents do. If one exists, rational players will always choose it. Simplifies strategic analysis—no need to predict competitor behavior.
Real-World Application: Always Invest in Cybersecurity
Dominant Strategy
Enterprise Cybersecurity: Dominant Strategy Regardless of Attack Probability
Hackers Attack
Hackers Don't Attack
Invest in Security
Avoid $50M breach cost, spend $5M ? -$5M
No breach, spent $5M ? -$5M
Don't Invest
Suffer $50M breach ? -$50M
No cost ? $0
Analysis: "Invest in Security" dominates "Don't Invest" in both scenarios. Even if no attack occurs, the insurance value justifies cost.
Business Applications
For Strategy Teams: Look for dominant strategies to simplify decisions. Cloud migration often dominates on-prem—better scalability, lower TCO, easier disaster recovery regardless of specific workload. Don't overthink—execute dominant strategy fast.
For Product Teams: Customer-centric design is often dominant strategy. Whether competitors copy or not, better UX wins customers. Contrast with feature races (not dominant—depends on what competitors do).
Dominant Strategy Decision Rule If you find a dominant strategy: Execute immediately—no further analysis needed Red Flag: If "obvious" strategy seems dominant, verify you haven't missed hidden costs/risks
31. Prisoner's Dilemma: When Rational Choices Lead to Bad Outcomes
Core Principle: Two players would both benefit from cooperation, but rational self-interest leads both to defect, resulting in worse outcome for both. Classic coordination failure.
The Prisoner's Dilemma showing how rational self-interest leads both players to worse outcomes than cooperation
Real-World Application: Airline Baggage Fees
Coordination Failure
How Airlines All Ended Up Charging Baggage Fees (Despite Hating Them)
Competitor Charges Fees
Competitor Doesn't Charge
You Charge Fees
Both earn fee revenue, neutral competitive position ? +3, +3
You lose customers but gain fee revenue ? +1, +5
You Don't Charge
You gain customers but lose fee revenue ? +5, +1
Neither gains, status quo ? +2, +2
Nash Equilibrium: Both charge fees (+3, +3), even though both not charging (+2, +2) might create better customer loyalty long-term. But unilateral disarmament (you don't charge while competitor does) is worst outcome (+1).
Business Applications
For Strategy Teams: Recognize prisoner's dilemmas to avoid destructive competition. Advertising arms races, price wars, talent bidding wars—all prisoner's dilemmas where cooperation would benefit everyone, but first-mover disadvantage prevents cooperation.
For Industry Leaders: Signal intentions to avoid mutual destruction. Price leadership, industry associations, public commitments—ways to coordinate without explicit collusion. Example: Airlines signal fare changes days in advance, allowing competitors to match without starting price war.
Escaping Prisoner's Dilemmas Repeated interaction: If game played multiple times, cooperation can emerge Communication: If players can credibly commit, cooperation possible Punishment mechanisms: Ability to retaliate against defectors enforces cooperation Third-party enforcement: Contracts, regulations can mandate cooperative outcome
International Trade War: US-China Tariff Escalation (2018-2020)
Trade WarPrisoner's Dilemma
How Rational Tariff Responses Led to Mutual Economic Harm
Game Theory Payoff Matrix:
China Retaliates with Tariffs
China Doesn't Retaliate
US Imposes Tariffs
Both protect industries, both pay higher prices, trade war escalates ? -5, -5
US gains leverage, China loses exports ? +3, -8
US Maintains Free Trade
China gains leverage, US loses exports ? -8, +3
Both benefit from free trade, maximum efficiency ? +10, +10
Nash Equilibrium: Both impose tariffs (-5, -5) even though mutual free trade (+10, +10) would maximize global welfare. Why? Dominant strategy = retaliate. If US imposes tariffs, China's best response is retaliate (-5) rather than accept exploitation (-8). Same logic for US: if China might retaliate, impose tariffs first (+3 or -5) beats being exploited (-8).
Escalation Timeline (2018-2020):
March 2018: US imposes 25% steel tariffs, 10% aluminum tariffs
April 2018: China retaliates with tariffs on $50B US goods (soybeans, aircraft, cars)
June 2018: US escalates to $200B in Chinese goods (consumer electronics, furniture)
September 2018: China retaliates with tariffs on $60B US goods
May 2019: US raises tariffs to 25% on $200B goods
August 2019: China retaliates with 5-10% tariffs on $75B US goods
Economic Damage (Both Sides):
Impact
United States
China
GDP Loss
-0.3% (~$65B)
-0.5% (~$70B)
Trade Volume Drop
Exports to China: -25%
Exports to US: -17%
Consumer Costs
+$1,277/household/year
+$560/household/year
Industry Harm
Agriculture: -$27B (soybean farmers devastated)
Manufacturing: -$35B (export orders declined)
Stock Market
Volatility: ±15% swings on tariff announcements
Shanghai Composite: -20% (2018)
Prisoner's Dilemma Analysis:
Coordination failure: Both countries would gain from cooperation (free trade = +10, +10), but rational self-interest drove mutual defection (tariffs = -5, -5)
First-mover disadvantage: Unilateral disarmament (maintaining free trade while other imposes tariffs) = worst outcome (-8) ? neither willing to back down
Retaliation spiral: Each tariff round triggered counter-tariffs ? escalation trap (wanted to signal strength, ended up in mutually destructive equilibrium)
Missing cooperation mechanisms: No credible commitment device to prevent retaliation ? negotiation failures prolonged trade war
Outcome: Phase One Deal (January 2020) partially de-escalated but kept most tariffs in place. Both countries worse off than pre-2018 baseline. Trade war demonstrated classic prisoner's dilemma: rational individual responses (retaliate to avoid exploitation) created irrational collective outcome (mutual economic harm).
Key Insight: International trade is a repeated game with coordination challenges. Without mechanisms for credible cooperation (trade agreements, WTO dispute resolution), countries fall into prisoner's dilemma ? protectionism spirals. Tariffs as negotiation tools backfire when both sides retaliate. Escaping requires: (1) repeated interaction (builds trust over time), (2) communication (negotiation channels), (3) punishment mechanisms (WTO enforcement), (4) third-party arbitration.
Prisoner's DilemmaTrade WarCoordination FailureGame Theory
32. Repeated Games: How Future Interactions Enable Cooperation
Core Principle: When games are played repeatedly, cooperation can emerge even in prisoner's dilemmas. Threat of future punishment deters short-term defection. "Shadow of the future" makes cooperation rational.
Apple's incentive: Squeeze supplier on price, maximize own margin
Supplier's incentive: Cut corners on quality to hit price
Result: Race to bottom—poor quality, distrust
Repeated Game (Long-Term Partnership):
Apple's strategy: Pay fair prices, provide multi-year contracts, invest in supplier capabilities
Supplier's strategy: Maintain quality, invest in R&D, prioritize Apple's orders
Why it works: Future business worth more than short-term gains from cheating
Enforcement: Apple threatens to drop suppliers who cut quality—credible because they've done it before
Repeated GamesCooperation
Business Applications
For Partnerships: Structure relationships as repeated games. Multi-year contracts, performance bonuses, escalation clauses—all create incentives for cooperation by increasing future interaction value.
For HR Teams: Employee retention creates repeated game dynamics. Short-term employees optimize for current compensation (take shortcuts). Long-term employees optimize for career trajectory (invest in quality).
Repeated Game Strategy Build reputation: Act cooperatively to signal trustworthiness Punish defection: Retaliate against cheaters to enforce norms Forgive strategically: Allow one-time mistakes but punish repeated defection Discount rate matters: If future discounted heavily, cooperation harder (why startups cheat—uncertain future)
33. Tit-for-Tat: The Winning Strategy for Repeated Interactions
Core Principle: Tit-for-tat is a strategy for repeated games: start cooperative, then mirror opponent's last move. Cooperate if they cooperated, defect if they defected. Remarkably effective at fostering long-term cooperation.
Real-World Application: International Trade Relations
Reciprocity Strategy
How WTO Enforces Fair Trade
Tit-for-Tat in Trade Policy:
Round 1: Country A removes tariffs (cooperate)
Round 2: If Country B reciprocates, both benefit from free trade
If Country B defects (keeps tariffs): Country A imposes matching tariffs (tit-for-tat)
Forgiving: Returns to cooperation if opponent does (allows relationship repair)
Clear: Easy to understand strategy (opponent knows what to expect)
Tit-for-TatReciprocity
Business Applications
For Negotiation: Start generous, then mirror counterparty. Make first concession, then only concede when they concede. Builds reciprocity while protecting against exploitation.
For Customer Relations: Reward loyalty with loyalty. Netflix grandfathered early subscribers at lower prices—those customers stayed through price increases because Netflix honored past relationship.
Tit-for-Tat Principles Be nice: Don't defect first—establish cooperative intent Be provokable: Retaliate immediately against defection Be forgiving: Return to cooperation after opponent does Be clear: Make your strategy transparent so opponent can coordinate
34. Stackelberg Leadership: First-Mover Advantage
Core Principle: In sequential games, the first mover (leader) can sometimes secure advantage by committing to a strategy before others, forcing followers to optimize around leader's choice. Credible commitment is key.
Commitment: Invested $billions in cloud infrastructure before market existed
Credibility: Capital expenditure was sunk cost—signal of long-term commitment
Follower response: Microsoft, Google had to decide: build competing infrastructure or cede market
Leader Advantage Secured:
Learning curve: 7-year head start in operational excellence
Customer lock-in: Early enterprise customers built on AWS = switching costs
Ecosystem: Developer tools, integrations, training all AWS-centric
Result: 32% market share vs. 23% Azure, 10% Google Cloud (2024)
Stackelberg LeadershipFirst-Mover
Business Applications
For Strategy Teams: Evaluate when to lead vs. follow. Lead when (1) your commitment is credible, (2) followers must optimize around your choice, (3) first-mover advantages are durable. Follow when leader hasn't secured advantages and you can leapfrog.
For Product Teams: Platform decisions are Stackelberg games. Choose your tech stack (iOS vs. Android) ? ecosystem develops around it ? switching costs lock you in. Make right choice upfront—expensive to change later.
Stackelberg Strategy Requirements Credible commitment: Must be costly to reverse (sunk investment, public announcement) Sequential play: Followers must move after leader's commitment is observable Strategic dependence: Followers' optimal strategy depends on leader's choice Sustainability: First-mover advantage must persist (learning curves, network effects, lock-in)
35. Coordination Games: When Everyone Wants to Align
Core Principle: Coordination games have multiple equilibria where players benefit from choosing the same strategy. Challenge isn't conflict—it's coordination. All players win if they align, all lose if they don't.
Real-World Application: Tech Platform Standards
Standards War
VHS vs. Betamax: Coordination Failure Cost Billions
Equilibrium 2: Everyone adopts Betamax—same outcome, different standard
Actual outcome: Split market (1980s)—consumers/studios divided ? reduced value for everyone
How VHS Won Coordination Game:
Network effects: More VHS users ? more rental titles ? more users (virtuous cycle)
Licensing strategy: JVC licensed VHS to all manufacturers—faster adoption
Tipping point: Once VHS hit 60% market share, rational consumers/studios coordinated on VHS
Coordination GamesNetwork Effects
Business Applications
For Platform Teams: Make coordination easy. Provide clear signals, incentivize early adopters, demonstrate momentum. USB-C adoption: Apple switching iPhones created coordination point—now everyone standardizing.
For Partnerships: Use focal points to coordinate. Industry conferences, standards bodies, dominant platforms—all serve as coordination mechanisms. AWS re:Invent becomes focal point for cloud ecosystem to align roadmaps.
Winning Coordination Games Create focal points: Be the obvious choice (first mover, largest player, backed by leader) Build momentum: Early wins create bandwagon effect Make switching costly: Lock in early adopters to create installed base Signal clearly: Help market coordinate on your standard
36. Zero-Sum Games: Your Gain Is My Loss
Core Principle: In zero-sum games, total gains equal total losses. One player's win exactly equals another's loss. No possibility of mutual gain—pure competition.
Result: Intense advertising, promotion wars—both spend billions to maintain/gain share
Economic waste: Advertising doesn't grow pie, just redistributes it
Prisoner's dilemma overlay: If both stopped advertising, both would save money with minimal share change
Zero-Sum GamesMarket Share
Business Applications
For Strategy Teams: Avoid zero-sum markets when possible. Growing markets offer positive-sum opportunities (everyone can win). Mature markets become zero-sum (fight over fixed pie). Better to enter growing categories than fight incumbents in stagnant ones.
For Founders: Don't compete in zero-sum games with well-funded incumbents. Find positive-sum opportunities—new markets, different value propositions, underserved segments. Zoom didn't fight Cisco on feature parity (zero-sum)—competed on ease-of-use (new dimension).
Escaping Zero-Sum Dynamics Expand the pie: Grow total market rather than fight for share Differentiate: Compete on different dimensions (premium vs. budget) Change the game: Redefine competition (Tesla competing against gas cars, not just other EVs) Red Flag: If your gain requires competitor's loss, prepare for expensive, protracted battle
37. Non-Zero-Sum Games: Creating Mutual Value
Core Principle: In non-zero-sum games, total gains can exceed or fall short of total losses. Cooperation can create value for all players. Most business is non-zero-sum—trade, partnerships, innovation all create net value.
Real-World Application: Strategic Partnerships
Value Creation
Spotify + Uber Partnership: 1+1=3
Individual Values:
Spotify alone: Music streaming app
Uber alone: Ride-hailing app
Partnership Value Creation:
Spotify gains: Access to Uber's 100M+ users, in-car music control feature (differentiation)
Uber gains: Better rider experience (control music during ride), differentiation from Lyft
Mutual value: Both gain without either losing—classic positive-sum outcome
Why Non-Zero-Sum: Integration creates value neither could achieve alone—enhanced user experience benefits both platforms
Non-Zero-SumPartnerships
Business Applications
For Business Development: Seek non-zero-sum partnerships. Complementary products (not competitors) create mutual value. Salesforce + Slack integration—both benefit from seamless workflow, neither cannibalizes the other.
For Negotiation: Frame discussions as value creation, not value extraction. Find win-win structures—contingent contracts, earn-outs, revenue shares. More value created = bigger pie to split.
Non-Zero-Sum Opportunity Signals Complementary assets: Your strength + their strength = combined advantage Information asymmetry reduction: Sharing data/insights benefits both Risk sharing: Joint ventures split downside while capturing upside Network effects: More participants = more value for everyone (positive feedback)
Core Principle: Credible commitment means limiting your own future options to influence others' behavior. By burning bridges, you make threats and promises believable. Cortés burned his ships—retreat impossible, soldiers fought harder.
Costco's low-margin, high-volume model—can't easily switch to premium
Business Applications
For Negotiation: Make first offers extreme and credible. Walking away from deals (publicly) builds reputation for toughness. Walmart's negotiating power comes from credible threat to delist suppliers.
For Strategy Teams: Use commitment to shape competition. Tesla's Gigafactory ($5B investment) credibly signals long-term commitment to EVs—forces competitors to commit billions to catch up or cede market.
Making Commitments Credible Irreversibility: Can't easily undo (sunk costs, public statements) Observability: Others must see your commitment Cost if broken: Significant penalty (reputation loss, financial hit) Warning: Commitment reduces flexibility—only use when strategic value > option value
Trade Negotiation: Trump's Tariff Threats as Commitment Devices (2018-2020)
Negotiation StrategyCredible Threats
How Tariffs Created Bargaining Leverage (With Mixed Results)
Strategic Commitment Logic: Trump used tariffs as credible threats in international trade negotiations. Unlike conventional diplomacy (quiet negotiations, face-saving compromises), Trump's approach: (1) public tariff threats, (2) actual implementation if demands unmet, (3) unpredictable escalation. Goal: force trading partners to make concessions (lower trade barriers, buy more US goods, accept enforcement mechanisms).
Commitment Mechanisms:
Mechanism
How It Works
Credibility Effect
Public Announcement
Twitter threats, press conferences
Reputation cost if backs down ? hard to reverse publicly
Actual Implementation
Imposed tariffs on China ($370B), Mexico ($350B threatened)
Demonstrated willingness to accept economic pain ? credible
Unpredictability
Random escalation (25% ? 50% threats), sudden deadlines
Uncertainty made threats more frightening ? partners took seriously
Domestic Support
Political base supported tough trade stance
Low political cost ? could sustain tariffs long-term
Case Studies:
1. USMCA (Replacement for NAFTA) - SUCCESS
Threat: Tariffs on Mexican cars (25%) and Canadian aluminum unless NAFTA renegotiated
Credibility: Trump actually imposed steel/aluminum tariffs on allies (Canada, Mexico, EU) ? showed willingness to harm partners
Outcome: Mexico/Canada agreed to new deal (USMCA) with: higher labor standards (Mexican wages increased), more US auto content (75% vs 62.5%), stronger enforcement mechanisms
Tariff removal: Steel/aluminum tariffs lifted after USMCA ratification
Analysis: Commitment worked—credible threat + actual pain ? concessions extracted. Net benefit debatable (USMCA gains vs. tariff costs), but demonstrated tariffs as negotiation leverage
2. China Trade War - MIXED RESULTS
Threat: Tariffs on all Chinese imports unless structural reforms (end forced tech transfer, IP theft, subsidies)
Credibility: Trump imposed tariffs on $370B Chinese goods (2018-2019), threatened 100% tariffs on remaining imports
China's response: Retaliation ($110B US goods), currency depreciation, long-term supply chain shifts (away from US)
Outcome (Phase One Deal): China agreed to buy $200B more US goods (agriculture, energy), some IP protections. Did NOT agree to end subsidies, state-owned enterprise reforms, structural changes
Analysis: Partial success—credible threat extracted purchases commitment but not structural reforms. Cost: -$65B US GDP, -$27B agriculture exports (before deal), permanent tariffs on $370B goods still in place (Biden kept them). Commitment too costly to sustain for full demands
3. EU Auto Tariffs - FAILURE TO COMMIT
Threat: 25% tariffs on European cars unless EU reduces trade barriers
Credibility problem: Repeated threats (2018-2020) but never implemented ? lost credibility
Outcome: EU didn't make major concessions, Trump didn't impose tariffs (too costly: German brands built in US = 120K jobs, retaliatory tariffs would hit US exports)
Analysis: Commitment failed—threat not believable because cost too high. Unlike China (less integrated, geopolitical rival), EU alliance made follow-through politically impossible ? partners called bluff
Strategic Lessons:
Credibility requires willingness to suffer: China tariffs credible because Trump accepted GDP loss. EU tariffs not credible because cost (ally relationship) too high ? bluffing exposed
Commitment traps: Public threats lock you in—backing down = reputation loss, following through = economic cost. Trump's Twitter diplomacy created many commitment traps (threatened 100% China tariffs, never implemented ? some credibility lost)
Retaliation risk: Credible threats invite retaliation. China didn't fold under pressure—matched tariffs, diversified away from US. Commitment strategy assumes opponent will capitulate, but repeated games (trade relationships) allow counter-threats
Option value loss: Irreversible commitments (public tariff threats) reduce flexibility. Quiet negotiations preserve optionality—can explore compromises without losing face. Trump's public approach burned bridges, made de-escalation harder
Key Insight: Tariffs as commitment devices work ONLY if: (1) credible (willing to accept costs), (2) proportionate (threat not so costly you can't follow through), (3) opponent values relationship enough to concede (USMCA worked, China didn't). Risk: commitment traps (locked into costly threats), retaliation spirals (opponents don't fold), reputation damage if bluffing exposed (EU example). Trade-off: credible threats gain leverage BUT reduce flexibility and invite counter-threats.
Laws governing information asymmetry, cognitive biases, and psychological decision-making
39. Information Asymmetry: When One Party Knows More
Core Principle: Information asymmetry occurs when one party in a transaction has more or better information than the other. Creates market failures, adverse selection, and moral hazard. Seller knows more about defects, buyer doesn't—lemon problem.
Real-World Application: Used Car Markets
Market Failure
The "Market for Lemons" (Akerlof, Nobel Prize)
Asymmetry: Seller knows if car is good or lemon. Buyer doesn't.
Buyer's rational response: Assume all used cars might be lemons ? only willing to pay "lemon price"
Good car owners: Won't sell at lemon price ? exit market
Result: Only lemons remain in market ? buyers' fears confirmed ? market collapses
Solutions That Emerged:
Warranties: Signal quality (only good cars can afford to offer warranties)
Reputation: Trusted dealers charge premium but deliver quality
Information AsymmetryAdverse Selection
Business Applications
For Marketplace Platforms: Reduce information asymmetry to enable transactions. Airbnb: reviews, verified photos, secure payments all reduce asymmetry between hosts and guests. Without these, market would fail.
For Sales Teams: Transparency builds trust when you have information advantage. B2B software: disclose pricing, limitations, competitor comparisons upfront. Reduces buyer skepticism, speeds up sales cycles.
Reducing Information Asymmetry Signaling: Costly actions that reveal private information (warranties, guarantees) Screening: Tests/requirements to reveal information (credit checks, background checks) Third-party verification: Independent audits, ratings, certifications Transparency: Voluntary disclosure to build trust
40. Adverse Selection: When Information Asymmetry Selects the Wrong Customers
Core Principle: Adverse selection occurs before a transaction when information asymmetry causes the "wrong" type of customer to self-select into a deal. Insurance companies attract sickest customers, lenders attract riskiest borrowers. Those who most want the product are least profitable to serve.
Real-World Application: Health Insurance Death Spiral
Market Failure
Why Individual Health Insurance Markets Collapse
Asymmetry: Individuals know their health better than insurers
Year 1: Insurer prices policy at $500/month based on average risk
Adverse selection: Healthy people skip insurance (low expected value), sick people buy (high expected value)
Year 2: Pool is sicker than expected ? insurer raises price to $700/month
Death spiral: Higher price ? more healthy people drop out ? even sicker pool ? higher prices ? repeat until market collapses
Solutions:
Mandatory coverage: ACA individual mandate forced healthy people into pool
Employer pools: Group coverage dilutes adverse selection
Underwriting: Medical exams reveal information (but creates access problems)
Adverse SelectionRisk Pooling
Business Applications
For Subscription Businesses: Prevent adverse selection through screening. Gym memberships work because overconfident people sign up but rarely go—if only serious athletes signed up, economics wouldn't work. SaaS free trials: conversion rates matter more than usage during trial.
For Lending Platforms: Combat adverse selection with data. High-risk borrowers most eager for loans. Solution: credit scoring, alternative data (Affirm, Klarna use transaction history), behavioral signals to identify good risks.
Mitigating Adverse Selection Screening mechanisms: Tests, requirements, data analysis to reveal risk Risk-based pricing: Charge high-risk customers more (if you can identify them) Mandatory participation: Force low-risk into pool (employer insurance, car insurance mandates) Reputation systems: Past behavior predicts future risk (credit scores, reviews)
41. Moral Hazard: When Protection Encourages Risky Behavior
Core Principle: Moral hazard occurs after a transaction when one party takes more risks because another party bears the cost. Insurance changes incentives—protected parties behave more recklessly because they don't face full consequences.
Real-World Application: 2008 Financial Crisis
Systemic Risk
"Too Big to Fail" = Moral Hazard at Scale
Moral Hazard Dynamic:
Banks' belief: Government will bail us out if we fail (implicit guarantee)
Changed incentives: Take extreme risks with leverage (40:1 debt-to-equity ratios)
Why rational: Heads I win (bonuses from profits), tails taxpayers lose (bailout if fails)
Result: $700B TARP bailout proved banks right—reinforced moral hazard
Solutions Implemented:
Dodd-Frank: Higher capital requirements reduce leverage
Living wills: Banks must plan for orderly bankruptcy (make failure possible)
Clawback provisions: Executives must return bonuses if risks materialize
Moral HazardIncentive Alignment
Business Applications
For HR Teams: Design incentives to minimize moral hazard. Stock options with vesting cliffs prevent employees from taking extreme short-term risks then quitting. Performance reviews based on sustainable metrics (customer retention) not just revenue.
For Procurement: Fixed-price contracts reduce moral hazard vs. cost-plus. Cost-plus incentivizes vendor to inflate hours/expenses (you pay regardless). Fixed-price aligns incentives—vendor eats cost overruns.
Controlling Moral Hazard Monitoring: Audits, oversight, inspections to detect risky behavior Deductibles/copays: Protected party shares some risk (insurance deductibles) Performance bonds: Post collateral that's forfeited if misbehavior occurs Reputation effects: Future business depends on good behavior today
42. Signaling Theory: Costly Actions Reveal Private Information
Core Principle: Signaling uses costly, observable actions to credibly communicate private information. Cheap signals are ignored (cheap talk). Expensive signals are believable because only those with true quality can afford them.
Real-World Application: College Degrees as Signals
Labor Market Signaling
Why Employers Pay Harvard Grads More
Signaling Value of Elite Degrees:
Cost: 4 years, $300K+ tuition, opportunity cost of working
What it signals: Intelligence (got admitted), conscientiousness (graduated), conformity (completed requirements)
Why costly matters: Only capable students can complete degree ? degree credibly signals capability
Paradox: Skills learned may be less valuable than the signal itself (much of knowledge not used on job)
Signaling Theory Critique of Education:
If education purely signaling (not skill-building), society wastes resources on credential arms race
Reality: likely mix of signaling + human capital development
SignalingCredentials
Business Applications
For Marketing Teams: Use costly signals to prove quality. Money-back guarantees (costly if product is bad), free trials (expensive for low-quality products), celebrity endorsements (expensive)—all signal confidence in quality.
For Fundraising: Lead investors signal quality to followers. When a16z leads Series A, it signals to other VCs that startup was rigorously vetted. Cost to a16z: reputation at stake if investment fails. Signal is credible because cost is high.
Effective Signaling Requirements Observable: Others must see the signal (public action, credential) Costly: Must be expensive for low-quality types to fake Correlated with quality: Signal must be easier for high-quality types to send Examples: Warranties, certifications, brand advertising, lead investor participation
43. Anchoring Effect: First Number Sets the Baseline
Core Principle: The first number mentioned in a negotiation or pricing discussion heavily influences final outcome, even if that number is arbitrary. People insufficiently adjust from initial anchors. "Is this painting worth $10,000?" vs. "Is it worth $1,000?" leads to radically different valuations.
Real-World Application: SaaS Pricing Pages
Pricing Psychology
How High Anchors Boost Revenue
Strategy: Show Enterprise Tier First (Decoy Pricing)
Enterprise tier: $500/user/month (anchor)
Pro tier: $50/user/month (looks cheap compared to $500)
Starter tier: $10/user/month
Psychological Effect:
Without anchor: $50 seems expensive ? customers choose $10 tier
With $500 anchor: $50 seems reasonable ? customers choose Pro tier (5x revenue)
Evidence: A/B tests show 30-40% revenue increase from high anchor display
AnchoringPricing Psychology
Business Applications
For Sales Teams: Set high anchors in negotiations. Start with ambitious ask, let counterparty negotiate down. Final price will be higher than if you started with reasonable offer. Real estate: sellers overprice deliberately, knowing anchoring will pull final price up.
For Product Teams: Display pricing high-to-low on pricing pages. Shows expensive options first, makes mid-tier seem affordable. Restaurants list expensive wines first—makes $50 bottle seem reasonable after seeing $200 options.
Setup: September 2017 iPhone X launch: $999 starting price (first iPhone >$1000). Previous flagship iPhone 7 Plus: $769. Simultaneously launched iPhone 8 ($699) and 8 Plus ($799). Strategic anchoring: $999 iPhone X makes $799 iPhone 8 Plus seem "reasonable," even though 8 Plus costs $30 more than previous year's flagship.
Anchoring Mechanism: (1) High anchor ($999) resets consumer expectations—"flagship iPhones cost $1000 now." (2) iPhone 8 positioned as "value" option despite being most expensive iPhone 8-series ever. (3) Media coverage focused on $999 price, not $699 baseline. (4) Face ID, OLED screen, new design justified premium—but psychological anchor did heavy lifting.
Result: iPhone ASP (Average Selling Price): $695 (FY2017, pre-iPhone X) ? $796 (FY2018) ? $809 (FY2019) = 16% increase despite flat unit sales. Revenue impact: iPhone revenue $141B (FY2017) ? $166B (FY2018) ? $142B (FY2019, unit sales declined but ASP held). Total incremental revenue from anchoring-driven ASP increases: ~$30B+ over 3 years. Customer behavior: iPhone X became best-selling model (outsold iPhone 8/8 Plus combined)—consumers chose "premium" option, anchored by $999 price.
Long-Term Impact: $999 anchor normalized high iPhone pricing. iPhone 11 Pro Max (2019): $1,099. iPhone 14 Pro Max (2022): $1,099. iPhone 15 Pro Max (2023): $1,199. Consumers no longer shocked by $1000+ iPhones—anchored expectations. Android competitors followed: Samsung Galaxy S22 Ultra $1,199, Google Pixel 7 Pro $899. iPhone X's $999 anchor reset entire smartphone industry pricing. Key lesson: strategic anchor creates new pricing paradigm—customers judge future prices relative to anchor, not absolute value.
Using Anchoring Ethically First offer advantage: Set anchor in your favor before negotiation begins Reference prices: Show "original price" crossed out next to sale price Extreme alternatives: Include very expensive option to make target price seem moderate Warning: Absurdly high anchors backfire—must be within plausibility range
44. Loss Aversion: Losses Hurt Twice as Much as Gains Feel Good
Core Principle: People feel pain of losing $100 about twice as intensely as pleasure of gaining $100. Asymmetric value function drives risk-averse behavior and status quo bias. "Don't take away what I have" is more powerful than "Give me something new."
Real-World Application: Freemium to Paid Conversion
Conversion Strategy
Why Free Trials Outperform Free Tiers
Free Trial Strategy (Loss Aversion):
Give full access for 14 days: User gets premium features, forms habits
At day 15: Features disappear unless user pays
Psychological frame: User experiences LOSS of features they already used
Conversion rate: 25-40% (high because losing features hurts)
Freemium Strategy (Gain Frame):
Limited free tier forever: User has basic features permanently
To upgrade: User must see value in GAINING premium features
Psychological frame: User contemplates potential gains, not losses
Conversion rate: 2-5% (low because gains are less motivating than avoiding losses)
Loss AversionBehavioral Economics
Business Applications
For Product Teams: Frame features as preventing losses. Cybersecurity software: don't sell "protect your data" (gain frame)—sell "don't lose your data to hackers" (loss frame). Same product, 2x conversion rate.
For Marketing Teams: Emphasize what customers stand to lose. "Don't miss out" outperforms "Get this deal." Email subject lines with loss framing (last chance, expiring soon) have 20-30% higher open rates.
Leveraging Loss Aversion Endowment effect: Once people own something, they value it more—give free trials to create ownership feeling Status quo bias: Default options stick because switching feels like loss—make desired choice the default Framing: Emphasize what's at risk, not what could be gained Ethical use: Don't manufacture fake losses or create anxiety—use to highlight genuine risks
45. Bounded Rationality: Humans Are "Satisficers," Not Optimizers
Core Principle: People have limited cognitive resources and information-processing capacity. Rather than finding optimal solutions, we "satisfice"—choose first acceptable option that meets minimum criteria. Good enough beats perfect.
Rational Decision: Compare all shipping options, calculate value of faster delivery vs. cost
Options: Standard (free, 5-7 days), Expedited ($7.99, 2-3 days), Prime ($14.99/month for 2-day on all orders)
Optimal choice: Depends on order frequency, urgency, value of time—complex calculation
Bounded Rationality Behavior:
Cognitive load: Shoppers don't calculate expected value—too much effort
Satisficing: Choose default option or first acceptable choice (Prime)
Amazon's advantage: Makes Prime the default—most users don't optimize, just click "Proceed"
Result: 200M+ Prime members, many paying for service they underutilize (satisficing, not optimizing)
Bounded RationalityChoice Architecture
Business Applications
For Product Teams: Reduce decision complexity. Offer 3 tiers (good/better/best), not 10. Paradox of choice: more options = lower conversion because cognitive load overwhelms customers. Apple's product line simplicity vs. Samsung's complexity.
For UX Designers: Design for satisficing, not optimization. Progressive disclosure (show advanced options only when needed), smart defaults (pre-select most common choices), guided flows (decision tree, not overwhelming form).
For Pricing Teams: Exploit bounded rationality with anchoring and defaults. Most customers won't calculate ROI—they'll pick middle tier (seems safe), trust your recommendation (default), or match competitors. Price accordingly.
Designing for Bounded Rationality Simplify choices: 3 options max for most decisions Smart defaults: Pre-select best choice for most users Progressive disclosure: Hide complexity until needed Decision aids: Filters, comparisons, recommendations reduce cognitive load Recognition over recall: Show options rather than requiring users to remember/calculate
Core Principle: Consumers substitute to alternatives when relative prices or perceived value changes. High substitutability = intense price competition. Low substitutability = pricing power.
Real-World Application: Streaming Services vs. Cable TV
Setup: 2015-2025, US pay TV market. Cable cost $100/month for 200 channels (90% unwatched). Netflix launched at $7.99/month for on-demand content.
Result: 50 million US households "cut the cord" 2015-2025. Cable subscriptions fell from 100M (2015) to 65M (2025) as streaming became perfect substitute at 1/10 the price.
Key Insight: Substitution accelerates when: (1) substitute offers better value, (2) switching costs are low (no contract cancellation fees after 2020), (3) network effects favor new platform (original content, social buzz). Netflix didn't just compete—it made cable obsolete for most users.
Business Applications
For Product Teams: Reduce substitutability through differentiation. Unique features, proprietary data, integrations, brand equity—anything that makes "close enough" alternatives unacceptable. Salesforce's ecosystem (AppExchange, Trailhead, community) makes switching to competitors painful despite similar core CRM features.
For Pricing Teams: Monitor substitutes' pricing obsessively. If you're 20% more expensive than close substitutes without clear differentiation, you'll lose share fast. Either justify premium with value or match pricing. Tesla matched luxury SUV pricing (BMW X5, Audi Q7) while offering superior tech—positioned as substitute for luxury, not economy cars.
For Strategy Teams: Map substitution threat matrix: direct substitutes (Coke vs. Pepsi), indirect substitutes (soda vs. energy drinks vs. coffee), and potential future substitutes (soda vs. personalized nutrition drinks). Allocate R&D to create barriers before substitutes mature.
Defending Against Substitution High switching costs: Data lock-in, integrations, training investment Network effects: Value increases with users (can't replicate by switching) Brand loyalty: Emotional attachment overrides rational price comparison Unique capabilities: Patents, proprietary algorithms, exclusive content Ecosystem lock-in: Platform with complementary products (Apple ecosystem)
Consumer BehaviorCompetitive DynamicsPricing Power
Law of Habit Formation: Stickiness Through Repetition
Core Principle: Repeated use creates habits that increase customer lifetime value and reduce churn. Habit strength = Frequency × Reward × Triggering cue. Once habitual, product becomes automatic (low conscious consideration).
Real-World Application: Daily Active Use Drives Retention
Setup: Early Facebook (2008-2010) analyzed user retention cohorts. Found: users who added 7+ friends within 10 days had 90%+ retention at 1 year. Users with <3 friends had 50% 30-day retention.
Result: Facebook redesigned onboarding to drive friend connections. "People You May Know" recommendations, import contacts, suggested groups. Result: 70% of new users hit "7 in 10" threshold (up from 40%), driving monthly active users from 100M (2008) to 2.9B (2024).
Key Insight: Habit loop = Trigger (notification) ? Action (open app, see friend update) ? Reward (dopamine from social validation). 7 friends = 7 potential triggers daily. Daily use ? habit ? retention. Most retention problems are actually habit formation problems.
Business Applications
For Product Teams: Design for daily use, not monthly. Slack's threading reduces email habit; Duolingo's streaks gamify daily practice; Spotify's Daily Mix personalizes discovery. Identify your product's natural usage frequency and optimize for it. B2B SaaS: daily login > weekly report > monthly review.
For Growth Teams: Define your "aha moment" metric (Facebook's "7 friends"). Measure time-to-value: how quickly do new users experience core benefit? LinkedIn found users who added profile photo + 3 connections in first week had 80% higher retention. Optimize onboarding to hit this milestone fast.
For Retention Teams: Combat churn through re-engagement campaigns targeting lapsing users. Spotify: "Your 2024 Wrapped" brings back inactive users. Duolingo: "Your 47-day streak is about to break!" notification. Trigger-action-reward loops pull users back before they fully churn.
Building Product Habits (Nir Eyal's Hook Model) Trigger: External (notification, email) or internal (boredom, loneliness) Action: Simplest behavior done in anticipation of reward (open app, scroll feed) Variable Reward: Unpredictable payoff (sometimes great post, sometimes mediocre—keeps you coming back) Investment: User adds value (post content, add friends, curate preferences) ? increases future triggers
RetentionProduct DesignBehavioral Psychology
Reference Price Effect: Customers Compare to Anchors
Core Principle: Customers evaluate price fairness relative to reference points (past prices, competitors, "original" price). Perceived value = Actual price vs. Reference price. Retailers manipulate reference points to influence purchase decisions.
Setup: Same flight NYC-LAX. Business traveler books 2 days before departure: $800. Leisure traveler books 3 months ahead: $200. Identical seat, 4× price difference.
Mechanism: Business traveler's reference price = "cost of missing meeting" ($5,000+ in lost deals, reputation damage). $800 feels cheap. Leisure traveler's reference price = "road trip cost" ($300 gas + hotels). $200 feels like deal, $800 unacceptable. Same product, different reference points, different willingness to pay.
Result: Airlines capture maximum consumer surplus through price discrimination. Leisure travelers (elastic demand, low reference price) see low prices. Business travelers (inelastic demand, high reference price) see high prices. Total revenue maximized.
Business Applications
For Pricing Teams: Anchor high, discount strategically. Display "list price" $1,000 crossed out, "sale price" $700. Customer's reference point = $1,000 (feels like 30% savings). Never show just $700 (no anchor = no perceived deal). Kohl's, Macy's built business models on perpetual "sales" against inflated MSRPs.
For E-commerce Teams: Show "X people viewing this now" and "Only 3 left!" to create urgency (reference point = future unavailability). Amazon: "Typical price $49.99, today $34.99." Dynamic pricing adjusts based on demand, but always shows reference to make current price seem favorable.
For SaaS Teams: Price relative to value created, not cost. Enterprise software: reference price = "cost of manual process" (20 employees × $50K salary = $1M). Charging $100K/year feels like 90% discount. Never say "our costs are $10K, so we charge $100K." Anchor to customer's alternative (manual process, competitor's price, ROI from time savings).
Setting Effective Reference Prices Past prices: "Was $X, now $Y" (discount framing) Competitor prices: "Others charge $X, we charge $Y" (value framing) Decoy pricing: Add expensive option to make target option seem reasonable Bundle unbundling: Show itemized value ($500 consulting + $300 software = $800 bundle, "saves $200") Temporal anchors: "Introductory price" implies future increase
Network Externalities (Demand Side): Value Grows with Users
Core Principle: Product value increases for all users when one more user joins. Unlike supply-side economies of scale (lower cost per unit), demand-side network effects increase value per user. Creates winner-take-all dynamics and high customer acquisition value.
Setup: WhatsApp launched 2009. First user (you) = zero value (no one to message). 10 friends on WhatsApp = moderate value (can message 10 people). 1 billion users (2016) = massive value (can message almost anyone globally for free).
Growth Mechanism: Viral coefficient >1. Each user invited 1.2 friends on average. Metcalfe's Law: network value = n². WhatsApp grew from 0 to 1B users in 7 years (2009-2016) without advertising. Network effects provided all customer acquisition through invitations.
Result: Facebook acquired WhatsApp for $19B (2014) despite $10M annual revenue. Paid for network, not revenue. With 1B users, WhatsApp could monetize later (ads, business API, payments). Network effects create option value on future monetization.
Business Applications
For Product Teams: Design for viral growth from day one. Invite flows, share buttons, collaborative features. Dropbox: "Invite friends, get 500MB free storage" drove 60% of signups. Zoom: "Join meeting" link requires download ? new user exposed to product. LinkedIn: "See who viewed your profile" (only visible if you have profile) ? creates FOMO, drives signups.
For Growth Teams: Calculate network density threshold. Facebook found 7 friends, LinkedIn found 3 connections, Slack found 2,000 messages sent. Before threshold: value unclear, churn high. After threshold: network effects kick in, retention spikes. Optimize onboarding to hit threshold fast (suggested connections, import contacts, team invitations).
For Pricing Teams: Price below value in early stages to maximize network growth. Once network established, raise prices (users can't leave without losing network value). LinkedIn: free tier for individuals (builds network), paid tier for recruiters (monetizes access to network). Freemium model subsidizes network growth, then captures value from power users.
Types of Network Effects Direct network effects: Value increases with same-side users (phone network, messaging apps) Indirect network effects: Value increases with complementary users (Uber: more drivers ? shorter wait times ? more riders ? more driver earnings ? more drivers) Data network effects: More users ? more data ? better product (Waze, Google Search, Netflix recommendations) Two-sided marketplace effects: More buyers attract sellers, more sellers attract buyers (eBay, Airbnb)
Platform StrategyViral GrowthWinner-Take-All
Switching Costs: High Exit Barriers Reduce Churn
Core Principle: Costs incurred when switching from one product to another create customer lock-in. Higher switching costs = lower churn = higher customer lifetime value. Switching costs can be financial (contract penalties), procedural (data migration), relational (lost integrations), or psychological (learning new interface).
Setup: Large bank using Oracle Database for 15 years. Stores 10TB transactional data, integrated with 50+ internal systems, hundreds of stored procedures written in PL/SQL (Oracle's proprietary SQL dialect).
Switching Cost Analysis: (1) Data migration: 6-12 months, $5M consulting fees. (2) Code rewrite: 200+ stored procedures need translation to new syntax. (3) Integration testing: Every system integration must be verified. (4) Risk: Database outage = millions in lost transactions. (5) Training: 50 DBAs trained on Oracle, not PostgreSQL.
Result: Despite PostgreSQL being free (vs. $500K/year Oracle licenses), bank stays with Oracle. Switching cost ($10M+ over 2 years) exceeds 20 years of license fees. Oracle raises prices 10% annually—bank grumbles but pays. Classic lock-in: initial "free" trial became 15-year commitment.
Business Applications
For Product Teams: Build switching costs strategically. (1) Data gravity: Store customer data in proprietary formats or make export difficult. (2) Integrations: Connect to 10+ third-party tools customers also use. (3) Customization: Allow deep configuration—migration would lose all settings. (4) Training investment: Complex products require months of learning (Adobe Creative Suite, AutoCAD). Salesforce's platform strategy: customers build custom objects, workflows, apps on top of CRM ? locked in.
For Customer Success Teams: Increase switching costs through value delivery. (1) Regular business reviews showing ROI (reminds customer of value). (2) Co-create roadmap (customer invested in future features). (3) Executive relationships (firing vendor = admitting mistake to board). (4) Success milestones (celebrate wins tied to your product). HubSpot: assigns dedicated customer success manager, quarterly strategy calls, certification programs. Switching would mean starting over with new vendor.
For Pricing Teams: Price based on switching costs, not just value. High switching costs = pricing power. Can raise prices 10-20% annually without churn (customers won't leave for price if switching cost is high). But beware: excessive price increases trigger "enough is enough" moments. Oracle lost customers to AWS Aurora when prices exceeded pain threshold.
Setup: 2013 Adobe shifts from perpetual licenses ($1,299 one-time for Photoshop CS6) to Creative Cloud subscription ($52.99/month for full suite). Creates multiple switching cost layers: (1) File format lock-in (.PSD, .AI files only fully compatible with Adobe apps), (2) Workflow integration (Photoshop ? Illustrator ? InDesign pipelines), (3) Learning investment (10,000+ hours mastering Adobe tools for professional designers), (4) Plugin ecosystem (third-party plugins only work with Adobe apps).
Switching Cost Impact: 2013: 4M Creative Suite subscribers. 2024: 32M Creative Cloud subscribers (8× growth). Alternatives emerged: Affinity Photo/Designer ($50 one-time, 90% feature parity), GIMP/Inkscape (free, open-source). Yet Adobe market share stable at 85%+ among professionals. Why? Switching costs prohibitive: (1) Retraining entire team ($100K+ for agency with 20 designers), (2) File format conversion (client files, archives all in Adobe formats), (3) Workflow disruption (project timelines can't absorb transition period).
Pricing Power Result: Adobe raised Creative Cloud prices 50% (2013-2024): $49.99 ? $74.99/month for Photography plan. Churn rate remains below 5% annually (extremely low for B2C subscription). Switching costs = pricing power. Revenue: $7.1B (2013) ? $19.4B (2024), 65% margins. Subscription model + switching costs created $280B market cap (2024). Key lesson: high switching costs let you raise prices without losing customers—but must maintain product quality or resentment builds (Adobe invests heavily in new features, AI integration to justify price increases).
Types of Switching Costs Financial: Contract penalties, upfront migration costs, lost discounts/credits Procedural: Data migration, integration reconfiguration, testing, deployment Relational: Lost integrations, broken workflows, partner ecosystem disruption Learning: Time to learn new product, retrain team, adapt workflows Risk: Downtime during migration, data loss, business disruption Sunk cost fallacy: "We've invested so much already, can't abandon now"
Retention StrategyCustomer Lock-InChurn Reduction
Long-Tail Law: Many Small Niches Add Up
Core Principle: In digital marketplaces, aggregate demand for niche products can exceed demand for hits. The "long tail" of low-volume items collectively outsells the "head" of high-volume items. Enabled by zero marginal cost of storage/distribution (physical retail can't stock niches due to shelf space constraints).
Setup: Barnes & Noble bookstore (physical): 200,000 book titles in stock. Top 1,000 bestsellers = 70% of sales. Remaining 199,000 titles = 30% of sales. Shelf space limited ? must stock predictable hits. Amazon (digital): 3.3M book titles available. Top 100,000 = 50% of sales. Remaining 3.2M titles = 50% of sales.
Key Insight: Physical retailer: stock top 20% of titles (80/20 rule). Digital retailer: stock everything (zero marginal cost of listing). Amazon's revenue from obscure books ($1B+ annually) exceeds most publishers' total revenue. Long tail profitable because: (1) no shelf space constraint, (2) search algorithms connect niche buyers to niche products, (3) reviews/ratings reduce discovery risk.
Result: Amazon marketplace sellers list 350M products (2024). Most sell <10 units/month individually, but collectively generate $200B GMV. Long tail is Amazon's competitive moat—no physical retailer can match selection breadth.
Business Applications
For Marketplace Teams: Optimize for long-tail supply. Reduce listing friction (Etsy: 5-minute shop setup), improve discovery (search, recommendations, SEO), provide seller tools (analytics, inventory management). Shopify: enables 4M+ merchants selling niche products. Each small, but aggregated = $200B GMV (2023). Platform's value = long tail breadth × discovery quality.
For Content Platforms: Archive everything, surface algorithmically. YouTube: 500 hours uploaded per minute. 99% get <1,000 views, but collective watch time from niche videos exceeds trending videos. Recommendation algorithm connects niche audiences to niche creators. Netflix: keeps obscure shows forever (zero storage cost), some find audience years later through recommendations.
For Product Teams: Enable customization and niche variants. Nike By You (custom sneakers), Dell's configure-to-order PCs, Salesforce's AppExchange (10,000+ niche add-ons). Let customers/developers create long tail—platform provides infrastructure. Each niche variant serves tiny market, but collectively covers massive TAM.
Long-Tail Economics (Chris Anderson's Framework) Hits (Head): Top 20% of products = 50% of revenue (physical retail focus) Niches (Tail): Bottom 80% of products = 50% of revenue (digital opportunity) Enablers: (1) Zero marginal cost of inventory, (2) Powerful search/discovery, (3) User-generated reviews reduce risk Examples: Amazon (books), Netflix (movies), Spotify (songs), Shopify (merchants), YouTube (creators) Strategy: Aggregate demand across millions of niches through platform/marketplace model
Marketplace StrategyDigital EconomicsPlatform Business Model
Core Principle: The number of transistors on a microchip doubles approximately every 18-24 months while cost per transistor halves. Drives exponential improvement in computing performance and enables tech business models that rely on ever-cheaper computation.
Setup: AWS EC2 launched 2006. Standard instance: $0.10/hour for computing power roughly equivalent to 2006 desktop PC. By 2024, same $0.10 buys 100× more computing (faster CPUs, more RAM, better storage).
Result: AWS cut prices 100+ times (2006-2024). Average annual price reduction: 15-20% for equivalent compute. Netflix streaming business model impossible at 2006 prices—encoding 4K video for 250M subscribers required compute costs 1/100th of 2006 levels. Moore's Law enabled cloud to displace on-premise IT.
Key Insight: Build businesses that benefit from deflation. AI/ML models: training cost drops 50% every 2 years (better chips). Startups can now train models on $10K that cost $1M in 2015. Defensive moat = data/algorithms, not compute (compute becomes commodity).
Business Applications
For Strategy Teams: Plan for exponential improvement in tech capabilities. Product impossible today may be viable in 3 years (example: real-time video translation required $100M infrastructure in 2015, now feasible on smartphone). Don't dismiss "too expensive" ideas—revisit as Moore's Law drives costs down. Google's self-driving car: required $150K LIDAR sensors (2010), now $500 sensors enable affordable autonomous vehicles.
For Product Teams: Design for tomorrow's compute, not today's. Netflix built streaming infrastructure assuming bandwidth/compute would improve 10× (correct bet). Build features that are "barely possible" today—they'll be easy tomorrow. But beware: if your moat is raw compute power, Moore's Law commoditizes your advantage. Sustainable moat = proprietary data, network effects, brand, not just better tech.
For Finance Teams: Model CapEx with deflation assumptions. Cloud pricing drops 15-20% annually—five-year budget for compute should assume 50%+ cost reduction. Don't lock into long-term contracts at current prices (unless deep discounts). Moore's Law rewards flexibility: month-to-month pricing captures deflation benefits.
Strategic Implications of Moore's Law What becomes possible: Real-time AI inference, edge computing, personalized medicine, autonomous vehicles What becomes commoditized: Raw compute, storage, bandwidth (cloud providers compete on price) Where to build moats: Data (training sets), algorithms (proprietary models), network effects, brand Timing strategy: Early-mover advantage in data collection, but wait for compute deflation before scaling Note: Moore's Law slowing (physics limits), but specialized chips (GPUs, TPUs, neuromorphic) continue exponential gains for specific workloads
Technology StrategyCloud EconomicsAI/ML Strategy
Experience Curve: Cost Drops with Cumulative Output
Core Principle: Unit costs decline by a consistent percentage (typically 10-25%) with each doubling of cumulative production. Driven by learning (workers get faster), process improvements (bottlenecks eliminated), and scale economies. First mover who scales fastest achieves cost advantage over followers.
Setup: Solar panel cost per watt: $76 (1977), $1.80 (2010), $0.20 (2024). Price dropped 99.7% over 47 years. Not due to raw material costs (silicon)—due to cumulative production experience.
Mechanism: Every doubling of cumulative solar installations ? 20% cost reduction (Wright's Law). Global solar capacity doubled every 2-3 years (1990-2024). Each doubling: manufacturers learned how to reduce waste, automate production, optimize supply chains. China scaled fastest (70% of global production by 2020) ? lowest costs ? dominated market.
Result: Solar now cheaper than coal in most markets (2024). Experience curve made renewable energy economically inevitable. First movers in solar (Germany, Japan) lost to fast scalers (China). Lesson: speed to scale matters more than early-mover timing.
Business Applications
For Manufacturing Teams: Track cost per unit vs. cumulative units produced. Plot on log-log scale—should be straight line downward. If cost isn't declining, you're not learning. Benchmark against industry experience curve (semiconductors: 25% reduction per doubling, aircraft: 15%, chemicals: 10%). If you're below industry curve, you're operationally weak. Above curve = competitive advantage.
For Pricing Teams: Price based on future costs, not current costs. Tesla Model 3: priced at $35K (2017 announcement) when production cost was $50K. Bet on experience curve bringing costs below price within 2 years (correct). Competitors priced EVs based on current high costs ? couldn't compete when Tesla's costs dropped 40% while prices stayed flat.
For Strategy Teams: Race to scale in new markets. First to 10,000 units has 20-30% cost advantage over competitor at 5,000 units (assuming 20% experience curve). Winner-take-most dynamics in industries with steep experience curves. Prioritize volume growth over profitability in early years—scale drives future profitability through cost reduction.
Leveraging Experience Curve Effects Measure learning rate: Track unit cost vs. cumulative volume (typically 10-30% reduction per doubling) Accelerate production: Volume maximization in early years compounds cost advantages Price for future costs: Set prices based on costs at 2× current volume, capture margin as you scale Defend through scale: High-volume incumbents have structural cost advantage (hard to displace) Caution: Experience curve flattens at maturity—diminishing returns to further volume gains
Core Principle: Disruptive innovations start in low-end or new markets (worse performance, lower cost) and improve faster than customer needs. Incumbents ignore them (not profitable, doesn't serve best customers), then get blindsided when disruptor improves enough to steal mainstream market.
Real-World Application: Digital Photography Disrupts Film
Setup: Kodak invented digital camera (1975). Image quality: terrible (0.01 megapixels). No instant gratification (view on TV). Professional photographers ignored it—film superior for print quality, color accuracy, resolution.
Disruption Path: Digital improved exponentially (Moore's Law). 1995: 1MP (acceptable for web). 2000: 3MP (acceptable for 4×6 prints). 2005: 8MP (matches film for most use cases). 2010: 12MP+ (exceeds film). Kodak dismissed threat until too late—digital sales cannibalized film revenue faster than Kodak could pivot.
Result: Kodak filed bankruptcy (2012). Film revenue collapsed from $16B (1999) to $0 (2012). Incumbents' dilemma: digital cannibalized profitable film business, so Kodak optimized for declining market instead of embracing disruptor. Classic mistake: protect existing revenue instead of cannibalizing yourself.
Business Applications
For Strategy Teams: Actively look for "bad" solutions to your problem that are improving fast. Cloud computing was terrible vs. on-premise servers (2008)—slow, unreliable, insecure. But improved exponentially while on-premise stayed flat. By 2015, cloud superior for most workloads. Don't dismiss competitors because they're "not good enough yet." Ask: "What's their improvement trajectory? Will they be good enough in 3 years?"
For Product Teams: Build "good enough" products for low-end markets, then move upmarket. iPhone (2007): worse than BlackBerry for email, worse than Nokia for calls, worse than iPod for music. But "good enough" at all three + touchscreen UI. Improved faster than incumbents, became best at everything by 2012. Disruptors don't need to be best—just good enough + improving faster.
For Innovation Teams: Create autonomous units to pursue disruptive ideas. Amazon AWS (2006): launched as separate business unit, not part of retail. Allowed to cannibalize potential server sales to retailers. Became $90B business (2024). If AWS had been inside retail org, would've been killed to "protect partner relationships." Disruption requires insulation from core business incentives.
Defending Against Disruption (Clayton Christensen Framework) Warning signs: New entrant serves "bad" customers (low-end, non-consumers), offers worse product at lower price, improves faster than you Incumbent trap: Optimize for best customers (high margin) while disruptor takes low end, then improves to steal mainstream Defense strategy: (1) Create separate business unit to pursue disruptor, (2) Cannibalize yourself before others do, (3) Acquire disruptors early Examples of disruption: Netflix vs. Blockbuster, Uber vs. taxis, Airbnb vs. hotels, Tesla vs. Detroit, Zoom vs. Cisco
Innovation StrategyCompetitive ThreatMarket Entry
Technology S-Curve: Performance Plateaus Over Time
Core Principle: Technology performance follows S-curve: slow initial progress, rapid improvement in middle phase, diminishing returns at maturity. Smart companies jump to new S-curve (next-generation tech) before current technology saturates. Late jumpers get disrupted.
Real-World Application: Hard Drive Storage Density
Setup: Hard drive areal density (bits per square inch): 2,000 (1980), 10 billion (2000), 1 trillion (2015). Growth rate: 40%/year (1980-2010), 10%/year (2010-2020), <5%/year (2020-2024). S-curve saturating—approaching physics limits of magnetic recording.
S-Curve Jump: Western Digital/Seagate optimized magnetic recording (incremental gains). Meanwhile, Samsung/Intel invested in SSDs (flash memory—different S-curve). 2015: SSDs expensive but 10× faster. 2024: SSDs same price as HDDs for consumer use cases. Incumbent HDD makers (Western Digital, Seagate) revenue declined 40% (2015-2024) as market shifted to SSDs.
Key Insight: Betting on old S-curve in late stages = betting against physics. Winners jumped to new S-curve early (Samsung invested in flash 2005-2010 when unprofitable). Incumbents optimized old tech too long, missed jump window. By 2015, too late—Samsung/Intel had scale advantage on new curve.
Business Applications
For R&D Teams: Map technology performance over time. If improvement rate slowing, you're approaching S-curve top—time to invest in next-generation tech. Intel's mistake: kept optimizing x86 CPUs (saturating S-curve) while ARM invested in mobile chips (new S-curve). By 2020, ARM dominated mobile, challenging Intel in servers. Diversify R&D: 70% on current tech, 30% on next S-curve.
For Product Teams: Don't launch major products on mature S-curves. Blockbuster invested in DVD-by-mail (2004) when streaming S-curve emerging—wrong curve, wrong timing. Netflix bet on streaming (2007) despite terrible quality—correct curve, early but right. Product lifespans: 10+ years on young S-curve, 2-3 years on mature S-curve before obsolescence.
For Strategy Teams: Identify S-curve inflection points in your industry. Battery energy density: lithium-ion S-curve maturing (incremental gains), solid-state batteries = new S-curve (10× energy density potential). Auto manufacturers investing in solid-state now (GM, Toyota) position for 2030+ market. Late movers will scramble to license technology at high cost.
Managing S-Curve Transitions Early stage (bottom): High risk, slow progress, uncertain if tech will work. Small bets, rapid experimentation Growth stage (middle): Rapid improvement, invest heavily, scale fast. Winner-take-most dynamics Maturity stage (top): Diminishing returns, incremental gains. Start investing in next S-curve Transition timing: Jump to new S-curve when old curve improvement rate <10%/year (mature) Warning: Don't jump too early (new tech not ready) or too late (competitors scaled new curve)
R&D StrategyTechnology LifecycleInnovation Timing
Cannibalization Principle: New Products Eat Old Ones
Core Principle: Launching superior product cannibalizes sales of existing product. Companies fear cannibalization, delay launches to protect legacy revenue. But if you don't cannibalize yourself, competitors will. Better to cannibalize your own revenue than lose it to rivals.
Setup: iPod revenue: $9B (2008), Apple's largest product line. iPhone (2007) included iPod functionality—music, videos, apps. Internal debate: will iPhone cannibalize iPod sales? Answer: yes. Did Apple delay iPhone? No.
Result: iPod revenue collapsed: $9B (2008) ? $4B (2010) ? $1B (2014) ? discontinued (2022). But iPhone revenue grew: $6B (2008) ? $150B (2024). Total Apple revenue: $32B (2008) ? $380B (2024). Cannibalization = correct strategy. If Apple had protected iPod, competitors (Android) would've taken both iPod AND phone markets.
Key Insight: Steve Jobs: "If you don't cannibalize yourself, someone else will." Better to cannibalize high-margin iPod with higher-margin iPhone than let Samsung/Google capture smartphone market. Cannibalization is strategic opportunity disguised as threat.
Business Applications
For Product Teams: Launch better products even if they cannibalize existing ones. Netflix launched streaming (2007) knowing it would cannibalize DVD-by-mail (100% of revenue). DVD revenue: $1.2B (2009) ? $0 (2020). Streaming revenue: $0 (2007) ? $30B (2024). Cannibalization created $200B company. If Netflix had protected DVDs, Hulu/Disney+ would've taken streaming market, leaving Netflix with dying DVD business.
For Finance Teams: Model cannibalization explicitly. New product will take X% of legacy revenue. But total revenue = (legacy - cannibalization) + (new product) + (new customers). Usually net positive if new product superior. Example: Electric vehicles cannibalize gas cars for auto manufacturers. But EVs attract new customers (environmentalists) + higher margins + avoid regulatory penalties. Net: cannibalization increases total market size.
For Sales Teams: Compensate reps on total revenue, not product-specific revenue. If iPhone rep earns more than iPod rep, reps will push iPhone (cannibalizing iPod). Align incentives with company goal (maximize total revenue), not protect legacy products. Microsoft failed at this: Windows Phone reps competed with Windows PC reps for resources. Android/iOS won while Microsoft fought internally.
Setup: 2015 Apple Watch launch: $349-$17,000 (Edition model). Product overlaps with iPod Nano ($149, used for music during workouts). Apple Watch does everything Nano does (music playback, fitness tracking) + notifications, apps, communication. Clear cannibalization scenario: should Apple delay Watch to protect Nano sales?
Cannibalization Decision: Apple proceeds despite internal analysis showing Watch would kill Nano. Logic: (1) Smartwatch category emerging (Samsung Gear, Android Wear launched 2014-2015), (2) If Apple doesn't cannibalize Nano, competitors will capture wrist computing category, (3) Watch ASP $400+ vs. Nano ASP $149 (trading up to higher-margin product), (4) Watch creates Services revenue (apps, Apple Pay transactions) that Nano doesn't.
Result: iPod Nano sales: 2.6M units (2014) ? discontinued (2017). Apple Watch sales: 12M units (2015), 56M units (2023). Revenue: Nano contributed ~$400M annually (2014). Watch contributes $18B+ annually (2023)—45× the revenue. Strategic validation: self-cannibalization captured category before competitors. Samsung smartwatch market share peaked at 12% (2015), declined to 8% (2023) as Apple Watch dominates 50%+ share. If Apple had protected Nano, would have ceded wearables category to Samsung/Fitbit. Lesson: cannibalize yourself or competitors will cannibalize you—always choose self-cannibalization when new technology enables superior product experience.
Strategic Cannibalization Framework When to cannibalize: New product objectively better, competitors emerging, legacy product saturating How to manage: Launch in separate business unit (avoid internal resistance), compensate sales on total revenue, communicate cannibalization as growth strategy Metrics to track: Total revenue (legacy + new), customer acquisition (new product attracts different customers?), margin improvement (new product higher margin?) Classic examples: iPhone vs. iPod, Netflix streaming vs. DVD, AWS vs. on-premise servers, Tesla EVs vs. internal combustion Failure cases: Kodak protected film over digital, Nokia protected feature phones over smartphones, Blockbuster protected stores over streaming
Core Principle: Successful companies fail not because they're lazy or incompetent, but because they do exactly what made them successful—listen to best customers, optimize for high margins, invest in sustaining innovations. This blinds them to disruptive innovations that initially serve "bad" customers with "worse" products.
Real-World Application: Enterprise Software Disrupted by SaaS
Setup: Siebel Systems dominated CRM (1999-2005). Enterprise customers paid $1M+ for on-premise software (18-month implementations). Salesforce launched SaaS CRM (1999): $50/user/month, cloud-based, 5-day setup. Siebel dismissed it: "Not enterprise-grade. Can't customize. Security issues. Our customers would never buy this."
Dilemma Mechanism: Siebel's best customers (Fortune 500) wanted deep customization, on-premise control, dedicated support. Salesforce served "bad" customers (SMBs, startups) with simple needs. Siebel optimized for best customers—added features, complexity, price. Meanwhile, Salesforce improved: added customization (2005), security certifications (2007), enterprise features (2010). By 2012, "good enough" for Fortune 500. Siebel's revenue: $2B (2004) ? acquired by Oracle (2006) ? irrelevant (2012).
Result: Salesforce market cap: $250B (2024). Siebel's rational decisions (serve best customers, optimize high-margin on-premise deals) led to disruption. Doing "right" thing (listening to customers) = strategic failure. Innovator's Dilemma.
Business Applications
For Strategy Teams: Explicitly ignore best customers when evaluating disruptions. Ask: "If we served worst customers (low-end, non-consumers) instead of best customers, what would we build?" Salesforce served small businesses (Siebel ignored). Zoom served consumers (Cisco focused on enterprise). Tesla served luxury buyers (Detroit focused on mainstream). All became category leaders by serving "wrong" customers first.
For Product Teams: Separate sustaining vs. disruptive innovation. Sustaining: makes existing product better for existing customers (higher margins). Disruptive: worse product for different customers (lower margins). Allocate resources: 70% sustaining (feeds current revenue), 30% disruptive (protects future). Netflix: 70% optimizing streaming quality/content, 30% experimenting with gaming/live sports (potential disruptors).
For Leadership Teams: Create autonomous units for disruptive innovations. Amazon AWS: separate P&L, separate leadership, different metrics (growth vs. profitability). Allowed to "waste" resources on "bad" customers (startups paying $100/month vs. enterprise paying $100K). Became $90B business by serving customers Amazon retail would've ignored. Structure determines strategy—traditional divisions can't pursue disruption (wrong incentives).
Escaping the Innovator's Dilemma Warning signs you're trapped: (1) Product getting more complex for best customers, (2) Ignoring low-end competitors as "not good enough", (3) Margins increasing (focus on profitable customers), (4) "Our customers don't want that" dismissing simpler alternatives Escape strategies: (1) Create separate business unit with different success metrics, (2) Acquire disruptors early (Facebook buying Instagram/WhatsApp), (3) Launch "worse" product intentionally for low-end market, (4) Compensate execs on long-term market share, not short-term margins Examples of failure: Blockbuster, Nokia, BlackBerry, Kodak, Borders, Circuit City—all did "right" thing serving best customers, all disrupted Examples of success: Microsoft (cloud), Adobe (subscription), Apple (iPhone), Amazon (AWS)—all cannibalized high-margin businesses to avoid disruption
46. Law of Time Value of Money: Why Timing Is Everything
Core Principle: A dollar today is worth more than a dollar tomorrow due to opportunity cost, inflation, and risk. Future cash flows must be discounted to present value.
Core Idea: Wage elasticity measures how sensitive employment levels are to wage changes. If demand is inelastic (elasticity < 1), a 10% wage increase causes < 10% employment decline. If elastic, employment drops more sharply.
Immigration Implication: In industries with low elasticity (e.g., healthcare, where RN demand is relatively fixed), immigration has smaller wage effects because firms absorb higher wages rather than cutting headcount. In high-elasticity sectors (e.g., construction), wage effects are larger.
Business Example: U.S. agriculture (elasticity ~0.7) faced labour shortages during COVID-19 border closures. Farms couldn't easily substitute capital for labour, so they raised wages 15-20% to attract domestic workers—but employment still fell because demand was relatively inelastic.
Key Insight: Elastic demand ? immigration has larger wage impact but smaller employment impact. Inelastic demand ? smaller wage impact, but firms struggle to fill roles without immigrant labour (shortages dominate).
Marginal Productivity
3. Marginal Productivity of Labour
Core Idea: Wages reflect the marginal revenue product of labour—the additional output (revenue) generated by the last worker hired. Firms hire until MRP = wage.
Immigration Implication: Skilled migrants with high marginal productivity (e.g., AI researchers, semiconductor engineers) raise average productivity, justifying higher wages for the entire team. Low-skilled immigration may have smaller productivity effects unless complementarity exists (see next).
Business Example: Google's 2018 hiring of AI researcher Geoffrey Hinton (immigrant from UK) increased productivity of entire Google Brain team (50+ researchers)—one high-MRP hire raises output of complementary workers through knowledge spillovers.
Strategic Application:
Talent Segmentation: Separate compensation strategies for high-MRP roles (star engineers, sales leaders) vs. median-MRP roles—immigration policy affects availability in both tiers differently
Productivity Measurement: Track MRP by role to justify premium compensation for scarce immigrant talent (data-driven negotiation)
Substitution vs Complementarity
4. Substitution vs Complementarity
Core Idea: Immigrant workers can substitute for (replace) or complement (enhance) native workers. Substitutes compete for same roles (downward wage pressure). Complements increase demand for each other (upward wage pressure).
Immigration Implication: Low-skilled immigrants often complement high-skilled natives (e.g., domestic workers free up time for professionals to work more hours, raising demand for professional services). High-skilled immigrants may substitute OR complement depending on specialization.
Business Example: U.S. tech sector (2000-2020): Indian H-1B software engineers initially seen as substitutes (wage suppression fears), but research showed complementarity—immigrant engineers enabled faster product development, increasing demand for U.S.-based product managers, designers, and sales teams. Native wages in complementary roles rose 5-10%.
Key Insight: Complementarity dominates when immigrants have different skills (language, technical specialties, cultural knowledge) or enable scale (more engineers ? more projects ? more PMs needed). Substitution dominates when skills are identical and demand is fixed.
B. Human Capital & Skill Economics
Human capital—the skills, education, and experience embodied in workers—drives productivity and economic growth. Immigration policy is fundamentally a human capital policy: which skills to import, how to recognize credentials, and whether to attract or lose talent.
Human Capital Theory
1. Human Capital Theory
Core Idea: Investment in education and training increases productivity, which raises wages. Workers with more human capital earn more because they produce more.
Immigration Implication: Skilled immigration is a shortcut to human capital accumulation—importing trained workers is faster than educating domestic workers (years vs. decades). Countries compete for high-human-capital migrants.
Business Example: SpaceX's rocket engineering team (2015-2025) includes ~40% foreign-born engineers (PhDs in aerospace, materials science). Training domestic engineers to equivalent level would take 8-10 years (undergrad + PhD + experience). Immigration policy = competitive advantage in deep-tech talent races.
Strategic Application:
Build-vs-Buy Talent: High human capital requirements ? favour immigration (faster). Moderate requirements ? favour training programs (cheaper long-term).
Credential Recognition: Work with governments to streamline foreign credential recognition (reduce friction, unlock latent human capital)
Skill-Biased Technological Change
2. Skill-Biased Technological Change (SBTC)
Core Idea: Technology complements high-skilled labour (raises demand) and substitutes for low-skilled labour (reduces demand). Wage inequality rises as demand shifts toward skills.
Immigration Implication: As tech advances (AI, automation), demand for high-skilled immigrants rises (software engineers, data scientists) while demand for low-skilled immigrants falls (routine manual labour increasingly automated). Immigration policy debates focus on skill-selective visas.
Business Example: Amazon warehouse automation (2015-2025) reduced demand for low-skilled workers (picking, packing automated) while increasing demand for robotics engineers, ML specialists, operations researchers. High-skilled immigrant hiring surged (H-1B, O-1 visas) while low-skilled hiring stagnated.
Key Insight: SBTC amplifies complementarity of skilled immigration (tech adoption requires skilled workers) and substitution of low-skilled immigration (tech replaces routine tasks). Firms should align talent strategy with automation roadmap.
Brain Gain / Brain Drain
3. Brain Gain / Brain Drain
Core Idea: Talent migration creates winners (destination countries gain human capital = brain gain) and losers (origin countries lose talent = brain drain). Net effect depends on remittances, return migration, and diaspora networks.
Immigration Implication: Host countries (U.S., Canada, Germany) gain innovation, tax revenue, entrepreneurship. Origin countries (India, China, Eastern Europe) lose talent but benefit from remittances ($89B from U.S. to India annually) and returnees with skills/capital.
Business Example: Indian diaspora in Silicon Valley (1980-2020) = brain drain initially (IIT graduates ? U.S. tech firms). But by 2000s, brain circulation emerged: returnees founded Flipkart, Zomato, Ola (unicorns) with Valley networks/capital. Brain drain ? brain gain (for origin) when returnees bring knowledge back.
Strategic Application:
Global Talent Pipelines: Partner with universities in origin countries (India's IITs, China's Tsinghua) to create talent pipelines—reduces friction, builds brand
Diaspora Networks: Leverage immigrant employees' networks for international expansion (cultural knowledge, trust networks = lower transaction costs)
Credential Recognition
4. Credential Recognition Frictions
Core Idea: Skills need validation in new labour markets. Foreign credentials (degrees, licenses, certifications) often unrecognized, creating underemployment—doctors driving taxis, engineers in low-skill jobs. Frictions reduce productivity and waste human capital.
Immigration Implication: Even when skilled immigrants arrive, credential recognition delays slow labour market integration. Canada's foreign-trained doctors (2010s) took 5-7 years to re-certify, working below skill level in interim—productivity loss.
Business Example: Uber/Lyft drivers in U.S. cities (2015-2020) include high share of foreign-born workers with degrees (engineers, accountants from Latin America, Middle East). Credential recognition barriers ? underemployment ? gig economy absorption. Productivity loss = economy-wide inefficiency.
Strategic Application:
Internal Credential Validation: Develop in-house assessment tools (coding tests, case studies) to evaluate foreign credentials—bypass regulatory lag, access underutilized talent
Advocacy: Lobby for mutual recognition agreements (MRAs) between countries to streamline credential validation (e.g., EU's Bologna Process for education, APEC's engineer mobility framework)
C. Comparative Advantage & Trade-in-Labour
Comparative advantage explains why countries specialize and trade goods—but it also applies to labour mobility. Workers migrate to regions where their skills have higher returns, reallocating global labour for efficiency gains.
Comparative Advantage in Labour
1. Comparative Advantage (Labour Specialization)
Core Idea: Countries specialize in industries where they have relative efficiency advantages. Labour-abundant countries export labour-intensive goods; capital-abundant countries export capital-intensive goods.
Immigration Implication: Migration reallocates labour from low-productivity regions (where labour is abundant, wages low) to high-productivity regions (where labour is scarce, wages high)—global efficiency improves.
Business Example: Philippine nurses migrating to U.S. hospitals (2000-2020): Philippines has comparative advantage in nurse training (English-speaking, lower costs), U.S. has comparative advantage in healthcare delivery (capital-intensive hospitals, advanced tech). Migration = labour trade—both countries gain (Philippines: remittances, U.S.: filled shortages).
Key Insight: Just as trade in goods increases global welfare, labour mobility increases global productivity by moving workers to where their marginal product is highest. Restrictions on migration = deadweight loss (unrealized gains from trade).
Factor Price Equalization
2. Factor Price Equalization Theorem
Core Idea: Free trade in goods equalizes factor prices (wages, returns to capital) across countries—even without factor mobility. If labour can't move, trade in labour-intensive goods substitutes.
Immigration Implication: Labour migration accelerates wage convergence. Unrestricted migration would narrow U.S.-Mexico wage gap faster than trade alone (empirical estimates: migration reduces gap by 50% vs. 20% for trade). Migration = direct factor mobility (stronger than trade-induced equalization).
Business Example: Eastern Europe post-EU expansion (2004): Polish workers migrated to Germany/UK, raising Polish wages 30-40% (2004-2015) as labour supply tightened in Poland. German/UK wages for low-skilled roles stagnated but didn't fall significantly (complementarity + demand elasticity). Wage gap narrowed from 5:1 to 3:1.
Strategic Application: Multinational firms arbitrage wage differentials—locate low-skill operations in low-wage countries (offshoring) OR bring workers to high-wage countries (immigration). Trade policy vs. immigration policy = substitutes from firm perspective.
Heckscher-Ohlin Model
3. Heckscher-Ohlin Model (Factor Mobility)
Core Idea: Factors of production (labour, capital) move to regions where returns are higher. Capital flows to labour-rich countries (where returns to capital are high); labour flows to capital-rich countries (where wages are high).
Immigration Implication: Labour migrates from developing countries (labour-abundant, low wages) to developed countries (capital-abundant, high wages). This reallocation raises global output—workers produce more where capital is plentiful (machinery, infrastructure, institutions).
Business Example: Mexican software engineers migrating to Silicon Valley (2010-2020): Mexico has skilled labour (growing tech education), but limited capital (VC funding, mature tech infrastructure). U.S. has abundant capital. Engineers' productivity 3-5x higher in U.S. due to capital complementarity (cloud infrastructure, product expertise, distribution networks). Migration = efficient reallocation.
Key Insight: Labour mobility is most beneficial when workers move to capital-rich environments where their productivity is maximized. Firms should focus immigration efforts on roles where capital complementarity is highest (deep-tech, infrastructure-intensive industries).
D. Employment, Wages & Distribution Effects
Immigration doesn't affect all workers uniformly—impacts vary by skill level, industry, and labour market institutions. Understanding wage dispersion and segmentation is critical for predicting distributional effects.
Wage Dispersion
1. Wage Dispersion (Labour Market Segmentation)
Core Idea: Labour markets are segmented—high-skilled vs. low-skilled, tradable vs. non-tradable sectors, unionized vs. non-unionized. Wages respond differently to immigration shocks across segments.
Immigration Implication: Immigration effects vary by skill group. Empirical consensus: high-skilled immigration raises wages for complementary workers (managers, creatives) and has minimal impact on high-skilled natives (substitution offset by demand growth). Low-skilled immigration has small negative effect on low-skilled natives in short run (~2-5% wage decline), larger in long run if capital doesn't adjust.
Business Example: U.S. construction industry (2000-2020): Mexican immigrant labour increased supply of low-skilled workers (drywall, framing), reducing wages for native low-skilled construction workers 3-7% in high-immigration metro areas. But wages for skilled trades (electricians, plumbers, foremen) rose 5-8% due to complementarity—more low-skill labour ? more projects ? higher demand for supervision/specialized skills.
Strategic Application:
Compensation Modeling: Segment workforce by skill/substitutability to predict wage trajectory under different immigration scenarios
Talent Mix Optimization: In complementarity-dominant sectors, increase immigrant hiring in low-skill roles to raise productivity of high-skill natives (and justify wage premiums)
Insider-Outsider Theory
2. Insider-Outsider Theory
Core Idea: Protected workers ("insiders"—tenured, unionized, with firm-specific skills) resist entry of new workers ("outsiders") because competition threatens their wages and job security. Insiders have political power to lobby for restrictions.
Immigration Implication: Political opposition to immigration often comes from incumbent workers in affected sectors, even when overall economic impact is positive. Diffuse gains (consumers, employers, complementary workers) vs. concentrated losses (substitutable workers) ? insider lobbying dominates policy.
Business Example: U.S. tech sector H-1B visa debates (2015-2020): Incumbent U.S. software engineers (insiders) lobbied against H-1B expansion, arguing wage suppression. Evidence showed minimal wage impact (demand elasticity high, complementarity), but concentrated losses (perceived competition) mobilized opposition. Diffuse gains (faster product development, lower consumer prices) lacked organized lobby.
Key Insight: Insider-outsider dynamics explain why economically beneficial immigration faces political resistance. Firms must manage this by: (1) demonstrating complementarity (immigration raises native wages in complementary roles), (2) investing in reskilling insiders (reduce substitution fears), (3) building coalitions with beneficiaries (consumers, shareholders).
Minimum Wage Interaction
3. Minimum Wage Interaction Effects
Core Idea: Minimum wages create wage floors. If immigration pushes market-clearing wages below the minimum, employment adjusts instead of wages (unemployment rises OR employers invest in automation).
Immigration Implication: In low-minimum-wage regions, immigration reduces wages. In high-minimum-wage regions, immigration has smaller wage effects but potentially larger employment effects (firms hire fewer workers OR substitute capital for labour).
Business Example: Seattle's $15 minimum wage (2014-2018) coincided with immigration influx. Restaurant industry couldn't lower wages below $15, so employment growth slowed (hours cut, automation accelerated—kiosks, delivery apps). In Texas (lower minimum wage), similar immigration ? wage stagnation but employment growth continued.
Strategic Application: In high-minimum-wage jurisdictions, immigration policy changes affect hiring decisions more than compensation. Model employment adjustments (headcount, automation ROI) rather than wage adjustments when minimum wage binds.
Occupational Licensing
4. Occupational Licensing Barriers
Core Idea: Professional licenses (doctors, lawyers, electricians, cosmetologists) create entry barriers, restricting labour supply and raising wages for incumbents. Licensing requirements often don't recognize foreign credentials.
Immigration Implication: Immigrants face higher barriers in licensed occupations (must re-certify, sometimes impossible). This reduces effective labour supply in licensed sectors, creating shortages and wage premiums despite latent immigrant talent.
Business Example: U.S. physician shortages (2010-2020) despite 15,000+ foreign-trained doctors working in non-medical roles. Medical licensing boards require U.S. residency (limited slots), creating artificial scarcity. Wages for U.S. doctors remain elevated ($200K+ median) while foreign-trained talent is underutilized.
Strategic Application: In licensed industries, lobby for reciprocal recognition agreements (e.g., EU mutual recognition directives) to unlock immigrant talent pools. In unlicensed industries, poach talent leaving licensed sectors due to credential barriers (arbitrage inefficiency).
E. Firm-Level & Business Economics (Labour)
From the firm's perspective, immigration affects cost structures, scaling capacity, labour market matching, and productivity spillovers. These microeconomic mechanisms translate macro immigration trends into business strategy.
Cost Minimization (Labour)
1. Cost Minimization Principle
Core Idea: Firms choose input combinations (labour, capital) that minimize costs for given output levels. When labour becomes relatively cheaper (immigration increases supply), firms substitute labour for capital.
Immigration Implication: Immigration eases labour shortages, allowing firms to expand production without bidding up wages or investing heavily in automation. This is especially valuable in labour-intensive industries (agriculture, hospitality, construction).
Business Example: California agriculture (2000-2020): Mexican immigrant labour enabled labour-intensive crop production (strawberries, grapes) to remain competitive vs. automation. When border enforcement tightened (2017-2019), labour shortages forced farms to either raise wages 20-30% OR invest in mechanical harvesters (high CapEx). Many small farms exited market—cost minimization disrupted.
Strategic Application:
Make-vs-Buy Labour: In labour-intensive operations, immigration policy = critical input cost driver. Monitor policy closely; have contingency plans (automation investment, offshoring) if immigration tightens
Geographic Arbitrage: Locate labour-intensive operations in immigration-friendly jurisdictions (Canada, Germany) to secure labour supply and minimize costs
Returns to Scale (Labour)
2. Returns to Scale (Labour Abundance)
Core Idea: Increasing returns to scale occur when doubling inputs more than doubles output. Labour abundance from immigration enables firms to scale operations, achieve efficiency gains, and compete globally.
Immigration Implication: Immigration allows firms to scale faster without hitting labour constraints. This is critical in winner-take-all markets where speed to scale determines market share (tech platforms, logistics networks).
Business Example: Amazon warehouse expansion (2010-2020) relied on immigrant labour (40-50% of warehouse workers in high-immigration metro areas). Labour abundance enabled rapid network buildout—100+ warehouses in 5 years. Without immigration, wage bidding wars + slower hiring would have delayed expansion, allowing competitors (Walmart, Target) to close gap.
Key Insight: In industries with increasing returns to scale, immigration is a strategic asset—enables faster growth, network effects, and first-mover advantages. Talent strategy = competitive moat in scale-driven markets.
Matching Theory (Labour Markets)
3. Matching Theory (Search & Fit)
Core Idea: Labour markets involve search and matching—firms seek workers with specific skills; workers seek roles matching their preferences. Better matching (right skills, right roles) raises productivity.
Immigration Implication: Immigration improves match quality by expanding talent pools—firms find better skill matches, reducing under-employment and skill mismatches. This is especially valuable for specialized roles (AI researchers, biotechnology engineers, quant traders).
Business Example: Stripe's payments infrastructure team (2015-2020) required rare skill combination: distributed systems expertise + financial regulations knowledge + security engineering. Global talent pool (immigration) enabled finding 10-15 engineers worldwide who matched all three criteria. Domestic-only talent pool would have forced compromises (train generalists ? longer timelines, lower quality matches).
Strategic Application:
Specialized Roles: For niche skill requirements, immigration = match quality advantage. Invest in global recruiting infrastructure (visa support, relocation) to access best matches
Time-to-Fill Metrics: Track hiring velocity for critical roles—immigration restrictions lengthen time-to-fill, delaying product launches. Quantify opportunity cost to build business case for immigration support
Productivity Spillovers
4. Productivity Spillovers (Knowledge Diffusion)
Core Idea: Knowledge diffuses across workers through collaboration, mentorship, and observation. High-productivity workers (e.g., skilled immigrants with unique expertise) raise productivity of co-workers through spillovers.
Business Example: Tesla's Gigafactory (2015-2020): German engineers (immigrants from automotive industry) brought lean manufacturing expertise. Knowledge spillovers raised productivity of U.S. production engineers 15-20% (learning by proximity—observing German engineers' problem-solving, adopting techniques). Spillovers = multiplier effect on immigrant talent value.
Key Insight: Productivity spillovers mean immigration's value exceeds direct output of immigrant workers—team-level effects dominate. Structure teams to maximize knowledge transfer (mixed-nationality teams, cross-training programs, documentation of tacit knowledge).
F. Public Finance & Fiscal Economics (Immigration)
Immigration's fiscal impact—taxes paid vs. public services consumed—is central to policy debates. Understanding life-cycle fiscal dynamics, dependency ratios, and welfare incentives clarifies business implications.
Fiscal Balance
1. Fiscal Balance (Taxes vs. Services)
Core Idea: Immigrants' net fiscal contribution = taxes paid minus public services consumed (education, healthcare, infrastructure). High-skilled immigrants are typically net contributors (high taxes, low service use); low-skilled may be net consumers in short run but contributors over lifetime.
Immigration Implication: Skilled immigration improves fiscal balance (high income taxes, payroll taxes, low welfare use). This funds public goods (infrastructure, R&D) that benefit businesses. Low-skilled immigration has smaller short-run fiscal benefit but long-run gains if children of immigrants are upwardly mobile (intergenerational mobility).
Business Example: U.S. fiscal impact studies (2010-2020): Immigrants with college degrees contribute $200K-$300K net present value over lifetime (taxes minus services). High school dropouts contribute $100K-$150K NPV (lower taxes, but still positive due to payroll taxes + children's future taxes). Skilled immigration = fiscal subsidy for public goods businesses rely on.
Strategic Application: Businesses benefit from immigrant-funded public goods (roads, ports, broadband). Advocate for skill-selective immigration to maximize fiscal contributions, which fund infrastructure investments firms rely on.
Life-Cycle Tax Model
2. Life-Cycle Tax Model
Core Idea: Individuals consume public services when young (education) and old (healthcare, pensions) but pay most taxes during working years (ages 25-65). Net fiscal contribution depends on arrival age and lifecycle stage.
Immigration Implication: Young immigrants (arrive ages 20-30) = fiscal benefit—they bypass education costs (paid by origin country), contribute taxes during peak earning years, and won't collect pensions for decades. Older immigrants (arrive 50+) have smaller fiscal benefit (fewer working years remaining).
Business Example: Canada's Express Entry system prioritizes young immigrants (points for age 25-35). This maximizes fiscal benefit—immigrants contribute taxes for 30-40 years before pension eligibility. U.S. H-1B program has similar age skew (median age ~28). Life-cycle optimization = policy design insight.
Key Insight: From business perspective, young immigrant workers = long tenure potential (retention advantage) + fiscal contributions fund public goods. Recruiting strategies should emphasize young talent to align with life-cycle fiscal logic.
Welfare Magnet Hypothesis
3. Welfare Magnet Hypothesis
Core Idea: Generous welfare benefits attract immigrants seeking public assistance rather than employment. If true, immigration imposes fiscal costs (welfare spending) without offsetting tax revenue.
Immigration Implication: Empirical evidence generally weak—most immigrants migrate for economic opportunity (jobs, wages) not welfare. Welfare use rates for immigrants similar to natives with comparable income/education. Fiscal cost fears often overstated.
Business Example: Nordic countries (Denmark, Sweden, Norway) with generous welfare systems (2000-2020): Immigration rates remained high despite welfare availability, driven by labour demand (healthcare, IT, engineering shortages). Immigrants' welfare use slightly higher initially (language barriers, credential recognition delays) but converges to native levels within 5-10 years. Welfare magnet effect minimal.
Strategic Application: Businesses shouldn't assume welfare benefits deter immigration or reduce labour supply. Empirically, labour demand (job availability, wage gaps) dominates welfare considerations. Focus recruiting on opportunity messaging, not welfare avoidance.
Dependency Ratios
4. Dependency Ratios (Demographic Aging)
Core Idea: Dependency ratio = (population <15 + population >65) / working-age population (15-64). High ratios = fewer workers supporting more dependents (children + retirees) ? fiscal strain (pension/healthcare costs) + labour shortages.
Immigration Implication: Immigration of working-age adults lowers dependency ratios, easing fiscal strain and labour shortages. This is critical in aging societies (Japan, Germany, Italy) where birth rates below replacement level.
Business Example: Germany's skilled immigration reforms (2018-2020) driven by demographic crisis—dependency ratio projected to reach 1:1 by 2050 (1 worker per 1 dependent). Immigration targeted to increase working-age population, stabilize pension system, and fill 1.2M labour shortages. Businesses (automotive, manufacturing, healthcare) lobbied for reforms—labour supply = existential issue.
Key Insight: In aging markets, immigration policy = labour supply policy. Firms should model demographic trends (dependency ratios, labour force growth) to forecast talent scarcity and advocate for pro-immigration policies as business necessity.
G. Dynamic & Long-Run Growth Effects
Immigration's long-run effects on innovation, productivity, and economic growth often dominate short-run wage effects. Endogenous growth theory, agglomeration economies, and network effects explain why immigration is a growth driver.
Endogenous Growth Theory
1. Endogenous Growth Theory (Talent-Driven Innovation)
Core Idea: Long-run economic growth is driven by innovation (new ideas, technologies), which depends on human capital (researchers, engineers, entrepreneurs). More talent ? more innovation ? faster growth.
Immigration Implication: Immigration increases talent supply, especially skilled workers who drive innovation. Empirical studies: 1% increase in immigrant share of population ? 0.5-1% increase in patents, scientific publications, startup formation. Immigration = growth accelerator.
Business Example: U.S. biotech innovation (2000-2020): 40-50% of NIH-funded researchers are foreign-born. Immigrant scientists contributed to mRNA vaccine development (Moderna's Noubar Afeyan, immigrant from Lebanon; BioNTech's Ugur Sahin, immigrant in Germany from Turkey). Immigration = innovation capacity.
Strategic Application:
R&D Strategy: In innovation-intensive industries, immigration policy is R&D policy. Advocate for STEM immigration to maintain innovation pipelines (PhDs, postdocs, researchers)
Geographic Clustering: Locate R&D in immigration-friendly regions (Boston, San Francisco, Toronto, Berlin) to access global talent ? innovation velocity advantage
Agglomeration Economies
2. Agglomeration Economies (Cluster Effects)
Core Idea: Productivity rises when firms and workers cluster in cities/regions (knowledge spillovers, specialized labour pools, supplier networks). Density = productivity multiplier.
Immigration Implication: Immigrants concentrate in cities (NYC, London, Toronto, Singapore), increasing density and agglomeration benefits. Immigrant entrepreneurs + workers thicken labour markets, raising match quality and productivity for all firms in cluster.
Business Example: Silicon Valley's success (1980-2020) partly driven by immigrant talent density—50-60% of tech workers foreign-born in peak years. Agglomeration effects: (1) specialized labour pools (ML engineers, growth hackers), (2) knowledge spillovers (engineers switch firms, spread techniques), (3) network effects (venture capital, mentorship, talent referrals). Immigration = agglomeration fuel.
Key Insight: Agglomeration economies mean immigration benefits extend beyond individual firms—ecosystem-wide productivity gains. Firms should invest in cluster development (lobby for immigration-friendly policies, fund ecosystem programs) to capture spillovers.
Network Effects (Migration)
3. Network Effects (Migration Networks)
Core Idea: Migration networks = social ties (family, friends, diaspora) connecting origin and destination. Networks reduce migration costs (information, job leads, housing), creating self-reinforcing flows—more migrants ? stronger networks ? more migration.
Immigration Implication: Once migration flows start, they tend to persist due to network effects. This creates path dependence—historical migration patterns (e.g., Indian engineers to Silicon Valley, Mexican workers to California agriculture) compound over time.
Business Example: Indian diaspora in U.S. tech (1980-2020): Initial wave of IIT graduates (1980s-1990s) created networks that recruited subsequent waves. By 2020, Indian network effects so strong that Silicon Valley firms have dedicated India recruiting pipelines—campus partnerships, alumni networks, referral programs. Network effects = self-sustaining talent pipeline.
Strategic Application:
Diaspora Networks: Leverage existing immigrant employees' networks for recruiting—referrals have higher quality (pre-screened cultural fit) and lower cost (network trust reduces friction)
Origin-Country Partnerships: Invest in relationships with universities/companies in high-migration origin countries (e.g., India's IITs, China's Tsinghua, Israel's Technion) to tap network effects
Demographic Transition
4. Demographic Transition (Labour Force Decline)
Core Idea: Demographic transition = falling birth rates + aging population ? shrinking working-age population. Without immigration, labour force declines, slowing economic growth (fewer workers ? less output).
Immigration Implication: Immigration offsets labour force decline in aging societies. This is critical for maintaining GDP growth, pension sustainability, and business expansion in developed countries.
Business Example: Japan's demographic crisis (2000-2020): Working-age population declined 10M (2000-2020), labour shortages across industries (manufacturing, healthcare, services). Japan historically restrictive on immigration, but 2018 reforms opened doors (new visa categories) due to growth constraints. Firms (Toyota, Panasonic, SoftBank) lobbied for immigration—labour supply = growth bottleneck.
Key Insight: In aging markets, immigration is economic necessity not policy choice. Firms should prepare for immigration expansion in currently-restrictive markets (Japan, South Korea, China in 2030s) as demographic pressures mount. Early movers in immigration-friendly talent strategies gain competitive advantage.
H. Informality, Frictions & Institutions
Labour market frictions—search costs, informal work, legal restrictions, institutional quality—shape how immigration affects employment, productivity, and wages. Reducing frictions maximizes immigration's benefits.
Search & Matching Frictions
1. Search & Matching Frictions
Core Idea: Jobs take time to fill (search costs, interviewing, negotiation). Frictions = unemployment coexists with vacancies (firms can't find workers; workers can't find jobs). Reducing frictions improves matching efficiency.
Immigration Implication: Immigration reduces search frictions by expanding labour supply, especially for hard-to-fill roles. Firms fill vacancies faster, reducing opportunity costs of unfilled positions (delayed projects, lost sales).
Business Example: U.S. nursing shortages (2010-2020): Average time-to-fill for RN positions 60-90 days. Hospitals recruited internationally (Philippines, India) to reduce search frictions—immigrant nurses filled 15-20% of openings in high-shortage metro areas. Faster hiring ? shorter patient wait times ? higher hospital revenues. Immigration = friction reduction.
Strategic Application:
Time-to-Fill Metrics: Track vacancy duration by role; prioritize immigration recruiting for high-friction positions (long time-to-fill, high opportunity cost)
Proactive Recruiting: Build immigration talent pipelines before vacancies open (university partnerships, visa sponsorship offers) to minimize search time when hiring need arises
Informal Labour Markets
2. Informal Labour Markets (Undocumented Work)
Core Idea: Informal labour = workers without legal employment authorization (undocumented immigrants, expired visas). Informal workers accept lower wages (no bargaining power, limited legal recourse), distorting wage levels and creating two-tier labour markets.
Immigration Implication: Large informal sectors depress wages in low-skill occupations (construction, hospitality, agriculture) because undocumented workers compete without labour protections. Regularization (legalization) raises wages and productivity (workers invest in skills, switch to higher-productivity jobs).
Business Example: U.S. agriculture (2000-2020): 50-70% of farmworkers undocumented. Informal status = wage suppression (~20-30% below legal minimum in some regions) + lower productivity (high turnover, fear of detection limits skill investment). Immigration reform proposals (path to legal status) opposed by some farm employers fearing wage increases, supported by others valuing stability + productivity gains from legal workforce.
Key Insight: Informal labour creates short-term cost advantage (lower wages) but long-term productivity loss (turnover, under-investment in skills, legal risks). Firms should weigh trade-offs: cost savings vs. productivity/compliance risks. Policy advocacy toward legal pathways reduces risks while maintaining labour supply.
Legal Status & Productivity
3. Legal Status & Productivity Effects
Core Idea: Workers' legal status (citizenship, permanent residency, temporary visas, undocumented) affects productivity—legal workers have rights (minimum wage, labour protections), invest in skills, and switch to better-matched jobs. Precarious status reduces productivity (job mismatch, under-investment).
Immigration Implication: Regularization (granting legal status) raises productivity by reducing job mismatch and enabling skill investment. Studies show 5-15% wage gains post-legalization (workers switch to better jobs, negotiate higher pay).
Business Example: DACA (Deferred Action for Childhood Arrivals, 2012): ~700K undocumented young adults received temporary legal status. Post-DACA studies showed 20-25% wage increases (moved from informal jobs to formal sector), 15-20% increase in college enrollment (legal status ? skill investment), and higher job switching rates (better matches). Productivity gains from regularization = 10-15% (better allocation of talent).
Strategic Application: Firms employing workers with precarious status should advocate for legalization pathways—productivity gains offset potential wage increases. Calculate NPV of productivity improvements vs. wage costs to build business case for immigration reform.
Rule of Law (Institutional Quality)
4. Rule of Law & Institutional Quality
Core Idea: Rule of law = predictable enforcement of contracts, property rights, and regulations. Strong institutions attract investment (capital + labour) by reducing uncertainty and transaction costs.
Immigration Implication: Countries with strong rule of law attract high-skilled immigration (predictable visa processes, contract enforcement, intellectual property protection). Weak institutions ? brain drain (talent leaves for stable jurisdictions).
Business Example: India's brain drain (2000-2020) to U.S./Canada/Singapore driven partly by institutional quality gaps—U.S. has stronger IP protection (critical for biotech, software), predictable immigration pathways (H-1B, green cards), and rule of law (contract enforcement). Indian engineers/scientists migrate seeking institutional stability as much as higher wages.
Strategic Application:
Institutional Risk Assessment: When expanding internationally, assess rule of law + immigration policy stability—talent availability depends on institutional quality attracting/retaining migrants
Advocacy: Lobby for transparent, predictable immigration processes (reduce uncertainty) to attract talent—arbitrary visa denials deter high-value candidates
I. Political Economy & Policy Constraints
Immigration policy is shaped by political economy forces—voter preferences, concentrated losses vs. diffuse gains, policy uncertainty, and regulatory lag. Understanding these constraints helps firms navigate political risks and advocate effectively.
Median Voter Theorem
1. Median Voter Theorem
Core Idea: In democracies, policy converges to median voter preferences. Politicians compete for the median voter's support, so policies reflect middle-of-the-distribution preferences, not extremes or expert consensus.
Immigration Implication: Immigration policy often restrictive because median voter fears labour market competition (even if evidence shows minimal impact). Economic benefits (GDP growth, innovation, fiscal gains) don't sway median voter if perceived losses (jobs, wages) are salient.
Business Example: U.S. immigration debates (2010-2020): Economists broadly agree immigration has net-positive effects (innovation, growth, fiscal balance), but median voter opposition (driven by cultural/economic anxieties) blocks reform. Politicians follow median voter preferences, not expert recommendations. Result: H-1B caps unchanged despite labour shortages in tech/healthcare.
Strategic Application:
Political Risk Management: Don't assume economically optimal policies will prevail—median voter preferences dominate. Model political constraints (voter sentiment, election cycles) in workforce planning
Coalition Building: Build coalitions beyond business (include labour unions, immigrant groups, consumers) to shift median voter preferences—broad coalitions more effective than business-only lobbying
Concentrated Losses vs Diffuse Gains
2. Concentrated Losses vs. Diffuse Gains
Core Idea: Policies with concentrated losses (small group harmed significantly) and diffuse gains (large group benefits slightly) face organized opposition. Losers mobilize (high stakes per individual); winners don't (low stakes per individual). Result: inefficient policies persist.
Immigration Implication: Immigration creates diffuse gains (consumers benefit from lower prices, firms benefit from labour supply, economy benefits from innovation) but concentrated losses (workers in directly-competing occupations face wage pressure). Losers lobby; winners don't mobilize ? restrictive policies despite net-positive effects.
Business Example: U.S. H-1B visa debates (2015-2020): Tech firms (diffuse gains—thousands of companies benefit slightly from larger talent pools) faced opposition from incumbent tech workers (concentrated losses—perceived wage competition affects ~100K workers significantly). Workers mobilized (lobbying, media campaigns); firms struggled to counter-mobilize consumers/shareholders (gains too diffuse). Result: visa caps persisted.
Key Insight: To counter concentrated-losses dynamics, firms must: (1) organize collectively (industry associations to pool resources), (2) make gains concrete (quantify consumer savings, job creation in complementary roles, innovation metrics), (3) build unlikely coalitions (e.g., immigrant advocacy groups + business + consumers).
Policy Uncertainty
3. Policy Uncertainty (Regulatory Risk)
Core Idea: Policy uncertainty = unclear/volatile rules deter investment. Firms delay hiring, expansion, R&D when policy regime is unpredictable (risk of sunk costs if rules change).
Immigration Implication: Uncertain immigration policy (e.g., frequent H-1B rule changes, DACA termination threats) deters firms from hiring international talent—visa denials = sunk recruiting costs, project delays. Volatility = implicit tax on immigrant hiring.
Business Example: U.S. H-1B policy volatility (2017-2020): Trump administration increased denial rates (denial rates rose from 6% to 24% for initial applications), created uncertainty around renewals/extensions. Tech firms responded by shifting hiring to Canada (stable immigration policy) and delaying U.S. expansion. Policy uncertainty = strategic cost.
Strategic Application:
Geographic Diversification: Diversify operations across immigration regimes (U.S., Canada, EU, Singapore) to hedge policy uncertainty—if one jurisdiction tightens, shift hiring elsewhere
Scenario Planning: Model immigration policy scenarios (restrictive, status quo, expansive) and build contingency plans (automation investment, offshoring, alternative visa categories) to reduce exposure to policy shocks
Regulatory Lag
4. Regulatory Lag (Policy Trails Market Needs)
Core Idea: Regulations update slowly (political gridlock, bureaucratic inertia). Market conditions change faster than policy adapts, creating persistent mismatches—rules designed for old conditions applied to new realities.
Immigration Implication: Immigration quotas/categories set decades ago (e.g., U.S. H-1B cap set in 1990 at 65K, tech industry 10x larger today) don't reflect current labour demand. Regulatory lag = chronic skill shortages despite latent global talent supply.
Business Example: U.S. H-1B cap (65K annually, set 1990) unchanged despite tech sector growth from $500B (1990) to $5T+ (2020). Demand for H-1B visas exceeds supply 3-5x annually (lottery system). Regulatory lag ? talent shortages, wage inflation, slower innovation. Firms lobby for cap increases, but political gridlock prevents updates.
Strategic Application:
Long-Term Advocacy: Regulatory lag means policy change is slow—start advocacy early (5-10 year horizon), build sustained coalitions, invest in long-game lobbying
Workarounds: Don't wait for policy updates—develop workarounds (alternative visa categories like O-1 for "extraordinary ability," L-1 for intra-company transfers, remote work across borders)
Data-Driven Advocacy: Build case for policy updates with hard data (job vacancy rates, time-to-fill metrics, wage inflation, innovation slowdowns) to demonstrate regulatory lag's economic costs
46. Law of Time Value of Money: Why Timing Is Everything
Core Principle: A dollar today is worth more than a dollar tomorrow due to opportunity cost, inflation, and risk. Future cash flows must be discounted to present value.
Where: r = discount rate (cost of capital), t = time period
Decision Rule:
NPV > 0: Invest (returns exceed cost of capital)
NPV < 0: Reject (destroys value)
Comparing projects: Choose highest NPV when capital constrained
Business Applications
For Finance Teams: Use NPV for all major capital allocation decisions. Don't rely on payback period alone—it ignores time value and cash flows beyond payback. Discount rates should reflect risk (10% for stable businesses, 20-30% for startups).
For Product Teams: Invest in features with long-term compounding value (integrations, platform effects) even if short-term ROI is low. Technical debt has negative NPV—costs compound over time.
For Strategy Teams: Startups can outcompete incumbents by accepting lower NPV thresholds. Public companies require 15-20% IRR; startups can profit at 10% if they're patient. This arbitrage funds disruption.
Core Principle: Platform creates value by facilitating interactions between two distinct user groups (buyers-sellers, advertisers-users, drivers-riders). Must optimize pricing and features for both sides simultaneously. Imbalance kills platform—too many sellers without buyers = ghost town, too many buyers without sellers = poor experience.
Solution: Surge pricing. 2× fare = $20 ? $40. Effect: (1) Demand decreases (some riders decide not to travel or take alternative), (2) Supply increases (drivers attracted by high earnings). Within 15 minutes: wait times drop to 5 minutes, market clears. Both sides happier than with long waits.
Key Insight: Platform must balance both sides continuously. If pricing too low (favors riders), drivers leave, supply collapses. If too high (favors drivers), riders leave, demand collapses. Dynamic pricing (surge) maintains equilibrium. Critics call it "price gouging"—economists call it "market clearing price." Uber's innovation wasn't ridesharing—it was dynamic two-sided pricing.
Business Applications
For Platform Teams: Monitor both sides' engagement metrics separately. Airbnb: track host satisfaction (listings growth, earnings) AND guest satisfaction (booking conversion, reviews). If one side declining, diagnose why. Usually pricing imbalance: hosts want higher fees (more earnings), guests want lower fees (better value). Platform fee structure determines which side subsidizes the other. Airbnb takes ~14% from both sides—balanced extraction.
For Pricing Teams: Price asymmetrically to maximize total value. Credit cards: charge merchants 2-3% (inelastic demand—must accept cards), charge consumers $0 (elastic—will use cash if fees high). Subsidy from merchants funds rewards for consumers. Newspapers: charge advertisers high rates (value = reach), charge readers low rates (value = content). Subsidy from advertisers funds journalism. Two-sided pricing ? fair pricing. Charge each side what maximizes network effects.
For Growth Teams: Solve chicken-egg problem through subsidies. Uber: paid drivers guaranteed earnings (even without rides) in new cities. Ensured supply ready when riders arrived. Lyft tried opposite (recruit riders first, then drivers)—failed because riders saw long wait times, churned immediately. Rule: subsidize hard-to-acquire side, charge easy side. Usually harder to recruit supply (drivers, hosts, sellers) than demand (riders, guests, buyers).
Two-Sided Market Dynamics Pricing strategy: Subsidize price-sensitive side, charge value-capturing side. Google: free for users (generates content/data), charges advertisers (captures value) Liquidity challenge: Need critical mass on both sides simultaneously. eBay: seed marketplace with own inventory, then attract sellers Cross-side network effects: More drivers ? shorter wait times ? more riders ? higher driver earnings ? more drivers (virtuous cycle) Same-side effects: More sellers ? more competition ? lower prices ? worse for sellers. Must manage competitive intensity Platform governance: Set rules (rating systems, quality standards, dispute resolution) that benefit both sides
Core Principle: Platforms need both sides to have value, but neither side joins without the other. Riders won't use Uber without drivers. Drivers won't drive without riders. First-mover disadvantage in two-sided markets—early platforms must solve bootstrapping problem through subsidies, vertical integration, or sequential market building.
Problem: OpenTable launched 1999. Needed: (1) Restaurants using software for reservations, (2) Diners searching for tables. But restaurants won't pay for software without diners. Diners won't use platform without restaurants. Classic chicken-egg.
Solution (Vertical Integration): OpenTable sold reservation management software to restaurants ($1,200 upfront + $200/month). Software worked standalone—restaurants got value immediately (digital reservation book, table management). OpenTable built restaurant supply without needing diners. Then launched consumer-facing app: "Book tables at 5,000+ restaurants." Diners joined because supply already existed. Avoided chicken-egg by vertically integrating restaurant side (sold software) before platformizing (connected diners).
Result: 60,000 restaurants by 2020. $2.8B acquisition by Booking Holdings (2024). Key insight: solve chicken-egg by giving one side standalone value BEFORE connecting both sides.
Business Applications
For Marketplace Teams: Four strategies to solve chicken-egg: (1) Subsidize one side (Uber: guaranteed driver earnings), (2) Start with niche where density achievable (Airbnb: SXSW conference—small geography, high density), (3) Provide standalone value (OpenTable: software works without diners), (4) Fake the other side (Reddit: founders created fake users/content to appear active). Choose based on unit economics: subsidies work if LTV > CAC within 12 months.
For Growth Teams: Launch in dense geographies, not broad ones. Uber: launched San Francisco only (2010). Achieved 50% driver utilization (drivers busy half the time) ? high earnings ? more drivers ? shorter wait times ? more riders. Then expanded city-by-city. Competitor mistake: launch 20 cities simultaneously, achieve 10% utilization everywhere, drivers quit due to low earnings, platform dies. Density > breadth in early days.
For Product Teams: Build single-player mode before multiplayer. LinkedIn: profile creation useful even without network (resume, portfolio). As you add connections, value increases. But initial value = standalone. Pinterest: image bookmarking useful for single user (personal catalog). Sharing/following added later. Products with standalone value solve chicken-egg—users get value on day 1, network effects amplify over time.
Chicken-Egg Solution Playbook Marquee users: Recruit high-profile participants to attract others (Clubhouse invited celebrities, everyone else followed) Subsidies: Pay for one side's participation (Uber driver guarantees, YouTube creator fund) Geographic density: Dominate small area before expanding (Lyft: San Francisco ? Los Angeles ? NYC, not nationwide) Fake it: Simulate the other side until real users arrive (Reddit fake accounts, Yelp fake reviews—ethically questionable but effective) Vertical integration: Provide service yourself before platformizing (Amazon sold own products before opening marketplace)
Core Principle: When switching costs are low, users multihome (use multiple competing platforms simultaneously). Drivers work for Uber AND Lyft. Restaurants list on DoorDash AND Uber Eats. Reduces network effects' defensive value—platform can't lock in supply side. Winner-take-all less likely when multihoming prevalent.
Real-World Application: Food Delivery Wars
Case Study: Restaurant Multihoming
Food DeliveryMultihoming
Setup: Restaurant partners with DoorDash, Uber Eats, Grubhub simultaneously (2020-2024). Why? Zero switching cost—accepts orders from all platforms. Each platform brings incremental demand. Multihoming maximizes revenue.
Platform Impact: Platforms can't differentiate on supply (all have same restaurants). Must compete on: (1) Consumer side (delivery fees, speed, UX), (2) Commission rates (lower take rate attracts restaurants), (3) Consumer demand (restaurants prioritize platform with most orders). Result: commoditization, low margins. DoorDash, Uber Eats, Grubhub all unprofitable 2020-2023 despite billions in GMV. Multihoming prevents winner-take-all monopoly rents.
Key Insight: When supply multihomes, network effects weaken. Can't lock in restaurants because they're non-exclusive. Platforms must compete on price/service perpetually. Contrast with Airbnb: some hosts multihome (Airbnb + Vrbo), but many exclusive due to hassle of managing multiple calendars. Lower multihoming = stronger network effects.
Business Applications
For Platform Strategy: Reduce multihoming through exclusive incentives. Amazon: offer lower commission rates to sellers who list exclusively on Amazon (Brand Registry). DoorDash: guaranteed order volume for restaurants that remove competitors' tablets. Spotify: exclusive podcast deals (Joe Rogan, Gimlet Studios) prevent multihoming to Apple Podcasts. Exclusivity creates differentiation—users can't get same content elsewhere.
For Product Teams: Increase switching costs to reduce multihoming. Shopify: once merchant sets up store, store data, customer database, customizations locked into platform. Merchant COULD multihome (also sell on Amazon, eBay), but operational complexity high. Make platform the "system of record"—all data flows through you. Switching = losing data, breaking workflows.
For Sales Teams: Measure share-of-wallet, not just customer count. If restaurants multihome across 3 platforms, each platform gets ~33% of orders. Winner = platform with highest share-of-wallet (orders per restaurant). Optimize for "primary platform" status: (1) Lowest commissions (restaurants send high-volume orders), (2) Best support (dedicated account managers), (3) Marketing co-investment (drive consumer demand to increase restaurant GMV on your platform).
Managing Multihoming Dynamics High multihoming = weak defensibility: Food delivery, ridesharing (drivers multihome), classified ads (sellers post everywhere) Low multihoming = strong defensibility: Social networks (Facebook), professional networks (LinkedIn), communication (Slack vs. Teams) Reduce multihoming strategies: (1) Exclusive content/features, (2) Data lock-in, (3) Workflow integration, (4) Volume incentives, (5) Loyalty programs Accept multihoming strategies: Compete on price/quality, build consumer brand, increase consumer side lock-in (if supply multihomes, lock in demand)
Core Principle: Dominant platform expands into adjacent markets by bundling new functionality into existing platform. Leverages network effects and user base from core market to attack adjacent markets. Incumbents in adjacent market can't compete—new entrant has distribution advantage (100M users vs. 0).
Real-World Application: Microsoft Teams Envelops Slack
Case Study: Bundling Strategy
Enterprise SoftwareEnvelopment
Setup: Slack: 12M daily active users (2019), $900M revenue, fastest-growing SaaS company. Microsoft launches Teams (2017)—integrated into Office 365 (250M users). Bundled at no extra cost for Office subscribers.
Envelopment Mechanism: Microsoft didn't build "better" chat app. Built "good enough" + distribution advantage. Office 365 customers: "Should we pay Slack $15/user/month, or use Teams (free, already have it)?" 90% choose Teams. Slack's response: "Microsoft illegally bundling!" (true but irrelevant). Slack growth stagnated: 12M DAU (2019) ? 18M DAU (2024). Teams growth exploded: 20M DAU (2019) ? 320M DAU (2024).
Result: Salesforce acquired Slack $27B (2021)—defensive acquisition to prevent Microsoft from owning enterprise communication. Microsoft won through envelopment, not innovation. Bundling + distribution > better product in adjacent markets.
Business Applications
For Platform Teams: Identify adjacent markets you can envelop. Amazon: e-commerce ? cloud computing (AWS), video streaming (Prime Video), grocery (Whole Foods), pharmacy (PillPack). Each leverages Prime membership (120M users). Costs to launch new vertical: low (infrastructure exists, users already paying). Shopify: e-commerce platform ? payments (Shop Pay), shipping (Shopify Shipping), capital (Shopify Capital). Each adjacent to core—merchants already trust platform, adoption friction low.
For Competitive Strategy: Defend against envelopment through differentiation. Slack's mistake: competed on features (threading, search, integrations). Microsoft matched features, Slack lost. Should've competed on: (1) Ecosystem lock-in (proprietary apps, workflows), (2) Consumer brand (Slack = cool, Teams = corporate), (3) Best-of-breed positioning (specialist vs. generalist). Zoom defended against Microsoft by owning "video quality" narrative—enterprises chose Zoom even though Teams bundled video.
For Product Strategy: If you're incumbent being enveloped, pivot to differentiation. Can't compete on price (free bundle beats paid standalone). Can't compete on distribution (platform has 100M+ users). Must compete on: (1) 10× better UX, (2) Vertical-specific features, (3) Ecosystem lock-in. Spotify vs. Apple Music: Spotify differentiated through personalized playlists (Discover Weekly), podcasts (exclusive content), social features. Survived despite Apple bundling Apple Music free with devices.
Envelopment Attack Playbook Step 1: Identify adjacent market with significant overlap (your users also use that product) Step 2: Build "good enough" version (doesn't need to be best—just 70% as good) Step 3: Bundle at zero marginal price (free for existing customers) Step 4: Leverage distribution (promote to existing user base, integrate into core workflows) Defense: Build ecosystem lock-in BEFORE platform envelops you. By time they launch, users too invested to switch Examples: Google bundling Maps/YouTube/Gmail, Facebook bundling Instagram/Messenger/WhatsApp, Amazon bundling Prime Video/Music/Photos
Core Principle: Product quality improves as more users generate data. Unlike traditional network effects (value from connections), data network effects = value from learning. More users ? more data ? better algorithms ? better product ? attracts more users. Strongest moat in AI/ML era.
Real-World Application: Google Search Dominance
Case Study: Search Quality Through Data
Search EngineData Network Effects
Setup: Google (2000): 60% search market share, 100M searches/day. Competitor (Bing 2009): 5% share, 5M searches/day. Both use similar algorithms. Why can't Bing catch up?
Data Advantage: Google processes 20× more searches ? 20× more user click data ? learns which results users prefer 20× faster ? ranks results 20× better ? users click relevant results more ? generates more data. Self-reinforcing: small initial advantage (more users) compounds into insurmountable lead through data network effects. Bing's search quality: 2-3 years behind Google despite Microsoft's engineering talent. Not competence gap—data gap.
Result: Google: 92% search share (2024), $200B+ revenue. Bing: 3% share, subsidized by Microsoft as defensive measure. Data network effects create winner-take-all dynamics—quality gap widens over time, not narrows. Only regulation (antitrust) or paradigm shift (AI search) can dethrone incumbent.
Business Applications
For AI/ML Teams: Optimize for data collection speed in early stages. Tesla Full Self-Driving: 500,000 cars collecting 1B miles/month (2024). Competitor (Waymo): 10,000 cars collecting 10M miles/month. Tesla's data advantage: 100×. Even if Waymo's algorithms better today, Tesla's learning rate 100× faster ? will surpass Waymo within 1-2 years through data compounding. Early-stage AI companies: prioritize user acquisition (generates training data) over immediate monetization.
For Product Teams: Design products that generate proprietary data. Netflix: doesn't just stream videos—tracks what users watch, when they pause, rewind, abandon. 300M users generating billions of data points daily. Used to train recommendation algorithm (80% of views from recommendations, not search). Competitor launching streaming service: can license same content, can't replicate decade of user preference data. Data moat > content moat.
For Privacy Teams: Data network effects conflict with privacy regulations (GDPR, CCPA). Google's advantage partly from tracking users across web (search, Gmail, YouTube, Chrome, Android). Regulators limiting cross-product data sharing. Companies building data moats must do so within privacy constraints: (1) Collect first-party data only, (2) Get explicit user consent, (3) Provide value exchange (better personalization for data sharing). Privacy-preserving data collection = sustainable moat.
Building Data Network Effects Requirement: Product quality improves measurably with more data (ML models, personalization, search, recommendations) Competitive dynamic: Leader improves faster than followers (data gap widens over time) Examples: Google Search (query data), Netflix (viewing data), Spotify (listening data), Tesla (driving data), Amazon (purchase data), Waze (traffic data) Data types: (1) User behavior, (2) Preferences/ratings, (3) Sensor data (cameras, GPS), (4) Transaction history, (5) Social graph Flywheel: More users ? More data ? Better algorithms ? Better product ? More users (self-reinforcing)
Core Principle: Your negotiation power equals your Best Alternative To a Negotiated Agreement (BATNA). Strong BATNA = walk away easily, demand better terms. Weak BATNA = accept worse terms or lose deal. Negotiation outcome determined less by arguments, more by alternatives.
Negotiation Dynamics: Facebook's weak BATNA: tried competing, couldn't win. Instagram growing faster than Facebook among young users—existential threat. Facebook's BATNA value: -$5B (estimated future market share loss if Instagram becomes competitor). Instagram's strong BATNA: stay independent, worth $5B+ in 5 years (correct—worth $100B+ standalone by 2020). Result: Instagram negotiated up from $1B to $1B + retention bonuses + autonomy guarantees.
Key Insight: BATNA determines who has leverage. Facebook had urgency (competitive threat), Instagram had patience (growing fast, didn't need acquisition). Negotiation power = quality of alternatives, not quality of arguments.
Business Applications
For Negotiators: Improve your BATNA before negotiating. Fundraising: get multiple term sheets (competition improves terms). Enterprise sales: build relationships with multiple vendors (alternatives create leverage). Employment: interview at competitors before asking for raise (outside offers improve BATNA). Never enter negotiation with single option—creates desperation, destroys leverage.
For Dealmakers: Assess counterparty's BATNA. If they have strong alternatives, you must offer competitive terms. If weak alternatives (sole-source vendor, urgent timeline, no competitors), you can demand premium pricing. Salesforce selling to company with homegrown CRM (strong BATNA = keep building internally) must show ROI. Selling to company with outdated legacy CRM (weak BATNA = massive migration pain regardless of vendor) can charge premium.
For Procurement Teams: Create competition to improve BATNA. Multi-vendor RFPs generate competing bids (better pricing than sole-source). Even if preferred vendor known, soliciting alternatives creates pricing pressure. "We're considering Vendor A and Vendor B" changes negotiation dynamics from "will you buy?" to "how do we win against competitor?"—shifts power to buyer.
BATNA Optimization Framework Identify your BATNA: What's your best option if this deal fails? (stay independent, choose competitor, build in-house, walk away) Improve your BATNA: Create alternatives before negotiating (solicit competing offers, develop internal capabilities, extend runway) Assess their BATNA: Research counterparty's alternatives (are they desperate? do they have options? what's their timeline?) Worsen their BATNA: Make alternatives less attractive (exclusive partnerships, FUD about competitors, time pressure) Never reveal weak BATNA: If desperate, don't show it—act like you have strong alternatives even if you don't
Negotiation StrategyDeal LeverageM&A Strategy
Hold-Up Problem: Post-Investment Opportunism
Core Principle: After making relationship-specific investment (can't be redeployed), counterparty exploits your lock-in by demanding better terms. Classic example: build factory near customer's plant (specificity), customer renegotiates lower prices (hold-up). Solved through long-term contracts, vertical integration, or hostage exchanges.
Real-World Application: Supplier Relationships
Case Study: Auto Parts Supplier Vulnerability
ManufacturingHold-Up Problem
Setup: Parts supplier agrees to build custom components for auto manufacturer. Invests $50M in specialized equipment, molds, testing rigs. Equipment only works for this specific car model—can't repurpose for other customers.
Hold-Up: After supplier invests $50M (sunk cost), manufacturer says: "We're re-evaluating supplier contracts. Accept 20% price cut or we'll source elsewhere." Supplier's dilemma: accept cut (loses $10M/year margin) or refuse (loses $50M investment + all future revenue). Manufacturer exploiting specific investment—supplier locked in, has no alternatives. Classic hold-up problem.
Solutions: (1) Long-term contract BEFORE investment (5-year commitment, price protection). (2) Vertical integration (manufacturer owns supplier). (3) Hostage exchange (supplier also manufactures parts for manufacturer's competitor—mutual lock-in). Toyota pioneered "relational contracts"—long-term partnerships, invest in supplier success, avoid hold-up opportunism.
Business Applications
For Procurement Teams: Use hold-up leverage strategically but carefully. Short-term: exploiting supplier lock-in saves costs. Long-term: suppliers won't invest in innovation/capacity if fearing hold-up. Result: stagnant supply chain, quality declines. Smart approach: long-term contracts with performance incentives (share gains from innovation, don't extract all surplus through renegotiation). Costco's supplier model: consistent volume guarantees, fair pricing, suppliers invest in Costco-specific packaging/logistics knowing hold-up won't occur.
For Partnership Teams: Protect against hold-up through contract design. If making specific investment (custom integration, dedicated team, infrastructure), negotiate: (1) Minimum volume commitments (guarantees ROI), (2) Price escalation clauses (inflation protection), (3) Termination penalties (counterparty pays for stranded investment if canceling early). AWS enterprise contracts: 3-year commitments, minimum spend thresholds, protect AWS from hold-up after customer migrates all infrastructure.
For Strategy Teams: Vertical integration vs. outsourcing decision driven by hold-up risk. High relationship-specificity + uncertain demand = vertical integrate (avoid hold-up). Low specificity + certain demand = outsource (standard contracts work). Apple designs chips in-house (high specificity—custom ARM architecture) but outsources manufacturing to TSMC (standard fabrication, multiple customers, low hold-up risk). Tesla vertically integrated batteries (high specificity, critical to performance) but outsources seats (commodity, many suppliers).
Preventing Hold-Up Problems Long-term contracts: Lock in prices/terms BEFORE specific investment Vertical integration: Own both sides (eliminate counterparty opportunism) Hostage exchange: Mutual specific investments (both locked in, balanced power) Reputation effects: Repeated relationships (hold-up damages future deal flow) Contract clauses: Minimum volume commitments, termination penalties, price escalation protection Warning: Hold-up opportunism profitable short-term, destroys partnerships long-term
Incomplete Contracts: Not All Futures Can Be Written
Core Principle: Contracts can't specify actions for every possible future state (too complex, too expensive, some states unforeseen). Parties must govern relationship through trust, reputation, and renegotiation. Governance structure (joint venture, partnership, employment) determines how unspecified situations resolved.
Real-World Application: Joint Ventures
Case Study: Starbucks-PepsiCo Bottled Frappuccino JV
Unspecified States: What if customer wants low-calorie version? (Starbucks wants to protect brand, PepsiCo wants market share). What if Coca-Cola offers Starbucks better distribution deal? (PepsiCo wants exclusivity, Starbucks wants competition). What if almond milk becomes popular? (recipe change requires both parties' approval—who decides?). Contract can't predict all future product innovations, competitive dynamics, consumer preferences. Parties must renegotiate constantly.
Governance: Joint venture board (3 Starbucks directors, 3 PepsiCo directors) resolves disputes. Works because: (1) Repeated interaction (long-term partnership, reputation matters), (2) Mutual dependence (Starbucks needs PepsiCo's distribution, PepsiCo needs Starbucks' brand), (3) Symmetric information (both have full visibility into operations). JV governance structure handles incompleteness better than rigid contract.
Business Applications
For Legal Teams: Accept that contracts are inherently incomplete. Don't try to specify every contingency (infinite legal fees, still won't cover everything). Focus on: (1) Governing principles (how disputes resolved, who has decision rights), (2) Termination conditions (exit if relationship fails), (3) Renegotiation process (how often terms revisited, trigger events). Spotify's podcast creator contracts: specify revenue share, content ownership, but leave creative decisions to creators (too many edge cases to prespecify).
For Partnership Teams: Choose partners with aligned incentives and reputation for fairness. If contract incomplete (it always is), partner's behavior in unforeseen situations determines outcome. Partner with strong reputation (won't exploit gaps in contract) even if terms slightly worse. Example: AWS long-term contracts with startups—AWS could exploit pricing gaps (startup grows 100×, pricing locked at startup tier), but doesn't (reputation for supporting customers through growth). Reputation capital enables incomplete contracts to work.
For Strategy Teams: Governance structure choice = how to handle incompleteness. Market transaction (complete contract, arms-length). Strategic alliance (incomplete contract, joint governance). Merger (unified control, no contract needed). Choose based on: (1) Uncertainty (high uncertainty = incomplete contracts inevitable = alliance or merger), (2) Asset specificity (specific investments = need governance, not market), (3) Frequency (repeated interaction = reputation works, one-time = complete contract needed). Disney-Pixar started as incomplete contract (distribution deal), became merger when incompleteness too costly.
Managing Contract Incompleteness Accept incompleteness: Stop trying to specify everything (impossible and expensive) Governing principles: Define decision rights, dispute resolution, renegotiation triggers Partner selection: Choose partners with aligned incentives, reputation for fairness, long-term orientation Governance structure: Joint boards, advisory committees, escalation paths for unspecified situations Flexibility clauses: "Force majeure" (unforeseen events), "material change" (renegotiation triggers), "good faith" obligations Example clauses: "Parties agree to renegotiate in good faith if market conditions change by >30%"
Transaction Cost Economics: Firms Exist to Reduce Friction
Core Principle: Firms exist because market transactions have costs (search, negotiation, contracting, monitoring, enforcement). When transaction costs > coordination costs (managing internally), activity moves inside firm. Explains firm boundaries—why companies make vs. buy, when to vertically integrate, why hierarchies exist.
Real-World Application: Make vs. Buy Decisions
Case Study: Tesla's Vertical Integration
AutomotiveTransaction Costs
Setup: Traditional auto: outsource 70% of parts (engines, electronics, seats, glass). Coordinate via contracts with 1,000+ suppliers. Transaction costs: negotiate contracts, manage quality, coordinate delivery, resolve disputes. Tesla: vertically integrates 50% (batteries, software, motors, seats designed/manufactured in-house). Higher internal coordination costs (more employees, factories), but lower transaction costs (no supplier negotiations, faster iteration, IP control).
Trade-Off Analysis: Outsourcing transaction costs (auto industry): $2,000/vehicle (contracts, logistics, quality audits, warranty disputes). Tesla's internal coordination costs: $1,500/vehicle (employees, facilities, inventory). Tesla saves $500/vehicle through vertical integration. Plus strategic benefits: faster innovation (no supplier negotiation for design changes), IP protection (battery tech in-house), supply chain resilience (less dependent on suppliers).
Result: Tesla's integration strategy profitable when transaction costs high (complex, uncertain, rapidly evolving products like EVs). Traditional auto's outsourcing profitable when transaction costs low (stable, modular, commodity parts like seats, glass). Make vs. buy = minimize total costs (transaction + coordination).
Business Applications
For Procurement Teams: Calculate total cost of ownership including transaction costs. Outsourced software development: $100/hour (appears cheap) + management overhead (defining specs, communication, quality control, rework) = $200/hour all-in. In-house: $150/hour salary + benefits (appears expensive) + low coordination costs (colocated, aligned incentives, IP ownership) = $150/hour all-in. Choose based on total cost, not just price. High-complexity, high-uncertainty work (core product development) = bias toward make. Low-complexity, well-specified work (customer support, payroll) = bias toward buy.
For Strategy Teams: Firm boundaries determined by transaction cost vs. coordination cost trade-off. High transaction costs = vertically integrate (oil companies own refineries, drilling, pipelines). Low transaction costs = outsource (Nike owns brand/design, outsources manufacturing to contractors). Technology reducing transaction costs ? firms becoming smaller, more modular. APIs, cloud platforms, gig economy reduce costs of coordinating external parties. Uber doesn't employ drivers (transaction costs now low enough to coordinate via app). Traditional taxi companies employed drivers (transaction costs too high without technology).
For HR Teams: Employment vs. contracting decision driven by transaction costs. Full-time employee: high coordination costs (salary, benefits, management) but low transaction costs (no negotiation, aligned incentives, firm-specific knowledge). Contractor: low coordination costs (pay per project) but high transaction costs (search, negotiate, monitor quality, no firm loyalty). Use FTE for core, repeated, firm-specific work. Use contractors for peripheral, one-time, generic work. Google: engineers = FTE (firm-specific knowledge), facility management = contractors (generic, easy to specify).
Transaction Cost Framework (Ronald Coase / Oliver Williamson) Transaction costs include: (1) Search (finding partners), (2) Negotiation (contracting), (3) Monitoring (quality control), (4) Enforcement (disputes), (5) Coordination (logistics, communication) Coordination costs include: (1) Management overhead, (2) Bureaucracy, (3) Incentive misalignment, (4) Decision-making delays Make vs. Buy rule: Make if transaction costs > coordination costs. Buy if coordination costs > transaction costs Factors favoring "make": Asset specificity, uncertainty, frequency, complexity, IP sensitivity Factors favoring "buy": Standardization, low uncertainty, economies of scale in supplier market, non-core function
Make vs. BuyVertical IntegrationOrganizational Economics
Renegotiation Equilibrium: Deals Evolve Over Time
Core Principle: Long-term contracts inevitably renegotiate as circumstances change. Smart negotiators anticipate this—structure initial deal to maximize value in renegotiation equilibrium (final steady state after all renegotiations), not just initial terms. Matters most in relationships with switching costs, asset specificity, or repeated interaction.
Real-World Application: Sports Contracts
Case Study: NFL Player Contracts
SportsRenegotiation
Setup: Quarterback signs 5-year, $100M contract (2020). Years 1-2: performs well, becomes All-Pro. But salary locked at $20M/year while market rate for All-Pro QB now $40M (salary cap increased, other QBs got raises). Player threatens holdout—refuses to play unless contract renegotiated. Team's options: (1) Hold firm (lose QB for season, miss playoffs), (2) Renegotiate (increase salary to $35M/year, extend 3 more years).
Renegotiation Equilibrium: Original contract = irrelevant. Player's leverage = team invested millions in building roster around him (specific investment, can't quickly replace). Team's leverage = player's alternative (sit out, sacrifice earnings, damage reputation). Equilibrium: renegotiate to ~$35M (split surplus between player's threat point and team's). Initial contract just determined first 2 years—real value determined through renegotiation.
Key Insight: In any relationship with lock-in (team invested in player, player's skills team-specific), initial contract won't hold. Smart negotiators: structure initial deal to maximize total value creation (knowing you'll split surplus via renegotiation), not maximize initial extraction (triggers hostile renegotiation).
Business Applications
For Dealmakers: Design contracts for renegotiation-friendliness. Include: (1) Explicit renegotiation triggers ("if revenue exceeds $X, revisit pricing"), (2) Escalation clauses (automatic adjustments for inflation, market changes), (3) Performance bonuses (align incentives, reduce conflict in renegotiation). Salesforce enterprise contracts: annual "true-up" meetings where pricing adjusted based on actual usage (above/below forecast). Avoids hostile renegotiation by building flexibility into initial agreement.
For Partnership Teams: Choose long-term partners who will renegotiate fairly. Initial contract matters less than partner's renegotiation behavior. Would you rather have: (1) Amazing initial terms + partner who exploits you in renegotiation, or (2) Okay initial terms + partner who shares surplus fairly? Choose (2). Example: Spotify-record labels. Initial deals terrible for Spotify (70% revenue to labels). But Spotify maintained relationships, renegotiated over time as leverage shifted (Spotify now 30% of labels' revenue). Fair renegotiation preserved partnership.
For Executives: Model long-term deals based on renegotiation equilibrium, not initial terms. M&A earnouts: "We'll pay $50M upfront + $50M if revenue hits $100M in year 3." Sounds like $100M deal, but if revenue hits $90M, seller will renegotiate ("We were close, pay $40M extra"). Real expected price: $90M (initial + renegotiation). Budget for renegotiation in financial models—initial deal terms are opening bid, not final price.
Structuring for Renegotiation Accept inevitability: Long-term deals WILL renegotiate (circumstances change, information revealed) Build in flexibility: Escalation clauses, performance adjustments, periodic reviews Explicit triggers: Define conditions that trigger renegotiation (revenue thresholds, market changes, force majeure) Relationship capital: Invest in relationship quality—makes renegotiation collaborative, not adversarial Reputation effects: Renegotiate fairly (short-term extraction damages long-term deal flow) Examples: Talent contracts (sports, entertainment), supply agreements, licensing deals, JVs, franchises
Laws governing R&D investment, irreversible decisions, unknown unknowns, and option value
Real Options Theory: Delay Has Value
Core Principle: Under uncertainty, flexibility has value. Delaying irreversible decision = keeping options open = option value. Investment decisions should account for option value of waiting, not just NPV. Especially valuable when: (1) high uncertainty, (2) irreversible investment, (3) ability to wait reduces uncertainty.
Real-World Application: Pharmaceutical R&D
Case Study: Phase-Gated Drug Development
PharmaReal Options
Setup: Drug development: Phase 1 (safety, $10M), Phase 2 (efficacy, $50M), Phase 3 (large trial, $200M), FDA approval, commercialization ($500M manufacturing investment). Each phase reduces uncertainty about drug's viability. Traditional NPV: invest $760M upfront, expect $1B revenue ? NPV = $240M. But this ignores option to abandon after each phase.
Real Options Valuation: Phase 1 complete: if promising, proceed to Phase 2 (option value = potential $900M - $50M Phase 2 cost). If unpromising, abandon (save $750M on Phase 2+3+manufacturing). Phase 2 complete: if works, proceed to Phase 3 (option value = potential $700M - $200M). If fails, abandon. Each phase = option to continue OR abandon. Real options NPV: $450M (accounts for flexibility value). Higher than naive NPV because flexibility to abandon bad investments has value.
Key Insight: Phase-gated approach (staged investment with decision points) more valuable than all-at-once investment. Pharmaceutical companies maximize real option value through clinical trial structure—delay irreversible manufacturing investment until uncertainty resolved.
Business Applications
For R&D Teams: Structure innovation as portfolio of options. Early stage: make many small bets (seed funding, pilot projects). Later stage: double down on winners, kill losers. Google's "70-20-10" rule: 70% resources on core business, 20% on related innovations (options on adjacencies), 10% on moonshots (long-dated options on transformative tech). Options portfolio approach beats concentrated betting when uncertainty high.
For Finance Teams: Value flexibility explicitly. Expanding into new market: traditional NPV = -$20M (negative). But real options analysis: pilot launch ($2M) reveals demand, then decide whether to scale ($50M) or abandon. Option to abandon has value—true NPV = -$2M + option value ($15M) = $13M positive. Many "negative NPV" projects become valuable when accounting for flexibility/learning value.
For Strategy Teams: Timing decisions matter. Should you enter market now or wait? Now: capture first-mover advantage but commit resources under uncertainty. Wait: reduce uncertainty (observe competitors, test customer demand) but lose first-mover position. Real options framework: value of waiting = option value - foregone profits from delay. Amazon waited to enter smartphone market (2014, Fire Phone)—value of waiting (observe Apple/Samsung mistakes) exceeded first-mover advantage. Correct decision despite ultimate failure (learned smartphones = commodity, pivoted to Alexa instead).
When Delay Creates Value (Real Options Framework) High option value scenarios: (1) High uncertainty that will resolve over time, (2) Irreversible investment (can't recoup if wrong), (3) Delay doesn't kill opportunity, (4) Low cost of waiting Low option value scenarios: (1) Competitors moving fast (first-mover advantage), (2) Window closing (regulatory changes, market maturity), (3) High cost of delay (foregone profits) Real options in practice: Phase-gated R&D, pilot projects before scale, modular architecture (flexibility to swap components), lease vs. buy (operational flexibility), partnerships before acquisitions Valuation: NPV + option value of flexibility/learning/abandonment
Setup: Intel fab (chip factory): $20B investment, 3-year construction, 10-year depreciation, technology-specific (can't repurpose for different chip architectures). Highly irreversible—if demand doesn't materialize or technology becomes obsolete, $20B loss (equipment has near-zero salvage value).
Decision Threshold: Reversible decision (hiring engineer): invest if expected return >10% (can fire if doesn't work out). Irreversible decision (building fab): invest only if expected return >25% (compensates for irreversibility risk). Intel delays fab investments until: (1) Customer pre-orders secured (demand visibility), (2) Technology validated (Moore's Law trajectory confirmed), (3) Competitor capacity analyzed (no oversupply risk). Irreversibility raises investment bar from "probably profitable" to "highly confident."
Result: Intel's fab investment discipline (only build when demand certain) vs. competitors' overbuilding (build capacity speculatively) gave Intel profitability advantage. Competitors with stranded fabs (GlobalFoundries exited leading-edge manufacturing 2018—$10B+ in sunk fab investments) while Intel maintained 60%+ gross margins through disciplined irreversible CapEx.
Business Applications
For CapEx Decisions: Distinguish irreversible vs. reversible investments. Cloud infrastructure (AWS, Azure): reversible (shut down servers, stop paying monthly). On-premise data center: irreversible ($100M construction, 10-year depreciation). Bias toward reversible when uncertainty high. Netflix: runs entirely on AWS (no data centers)—maintains flexibility to scale up/down based on subscriber growth. Competitors (Comcast) built data centers (irreversible)—stranded assets when cord-cutting accelerated faster than expected.
For M&A Teams: Acquisitions are highly irreversible. Can't "undo" after integration (employees mixed, systems merged, customers migrated). Apply higher evidence threshold: extensive due diligence, pilot integrations (acqui-hires before full merger), performance-based earnouts (delays irreversible payment until results proven). Google's acquisition strategy: small bets ($10-50M acqui-hires, reversible) before large bets ($1B+ acquisitions). Allows learning before committing irreversibly.
For Product Teams: Design for reversibility when possible. Modular architecture: can swap components without redesigning entire system (reversible). Monolithic architecture: components tightly coupled (changes irreversible/expensive). API-first design: can change backend without breaking customer integrations (reversible). Hardcoded integrations: customer dependency locked in (irreversible). Netflix's microservices: each service independently deployable—reversible changes (roll back single service if issues). Monolith: all-or-nothing deploys (irreversible until next release cycle).
Core Principle: Risk = known probabilities (coin flip: 50% heads). Uncertainty = unknown probabilities (new market: ??? % success). Knightian uncertainty = can't even list possible outcomes (Black Swans). Standard decision tools (NPV, probability trees) fail under deep uncertainty. Requires different approach: scenario planning, robust strategies, antifragility.
Real-World Application: COVID-19 Business Impact
Case Study: Pandemic Response Strategies
CrisisKnightian Uncertainty
Setup: January 2020: COVID-19 emerging. Companies face Knightian uncertainty—can't estimate: (1) Severity (mortality rate unknown), (2) Duration (weeks? months? years?), (3) Policy response (lockdowns? travel bans? school closures?), (4) Economic impact (recession depth, recovery timeline). No probability distribution available—fundamentally unpredictable.
Response Strategies: Fragile companies (optimized for efficiency, zero slack): Cruise lines, airlines, malls, theaters—high fixed costs, low cash buffers. Collapsed when revenue ? $0. Robust companies (maintained slack, redundancy): Costco, Amazon, Zoom—cash reserves, flexible cost structures. Survived shock. Antifragile companies (benefited from chaos): Zoom (remote work surge), Peloton (home fitness), Instacart (grocery delivery). Grew 300-500% during crisis.
Key Insight: Under Knightian uncertainty, optimization = fragility. Can't predict specific shock, but can build resilience through: (1) Cash buffers (survive revenue loss), (2) Flexible costs (scale down quickly), (3) Optionality (multiple revenue streams), (4) Antifragile positioning (benefit from volatility). Companies prepared for "unknown unknowns" survived; those optimized for efficiency failed.
Business Applications
For Strategy Teams: Use scenario planning, not forecasts. Knightian uncertainty = can't forecast (probabilities unknown). Instead: imagine multiple futures (best case, worst case, surprising case), design strategy that works across scenarios. Shell pioneered scenario planning (1970s oil crisis)—didn't predict embargo, but prepared for "sudden supply disruption" scenario. When crisis hit, Shell outperformed because strategies pre-designed for that scenario existed.
For Finance Teams: Maintain strategic reserves for unknown unknowns. Standard finance: optimize working capital (minimize cash, maximize leverage). Under Knightian uncertainty: hold excess cash (2-3× normal), maintain undrawn credit lines (backstop liquidity), avoid excessive leverage (debt amplifies shocks). Berkshire Hathaway: $150B cash despite "negative" NPV of holding cash. Rationale: optionality to act when unpredictable opportunities arise (COVID crash, 2008 financial crisis).
For Risk Management: Focus on consequences, not probabilities. Can't estimate probability of unknown unknowns, but CAN estimate maximum tolerable loss. Question isn't "How likely is this?" (unknowable) but "Can we survive if this happens?" (knowable). Nassim Taleb's barbell strategy: 90% in safe assets (survive worst case), 10% in high-risk/high-reward (benefit from positive Black Swans). Middle ground (moderate risk) = vulnerable to unknown unknowns.
Strategies for Unknown Unknowns Scenario planning: Imagine multiple plausible futures, design robust strategies (work across scenarios) Redundancy: Excess capacity, backup suppliers, diversified revenue streams Optionality: Keep options open (don't commit irreversibly), maintain flexibility to pivot Antifragility: Position to benefit from volatility (Taleb's barbell: safe + speculative, avoid middle) Stress testing: Ask "What would kill us?" then ensure those scenarios survivable Examples: Cash reserves (liquidity buffer), supply chain diversity (geopolitical shocks), technology platform flexibility (can migrate if vendor fails)
Core Principle: Rare, high-impact events (outliers) drive disproportionate share of outcomes despite low probability. Normal distributions underestimate tail risk. Examples: 2008 financial crisis, 9/11, COVID-19, dotcom bust. Conventional risk management fails because it assumes "bell curve" world; reality has fat tails (outliers more common than expected).
Real-World Application: Venture Capital Returns
Case Study: Power Law Venture Returns
Venture CapitalBlack Swan
Setup: Typical VC fund: 30 investments, $100M total ($3.3M average). Outcome distribution: 20 companies fail (total loss = $66M), 8 companies return 1-3× ($24M), 1 company returns 10× ($33M), 1 company returns 100× ($330M). Total fund return: $387M on $100M = 3.87× (top-quartile performance).
Black Swan Dominance: Single investment (Facebook, Uber, Airbnb) = 85% of fund returns. 29 other investments = 15% of returns. Fund's success entirely determined by one "Black Swan" winner. Normal distribution thinking: "Diversify to reduce risk, avoid concentration." Power law reality: "Concentrate in potential Black Swans, accept high failure rate." Sequoia's $60M investment in WhatsApp ? $3B return (2014). One investment = 10 years of fund returns.
Key Insight: In fat-tailed domains (tech, media, pharma, entertainment), rare outliers dominate. Optimize for exposure to positive Black Swans (upside optionality), not average-case returns. Peter Thiel: "A great company is a conspiracy to change the world. You want 100× returns, not 2× returns distributed normally."
Business Applications
For Portfolio Strategy: Recognize power law domains vs. normal domains. Power law (Black Swan-driven): tech startups, drug development, oil exploration, movie studios, book publishing. Normal distribution (averages matter): manufacturing, retail, construction, utilities. In power law domains: make many small bets, kill losers fast, double down on winners. Netflix content strategy: green-light 100+ shows/year, cancel 60% after season 1, renew hits for 5+ seasons (Stranger Things, The Crown). Total viewing hours: 80% from top 10% of content (power law). Optimize for hits, tolerate many failures.
For Risk Management: Protect against negative Black Swans, seek exposure to positive ones. Taleb's asymmetry: negative Black Swans (2008 financial crisis) can destroy company. Positive Black Swans (viral product, M&A offer) create upside. Strategy: eliminate catastrophic downside risk (bankruptcy, existential threats) while maintaining upside optionality (experiments, R&D, partnerships). Insurance companies: buy reinsurance for catastrophic events (cap downside), don't hedge moderate losses (expensive, reduces profitability).
For Innovation Teams: Black Swan hunting through experimentation. Can't predict which experiment will 10× business, but can run many experiments cheaply. Amazon: launched 100+ products (Fire Phone, Dash Button, Local Services, Amazon Destinations—all failed). But also launched AWS, Prime Video, Alexa (each $10B+ business). Jeff Bezos: "If you double the number of experiments, you double your invention rate." Black Swan logic: high failure rate acceptable if one success > all failures.
Black Swan Strategy (Nassim Taleb Framework) Negative Black Swans (protect): Financial crisis, pandemic, cyberattack, regulatory change, key person risk. Use insurance, redundancy, scenario planning, stress tests Positive Black Swans (seek): Viral growth, M&A offer, breakthrough innovation, network effects tipping point. Use optionality, experiments, asymmetric bets (small investment, large potential upside) Fat-tailed domains: Tech (winner-take-all), pharma (blockbuster drugs), media (hits-driven), finance (tail risk) Normal domains: Manufacturing, retail, utilities (averages dominate, outliers rare) Strategy: In fat-tailed domains, optimize for Black Swan exposure, not normal returns
Venture StrategyTail RiskPortfolio Approach
Optionality: Upside > Downside
Core Principle: Optionality = asymmetric payoff (unlimited upside, limited downside). Convex to randomness—benefits from volatility/uncertainty. Seek situations where: (1) Small investment/commitment (capped downside), (2) Large potential payoff (unlimited upside), (3) Multiple paths to success (robust to uncertainty). Startup investing, R&D, partnerships, learning = high optionality.
Real-World Application: Tech Company Acquisitions
Case Study: Google's Acquisition Strategy
M&AOptionality
Setup: Google acquires 200+ companies (2001-2024). Most are small ($10-100M acqui-hires)—limited downside. Few become massive: YouTube ($1.65B ? $200B+ value), Android ($50M ? dominant mobile OS), DoubleClick ($3.1B ? advertising infrastructure), Waze ($1B ? maps data). Acquisition strategy = portfolio of options.
Optionality Payoff: Downside capped (small acquisitions, can shut down if don't work). Upside unlimited (YouTube alone worth 100× acquisition cost). Asymmetry: 90% of acquisitions contribute little, but 5% generate 1,000× returns. Google doesn't need to predict which acquisitions will succeed—makes many bets, lets winners emerge. Compare to Yahoo: acquired Tumblr $1.1B (2013), wrote down to $230M (2016), sold for $3M (2019). Symmetric bet (large downside, limited upside)—destroyed value.
Key Insight: High-optionality strategy: make many small asymmetric bets (downside capped, upside uncapped). Low-optionality strategy: make few large symmetric bets (equivalent upside/downside). Under uncertainty, optionality dominates forecasting—can't predict winners, but can structure bets to benefit from surprises.
Business Applications
For R&D Teams: Structure innovation as options portfolio. Early-stage R&D: invest small amounts ($50-500K) in many projects (20-50 simultaneously). Downside: lose $500K if project fails (capped). Upside: discover $1B product (uncapped). Kill projects fast when evidence negative (preserve capital for new options). Accelerate when evidence positive (exercise option by scaling investment). Pharma companies: 10,000 molecules in early research ? 100 in preclinical ? 10 in trials ? 1 approved drug. Portfolio of options, not single bet.
For Career Strategy: Build optionality through skills/network. Learning new skill (coding, design, sales): small time investment (100 hours), large potential payoff (new career paths, entrepreneurship opportunities, higher income). Building relationships: low cost (coffee meetings, conferences), high potential value (job offers, partnerships, referrals). Asymmetric: downside = few hours wasted, upside = life-changing opportunities. High-optionality careers (tech, finance, consulting) offer multiple exit paths. Low-optionality careers (academia, government) have limited pivots.
For Strategic Partnerships: Design partnerships as options, not commitments. Start with pilot (small investment, test feasibility). If works, expand to JV (medium investment, shared governance). If massive success, acquire (large investment, full control). Each stage = option to proceed or abandon. Amazon-Whole Foods: started with partnership (Amazon Lockers in stores), expanded to acquisition ($13.7B). Optionality approach: test before commit, scale when proven, avoid large early bets.
Optionality Maximization Framework High-optionality situations: (1) Asymmetric payoffs (small downside, large upside), (2) Multiple paths to success (robust to uncertainty), (3) Learning value (information gain even if fails), (4) Compounding benefits (early investment unlocks future options) Create optionality: Build skills (career flexibility), diversify revenue streams (business resilience), maintain cash reserves (financial options), create partnerships before acquisitions (test before commit) Optionality traps: (1) Too many options = decision paralysis, (2) Free options attract competition (arbitraged away), (3) Optionality valuable only if you CAN act (need resources to exercise options) Examples: Stock options (capped downside = premium, uncapped upside), startup equity (capped downside = time/salary, uncapped upside = IPO), learning (capped downside = time, uncapped upside = career opportunities)
Setup: Berkshire Hathaway maintains $100-150B cash (2015-2019 expansion). Market criticized: "negative NPV to hold cash, should deploy into assets." Warren Buffett: "We build cash during expansions to act during recessions. Cash = optionality when others forced sellers."
2020 COVID Crash: Market drops 35% (March 2020). Most companies cut spending, hoard cash, survive. Berkshire deploys $30B: buys back stock (cheap valuation), invests in distressed energy companies (Occidental Petroleum), provides liquidity to investment-grade companies desperate for cash. Returns: 50-100% as market recovers (2020-2021).
Key Insight: Business cycles create profit opportunities for prepared companies. Build cash cushion in expansion (when easy to raise capital), deploy counter-cyclically in recession (when assets cheap). Companies that survive recessions emerge stronger—acquire distressed competitors, hire top talent laid off elsewhere, lock in long-term contracts at depressed prices. Recessions = reset button that punishes fragile, rewards prepared.
Business Applications
For Finance Teams: Cycle-proof balance sheet. Expansion: pay down debt, build cash, avoid leverage (prepare for downturn). Recession: deploy cash counter-cyclically, acquire distressed assets, lock in low interest rates (long-term debt). Most companies do opposite—lever up in booms (overconfident), deleverage in recessions (forced by lenders). Smart companies: conservative in booms (when capital cheap but assets expensive), aggressive in recessions (when assets cheap but capital scarce).
For Operations Teams: Flexible cost structure. Fixed costs (real estate, permanent staff, equipment) = vulnerable to revenue declines. Variable costs (contractors, cloud infrastructure, outsourcing) = scales with revenue. In recession: revenue drops 30% ? fixed-cost company cuts 30% staff (morale damage, rehiring costs in recovery). Variable-cost company: costs automatically decline with revenue (no layoffs needed). Netflix: mostly variable costs (content licensing, cloud hosting)—scaled smoothly through 2008 recession while Blockbuster (fixed-cost retail) bankrupt.
For Strategy Teams: Counter-cyclical M&A. Expansions: high valuations, competitive bidding, expensive acquisitions. Recessions: low valuations, distressed sellers, negotiating leverage. Disney's playbook: bought Pixar ($7.4B, 2006 downturn), Marvel ($4B, 2009 recession), Lucasfilm ($4B, 2012 post-recession). All acquired at depressed valuations before recovery—created $100B+ value. Counter-cyclical acquisition strategy: wait for recessions, buy quality assets cheap, hold through recovery.
Second Case Study: Blackstone's Real Estate Counter-Cyclical Investing
Private EquityBusiness Cycles
Setup: Blackstone (world's largest real estate investor) follows disciplined counter-cyclical strategy: build cash during expansions (2005-2007: sold $30B properties near peak prices), deploy during recessions (2008-2010: bought $20B distressed properties at 40-60% discounts).
2008 Financial Crisis Execution: Commercial real estate prices drop 40% (peak to trough, 2007-2009). Most investors forced sellers (overleveraged, can't refinance debt). Blackstone deploys $15B buying: (1) Distressed office buildings NYC/SF (bought at $300/sq ft, worth $500/sq ft pre-crisis), (2) Hotel portfolios from bankrupt owners (Hilton acquisition, $26B leveraged buyout 2007, restructured in crisis), (3) Warehouses/logistics (bought before e-commerce boom).
Returns: Properties bought 2008-2010: average 25% IRR over 10 years (2008-2018 holding period). Comparison: properties bought at 2005-2007 peak: average 5% IRR (overpaid, hit by recession). Counter-cyclical timing drove 20% annual return differential = billions in outperformance. Key insight: same properties, different prices—cycle timing drives 80% of real estate returns. Blackstone's discipline: never deploy all capital in expansion (keep 40%+ dry powder for inevitable recession), never sell in panic during crash (patient capital advantage).
Business Cycle Strategy Framework Expansion (boom) strategy: Build cash reserves, pay down debt, avoid overextension, resist overconfidence, hire conservatively (talent expensive), plan for downturn Peak indicators: Record profit margins, low unemployment, aggressive valuations, easy capital, everyone optimistic (contrarian signal) Recession strategy: Deploy cash counter-cyclically, acquire distressed assets, hire top talent (laid off elsewhere), lock in long-term contracts (suppliers desperate), invest in R&D (competitors cutting) Trough indicators: Bankruptcies rising, unemployment high, pessimism universal, capital scarce (opportunity signal) Key insight: Be greedy when others fearful, fearful when others greedy (Warren Buffett)
Setup: Argentina: 100% annual inflation (2023). Costs double every year. Nominal revenues grow 100% (inflation-driven), but real revenues flat (no unit growth). Traditional accounting: massive profit growth (revenues up 100%). Reality: zero real growth, margin compression (input costs rise faster than prices).
Mercado Libre's Strategy: (1) Real-time pricing: adjust prices daily based on inflation, competitors, FX rates (algorithm-driven dynamic pricing). (2) Dollar-denominated contracts: negotiate supplier contracts in USD, not pesos (stable costs). (3) Fast inventory turnover: 30-day inventory cycle—buy inventory, sell before inflation erodes value. (4) Financial services: lending in inflation-indexed units (don't lose purchasing power on receivables). Result: maintained 50%+ gross margins despite hyperinflation (competitors with annual pricing cycles saw margins collapse).
Key Insight: Inflation = hidden tax on slow-moving companies. Fast movers (daily pricing, rapid inventory turns, inflation-indexed contracts) maintain margins. Slow movers (annual pricing, long inventory cycles, fixed contracts) see purchasing power eroded. Inflation penalizes operational sluggishness.
Business Applications
For Pricing Teams: Inflation requires dynamic pricing. Low inflation (2-3%): annual price increases sufficient. High inflation (>5%): need quarterly or real-time pricing adjustments. Subscription businesses (SaaS, streaming): build price escalators into contracts (CPI + 2% annual increases). Otherwise: locked into below-inflation pricing (revenue growth < cost growth = margin compression). Salesforce: contracts include 7-10% annual price increases—exceeds inflation, drives real revenue growth.
For Procurement Teams: Lock in long-term contracts in high-inflation environments. Inflation rising: secure 3-5 year fixed-price contracts (lock today's prices, benefit as inflation drives competitors' costs up). Inflation falling: negotiate short-term contracts (benefit from price declines). Airlines during 2020-2021: locked in fuel contracts when oil $40/barrel. Oil rose to $120/barrel (2022)—airlines with long-term contracts saved $1B+, competitors paid spot rates (margin destruction).
For Finance Teams: Inflation's balance sheet impact. Assets: cash loses purchasing power (hold minimal cash in high inflation), fixed assets appreciate (real estate, equipment worth more in nominal terms). Liabilities: fixed-rate debt becomes cheaper (paying back with devalued currency). Strategy in high inflation: minimize cash, maximize real assets (inventory, property, equipment), use fixed-rate debt (inflation erodes real debt burden). Turkey's tech companies (50% inflation): borrow in Turkish lira (fixed rate), invest in USD-denominated assets—debt effectively forgiven by inflation.
Second Case Study: Turkish Retailers During Lira Crisis (2021-2024)
BIM's Fast-Turn Strategy: (1) 7-day inventory cycle (vs. industry 30-day average)—buy inventory, sell within week before lira depreciates further. (2) Daily price updates (algorithm adjusts prices overnight based on FX rates, competitor pricing). (3) Dollar-linked supplier contracts (pay suppliers in TL equivalent of USD, protects from further devaluation). (4) Limited SKUs (800 items vs. CarrefourSA's 30,000)—easier to manage rapid price changes. Result: BIM maintained 10% gross margins despite 80% inflation. Sales volumes actually increased 15% (consumers shift from premium grocers to discount during inflation).
CarrefourSA's Slow-Turn Problem: (1) 45-day inventory cycle (hypermarkets hold more variety, longer shelf life). (2) Weekly pricing (too slow for 80% inflation—items bought Week 1 sold Week 6 at prices set Week 1 = margin destruction). (3) TL-denominated contracts (suppliers raising prices weekly, CarrefourSA can't pass through fast enough). Result: CarrefourSA gross margins collapsed from 22% (2020) to 12% (2023). Lost $100M+ to operational lag vs. inflation. Eventually sold Turkey operations to BIM-backed investor group (2024).
Key Insight: Hyperinflation = speed advantage. Fast inventory turns + dynamic pricing = survival. Slow turns + sticky pricing = margin destruction. BIM's $12B market cap (2024) vs. CarrefourSA exit shows: operational agility in high-inflation environments = competitive advantage. Companies that can reprice daily, turn inventory weekly win. Companies locked into monthly cycles lose.
Core Principle: Interest rates = cost of capital. Low rates: cheap to borrow, NPV of long-term projects positive, asset valuations high (low discount rate), companies invest/expand. High rates: expensive to borrow, NPV negative, asset valuations compressed, companies cut spending. Central banks use rates to stimulate (cut rates) or cool (raise rates) economy. Companies must adjust CapEx, M&A, hiring based on rate environment.
Impact on Companies: Homebuilders (Toll Brothers, Lennar): revenues drop 40% as buyers priced out. Zillow: transaction volumes down 50% (fewer home sales = less advertising). Home Depot: renovation spending collapses (cash-out refinancing impossible at 7% rates). Rate transmission mechanism: Fed raises rates ? borrowing expensive ? demand destruction ? revenue decline across housing ecosystem.
Key Insight: Interest rate changes = 6-12 month lag before economic impact. When Fed signals rate hikes, adjust strategy immediately (don't wait for impact). Cut discretionary spending, delay CapEx, build cash buffer. When Fed signals cuts, prepare to invest aggressively (competitors slow, you accelerate).
Business Applications
For CapEx Planning: Interest rates change NPV calculations. Project NPV = future cash flows discounted at cost of capital. 2020 (rates 0%): 10-year project with 5% IRR = positive NPV (0% discount rate). 2023 (rates 5%): same project = negative NPV (5% discount rate). Many "profitable" projects at low rates become unprofitable when rates rise. Reassess CapEx pipeline quarterly—kill marginal projects when rates rise, accelerate when rates fall.
For M&A Teams: Acquisition valuations compress when rates rise. Leveraged buyout: 60% debt, 40% equity. 2020 (rates 2%): debt service = $2M/year on $100M debt. Can pay 15× EBITDA (cheap debt subsidizes high multiples). 2023 (rates 7%): debt service = $7M/year. Can only pay 8× EBITDA (expensive debt reduces affordable multiples). Private equity deal volume dropped 60% (2022-2023) as rising rates made LBOs uneconomic. Strategy: acquire aggressively in low-rate environments (debt cheap), sell in high-rate environments (equity multiples compressed, debt expensive).
For Treasury Teams: Duration management matters. Debt with fixed rates: lock in low rates before Fed hikes (5-10 year maturities). Debt with floating rates: use when expecting rate cuts (benefit from declining rates). Apple (2013): issued $17B in bonds at 2.4% (30-year). Today: competitors borrow at 6%+. Apple saves $400M/year in interest (locked in low rates). Duration strategy: extend in low-rate environments, shorten in high-rate environments.
Interest Rate Strategy Framework Low-rate environment (0-2%): Accelerate CapEx (cheap financing), pursue M&A (leverage works), issue long-term debt (lock in low rates), invest in growth (NPV positive for more projects), hire aggressively Rising-rate environment (2-5%+): Delay CapEx (wait for rates to stabilize), pause M&A (valuations compressing), pay down variable-rate debt, build cash (rates rising = cash yield increases), cut discretionary spending High-rate environment (5%+): Minimize debt, prioritize cash generation, high ROI projects only, optimize working capital (cash has opportunity cost), prepare for recession (rates kill demand) Falling-rate environment: Invest aggressively (NPV improving), refinance expensive debt, acquire distressed assets (others struggling with debt service)
Capital AllocationInterest Rate StrategyDebt Management
Core Principle: Exchange rate fluctuations affect revenues, costs, and competitiveness. Strong home currency: exports expensive (revenue pressure), imports cheap (cost reduction). Weak home currency: exports competitive (revenue boost), imports expensive (cost pressure). Companies with global operations must hedge FX risk, price strategically across markets, and locate production to minimize currency exposure.
Setup: Apple: 60% revenues outside US, costs mostly in USD (R&D, suppliers paid in dollars). 2022: Dollar strengthens 15% vs. Euro, 20% vs. Yen, 10% vs. Yuan. Impact: European customer pays €1,000 for iPhone (same local price). At 2021 rates: €1,000 = $1,100 revenue. At 2022 rates: €1,000 = $950 revenue. Apple loses $150/phone on currency translation (14% revenue decline) despite selling same unit at same local price.
Apple's Response: (1) Raise prices in international markets (iPhone prices up 10-15% in Europe, Japan). Some demand loss, but margin protection. (2) FX hedging: forward contracts lock in exchange rates 6-12 months ahead (reduces volatility). (3) Local sourcing: shift component purchases to Euro/Yen suppliers (natural hedge—costs decline when revenue declines). Result: mitigated 50% of FX impact, but still -$5B revenue headwind (Q4 2022).
Key Insight: Large currency swings (>10%) can erase entire profit margins. Companies with global revenues + concentrated costs = extreme FX exposure. Mitigation: (1) Price dynamically by market (pass through FX moves), (2) Hedge tactically (forward contracts, options), (3) Natural hedges (local sourcing, production in customer markets).
Business Applications
For International Pricing: Adjust prices by currency zone. Strong home currency: raise international prices (offset revenue translation loss). Weak home currency: hold prices (gain competitiveness). Netflix: prices in USD in US, but local currency pricing (€, £, ¥) internationally. Adjusts prices quarterly based on FX moves—2022 (strong dollar): raised European prices 15%, maintained margins despite FX headwinds. Fixed USD pricing across all markets = margin volatility from FX swings.
For Manufacturing Strategy: Locate production near customer markets (natural hedge). Export model (produce in home market, sell globally): FX exposure high. Local production model (produce where you sell): FX exposure low. BMW: manufactures in Germany (costs in Euros), sells 40% in US (revenues in Dollars). When Euro strong: BMW cars expensive in US, margins compressed. Tesla: manufactures in US, China, Germany (localized production). FX neutral—produce in Euros, sell in Euros (natural hedge). Manufacturing location = FX risk management tool.
For Treasury Teams: FX hedging strategies. Transaction exposure (short-term receivables/payables): hedge with forward contracts (lock in rate for 3-6 months). Translation exposure (consolidated financial statements): selective hedging (expensive, only for large exposures). Economic exposure (long-term competitiveness): natural hedges (local production, pricing flexibility). Airbus (2000s): costs in Euros, revenues 70% in Dollars. Hedged 100% of Dollar exposure 12-18 months forward—protected margins when Euro strengthened vs. Dollar.
Currency Risk Management Framework Transaction risk (short-term): Forward contracts, currency options, netting (offset receivables/payables), invoicing in home currency Translation risk (accounting): Selective hedging (material exposures only), natural hedges (borrow in foreign currency), accept volatility (disclose to investors) Economic risk (long-term): Local production (manufacture where you sell), global sourcing (diverse supplier base), dynamic pricing (adjust prices by market), flexible operations (shift production locations) Example: US exporter facing strong Dollar ? costs stable (USD), revenues down (foreign currency translation) ? raise international prices 10%, hedge 50% of FX exposure, shift production to Mexico (natural hedge)
FX Risk ManagementGlobal PricingInternational Strategy
Fiscal & Monetary Policy: Government Actions Shape Markets
Setup: March 2020: COVID lockdowns, unemployment spikes to 14%, GDP drops 30% (Q2 2020). Government response: $5 trillion fiscal stimulus (direct payments, PPP loans, enhanced unemployment), Fed cuts rates to 0% + $4 trillion quantitative easing. Largest peacetime stimulus in history.
Business Impact: (1) Consumer demand surge: stimulus checks ? retail sales up 20% (2020-2021) despite recession. Target, Walmart, Amazon: record revenues. (2) Asset price inflation: low rates + money printing ? stock market up 100% (2020-2021), housing up 30%, crypto boom. Wealth effect drives luxury spending (LVMH, Tesla benefit). (3) Labor market tightness: enhanced unemployment ($600/week federal supplement) reduces labor supply, wages up 15% (2021-2022), margin pressure for labor-intensive businesses (restaurants, retail).
Key Insight: Massive stimulus creates winners (consumer discretionary, assets, tech) and losers (labor-intensive businesses facing wage pressure). Companies that recognized stimulus = demand surge (Amazon, Walmart) invested heavily in capacity (warehouses, hiring). Companies that missed it (traditional retail) lost market share. Policy shifts = opportunity for prepared companies.
Business Applications
For Strategy Teams: Monitor policy signals from central banks and governments. Fed "dot plot" (interest rate projections): signals rate path 2 years ahead. ECB forward guidance: commits to rate policy conditional on inflation. Fiscal policy: infrastructure bills, tax reforms, subsidies. Incorporate policy expectations into strategy. 2021: infrastructure bill passes ($1T). Companies exposed (Caterpillar, construction materials, engineering firms) invest in capacity ahead of demand surge. 2022-2023: policy tightens (rates up, stimulus ends). Companies cut costs, delay CapEx, prepare for demand slowdown.
For Sector-Specific Opportunities: Policy changes create sector rotation. Green energy subsidies (IRA 2022): $369B for solar, wind, EVs. Tesla, solar companies, battery manufacturers benefit directly. Defense spending increases: contractors (Lockheed, Raytheon) gain. Tax cuts for corporations: buybacks, M&A increase (private equity benefits). Anticipate policy-driven demand shifts—reposition before competitors react. First Solar: stock up 300% (2022-2023) on IRA subsidies (converted marginal business into highly profitable).
For Risk Management: Policy risk = major uncertainty for international operations. China's regulatory crackdowns (2021): education sector banned from profits ($100B destroyed), tech antitrust fines ($50B), gaming restrictions. Companies operating in China faced sudden policy risk. Mitigation: diversify geography (don't concentrate in single regulatory jurisdiction), scenario plan for policy changes (what if government nationalizes sector?), maintain flexibility (avoid irreversible commitments in high-policy-risk markets).
Policy Impact Framework Expansionary policy (stimulus): Fiscal (spending up, taxes down) + Monetary (rates down, QE) ? Demand surge, asset inflation, labor shortages, currency weakness. Strategy: invest in capacity, hire ahead of demand, lock in debt (rates low) Contractionary policy (austerity): Fiscal (spending down, taxes up) + Monetary (rates up, QT) ? Demand decline, asset deflation, unemployment rises, currency strength. Strategy: build cash, cut costs, delay CapEx, prepare for recession Sector-specific policies: Subsidies (IRA green energy, CHIPS Act semiconductors), tariffs (trade wars), regulations (antitrust, data privacy). Strategy: lobby for favorable policy, diversify away from hostile jurisdictions, frontrun policy changes Policy tracking: Fed meetings, central bank guidance, legislative calendars, regulatory proposals
Category O: Regulation, Institutions & Political Economy
Laws governing regulatory dynamics, public goods, externalities, antitrust, and institutional quality
Regulatory Capture: Regulators Align with Industry
Core Principle: Regulators often become captured by the industries they regulate. Mechanisms: (1) Revolving door (regulators join industry post-government), (2) Information asymmetry (industry has expertise, regulators rely on industry data), (3) Lobbying/campaign finance. Captured regulation favors incumbents (protects existing players from competition), raises barriers to entry, stifles innovation. Companies can benefit from (or be harmed by) regulatory capture depending on market position.
Uber Disruption (2011): Uber enters NYC as "black car service" (different regulatory category, not medallion-constrained). TLC initially allows (Uber = niche market, not direct competitor to yellow cabs). By 2015: Uber has 20,000 cars (vs. 13,000 medallions), medallion prices collapse to $200K (2018). Medallion owners sue, lobby for regulation. TLC responds: caps Uber vehicles (2018), imposes minimum wage (2019)—attempts to protect incumbents (too late).
Key Insight: Regulatory capture protects incumbents until technology enables circumvention. Medallion system worked for 80 years (regulators captured by taxi lobby). Uber bypassed regulation through legal arbitrage (different category). Incumbents use captured regulators to fight back (caps, wage laws), but can't reverse disruption. Startups: find regulatory gaps, exploit before incumbents mobilize regulators.
Business Applications
For Incumbents: Use regulatory capture defensively. Lobby for barriers to entry: licensing requirements (hair braiding needs 1,000 hours training in some states—protects salons from competition), safety regulations (require expensive testing that only large companies can afford), data privacy rules (GDPR compliance costs $1M+—hurts startups, minimal impact on Google/Facebook). Pharmaceutical companies: extend patents through regulatory filings (biologics get 12-year exclusivity), lobby FDA for stricter approval (raises costs for generic manufacturers). Regulatory capture = moat for incumbents.
For Startups: Identify captured regulations to disrupt. Heavily regulated industries (taxis, hotels, healthcare, finance, education) = likely captured (incumbents control regulators). Look for "arbitrage" opportunities: Airbnb avoided hotel regulations (peer-to-peer not covered), Uber avoided taxi regulations (black car service), Robinhood avoided broker minimums (tech platform not traditional brokerage). Move fast before incumbents lobby for new regulations covering your category.
For Policy Teams: Invest in regulatory relationships. Lobbying spend ROI: avg $220 return per $1 lobbied (study: pharmaceutical companies). Google, Amazon, Meta: $50M+/year lobbying budgets. Regulatory access = influence on rules. Hire ex-regulators (revolving door works both ways—FCC commissioners join telecom companies, FDA officials join pharma). Build coalitions (trade associations amplify influence). Amazon's HQ2 strategy: located in Washington DC suburbs—proximity to regulators = regulatory influence.
Second Case Study: Telecom Industry and Net Neutrality Regulations
TelecommunicationsRegulatory Capture
Setup: Net neutrality debate (2005-2020): Should ISPs treat all internet traffic equally (net neutrality) or charge content providers for faster delivery (paid prioritization)? Consumer advocates want neutrality (prevent Comcast blocking Netflix). ISPs (Comcast, AT&T, Verizon) want paid prioritization (new revenue stream—charge Netflix $1B/year for fast lanes).
Regulatory Capture Mechanisms: (1) Revolving door: 5 FCC chairmen (2000-2020)—4 joined telecom/cable lobby after government service. Tom Wheeler (FCC chair 2013-2017): former telecom lobbyist before appointment. (2) Lobbying spend: ISPs spend $80M/year lobbying FCC, Congress. (3) Campaign finance: Telecom industry $50M+ political donations annually. (4) Information asymmetry: FCC relies on ISP-provided data about network costs, congestion (ISPs claim neutrality harms investment—data shows opposite).
Outcome: 2015: FCC (Democratic majority) passes net neutrality rules. 2017: FCC (Republican majority, new chairman = former Verizon lawyer) repeals neutrality. 2024: Still no permanent rules—ping-pongs with administration changes. ISPs successfully captured regulatory process—prevent permanent consumer-friendly rules despite 80%+ public support for net neutrality. Regulatory uncertainty benefits ISPs (can threaten paid prioritization, extract payments from content providers even without formal rules).
Navigating Regulatory Capture Signs of capture: Industry-favorable rules, high barriers to entry, complexity (benefits large players with compliance teams), revolving door between regulators and industry Incumbent strategy: Lobby for strict licensing, safety standards, data requirements (raise costs for entrants), support "consumer protection" that actually protects incumbents Disruptor strategy: Find regulatory arbitrage (operate in unregulated category), move fast (before rules change), build customer base (harder to ban once popular), lobby for "innovation-friendly" rules Examples: Taxi medallions (capture until Uber), occupational licensing (barbers, interior designers), certificate of need (hospitals block competitors), telecom spectrum (favors AT&T/Verizon)
Regulatory StrategyLobbyingCompetitive Barriers
Public Goods Problem: Markets Under-Provide
Core Principle: Public goods = non-excludable (can't prevent non-payers from using) + non-rival (one person's use doesn't reduce others'). Examples: national defense, clean air, basic research, open-source software. Private markets under-provide public goods (free-rider problem—everyone wants to use, no one wants to pay). Government intervention (taxes, subsidies, direct provision) or collective action (industry consortia, open-source communities) needed.
Real-World Application: Pharmaceutical R&D for Rare Diseases
Case Study: Orphan Drug Act
PharmaPublic Goods
Setup: Rare diseases (<200,000 patients in US): limited market, high R&D costs. Private sector won't invest—$500M to develop drug for 10,000 patients = uneconomic (can't recoup costs). Public good problem: society benefits from curing rare diseases, but no private company will fund research (free-rider: "Let someone else develop it, we'll copy once approved").
Government Intervention: Orphan Drug Act (1983): provides (1) 7-year market exclusivity (extended patent protection), (2) Tax credits for R&D (50% of costs), (3) Fast-track FDA approval. Makes rare disease drugs profitable—converts public good (under-provided by market) into private good (excludable via exclusivity, profitable via subsidies). Result: orphan drug approvals up 10× (pre-1983: 10 total drugs, post-1983: 600+ drugs). Government corrected market failure.
Key Insight: Public goods need government intervention OR alternative funding models. Basic research (NIH grants $45B/year—funds university science that companies won't). Open-source software (Linux, Apache—volunteer labor + corporate sponsorship). Industry consortia (SEMATECH—semiconductor R&D shared across competitors). When private incentives misaligned (public good problem), look for policy-driven solutions or collective funding.
Business Applications
For R&D Teams: Distinguish private goods (excludable, rival) from public goods (non-excludable, non-rival). Private goods: patent protection, trade secrets (can capture returns, fund privately). Public goods: basic science, platform standards, infrastructure (can't exclude competitors, need alternative funding). Strategy: lobby for government R&D subsidies (DARPA funded internet, GPS, touchscreens—public goods that enabled private industry), join industry consortia (share costs of pre-competitive research), contribute to open source strategically (build ecosystem that benefits your products).
For Policy Teams: Advocate for public funding of foundational research. Tech industry: benefits from government-funded computer science (NSF, DARPA). Pharma: benefits from NIH basic research ($45B/year funds university labs that discover drug targets). Clean energy: benefits from DOE subsidies. ROI on lobbying for R&D funding: 100× (taxpayers fund research, companies commercialize discoveries). Tesla: $465M DOE loan (2009) funded Model S development—public investment de-risked private innovation.
For Sustainability Teams: Public goods problem = tragedy of the commons. Clean air, oceans, climate stability = public goods (non-excludable, non-rival). Individual companies won't reduce pollution voluntarily (costs money, benefits everyone including competitors). Requires regulation (carbon taxes, emission caps) or collective action (industry agreements). Companies can benefit from advocating for smart regulation—levels playing field, prevents race-to-bottom on environmental standards. Auto industry: supported California emissions standards (avoided 50-state patchwork of regulations).
Public Goods Strategy Framework Public goods characteristics: Non-excludable (can't charge users) + Non-rival (infinite supply) = private markets under-provide Solutions: (1) Government provision (taxes fund public goods: R&D grants, infrastructure), (2) Subsidies (tax credits, prizes for private provision), (3) Regulation (mandates, standards), (4) Collective action (industry consortia, open-source communities) Business strategy: Lobby for government funding (basic research, infrastructure), join industry consortia (share pre-competitive costs), contribute to open-source (build ecosystem), support smart regulation (level playing field on public goods like environment) Examples: NIH funds drug discovery (public), companies commercialize (private). Internet protocols (public via open standards), AWS/Azure (private services built on public protocols)
Core Principle: Externality = cost/benefit imposed on third parties not involved in transaction. Negative externalities (pollution, congestion, noise): private costs < social costs ? market over-produces. Positive externalities (education, vaccination, R&D): private benefits < social benefits ? market under-produces. Regulation (taxes, subsidies, caps) internalizes externalities, aligning private incentives with social optimum.
Real-World Application: Carbon Emissions and Climate Change
Case Study: EU Emissions Trading System
ClimateExternalities
Setup: Carbon emissions = negative externality. Coal plant burns coal, produces electricity (private benefit), emits CO2 (social cost: climate change, health impacts). Private cost: $50/MWh (coal, plant operation). Social cost: $50 + $30/ton CO2 × 0.8 tons/MWh = $74/MWh. Market failure: plant produces too much (private cost < social cost), society bears excess cost ($24/MWh).
EU ETS Solution (2005): Cap-and-trade system. (1) Government sets emissions cap (1.8 billion tons/year, declining 2% annually). (2) Companies buy permits to emit (1 permit = 1 ton CO2). (3) Permits traded on market (current price: €80/ton). Internalizes externality: coal plant now pays $50 fuel + €64 carbon ($80 × 0.8 tons) = $114/MWh total cost. Natural gas (0.4 tons/MWh): $70 fuel + €32 carbon = $102/MWh. Renewables (0 tons): $90/MWh + €0 = $90/MWh. Carbon price makes renewables cheapest—market shifts from coal ? gas ? renewables. Externality internalized via pricing.
Result: EU emissions down 30% (2005-2023). Coal generation down 60%, renewables up 300%. Carbon pricing = $100B+/year revenue (used to subsidize green tech). Market-based solution to externality problem—avoided command-and-control regulation, used price signals to drive decarbonization.
Business Applications
For Sustainability Teams: Anticipate externality regulation. Negative externalities (carbon, pollution, waste): government will eventually tax or cap (internalize costs). Companies that move early (invest in clean tech before mandates) gain competitive advantage when regulation arrives. Tesla: invested in EVs pre-carbon-pricing—when subsidies/regulations arrived (California ZEV mandate, federal tax credits), Tesla positioned to benefit. Incumbents (GM, Ford) caught flat-footed, scrambling to build EV capacity.
For Risk Management: Price externalities into decisions even before regulation. Stranded asset risk: coal plants built assuming no carbon tax. When carbon pricing arrives, plants become uneconomic (operating costs > revenue). Utilities that assumed zero carbon cost: $100B+ in stranded assets (retired plants early). Utilities that modeled $50/ton CO2 in planning: avoided building coal, invested in gas/renewables, no stranded assets. Shadow carbon pricing (internal carbon tax) = insurance against future regulation.
For Corporate Strategy: Positive externalities = investment opportunities. R&D creates positive externalities (innovations spill over to competitors, society). Government subsidizes R&D (tax credits, grants) to increase private investment. Companies can capture subsidies: R&D tax credits (US: 20% of R&D spending), innovation grants (ARPA-E for energy, SBIR for small business). Amazon: claimed $1B+ in R&D tax credits (2020)—reduced taxes while increasing innovation spending. Leverage subsidies to fund innovation that has positive externalities.
Second Case Study: Tobacco Industry Negative Externalities
Public HealthExternalities
Setup: Cigarette smoking creates massive negative externality: smokers pay $8/pack private cost, but impose $35/pack social cost (healthcare: lung cancer, heart disease, COPD treatment costs; lost productivity: sick days, premature death; secondhand smoke: non-smoker health impacts). Market failure: private companies profit ($8 revenue/pack) while society bears costs ($35 medical/productivity losses).
Regulatory Solution: Excise taxes internalize externality. Federal tax: $1.01/pack, state taxes: $0.50-$4.50/pack (avg $1.91). Total tax: ~$3/pack ? raises private cost closer to social cost. Result: smoking rates down 67% (1965: 42% adults, 2020: 14%). Tax revenue: $12.5B federal + $18B state = funds healthcare, anti-smoking programs. Market-based solution (tax = price signal) changed behavior more effectively than bans.
Third Case Study: Tariff Externalities - Trade Diversion and Consumer Costs (2018-2020)
Trade PolicyNegative Externalities
Setup: Tariffs create negative externalities—costs spill over to parties not involved in policy decision. Trump administration imposed tariffs on Chinese imports ($370B goods, 2018-2020) to protect domestic manufacturing. Private beneficiaries: US steel producers, some manufacturing jobs. But tariffs imposed costs on: (1) consumers (higher prices), (2) downstream industries (manufacturers using imported inputs), (3) exporters (retaliation), (4) trading partners (supply chain disruption). Classic externality: policy makers focused on visible benefits (jobs saved) while ignoring dispersed costs (higher prices, job losses elsewhere).
Economic theory prediction: Tariff incidence depends on elasticity. If Chinese goods have inelastic demand (few substitutes), Chinese exporters absorb costs by lowering prices. If elastic demand (many substitutes), US consumers/importers pay via higher prices.
Actual data (2018-2020 studies): US consumers/importers paid ~95% of tariff costs. Chinese export prices fell only 5%. Why? Substitution from Vietnam/Mexico limited Chinese pricing power, but switching costs kept US demand inelastic short-term ? tariff passed through as higher US prices.
Example: 25% tariff on $100 Chinese good ? US price rose to $125 (consumer paid $25 tariff), Chinese price fell to $95 (absorbed $5) ? tariff = tax on Americans, not Chinese
Trade Diversion vs Trade Creation:
Trade creation: Tariffs intended to boost US domestic production (create new US jobs/output). Limited success: manufacturing employment +8,700 steel jobs but -75,000 downstream jobs = net -66,300 jobs
Trade diversion: Companies avoided tariffs by sourcing from third countries instead of US. Vietnam exports to US: +$40B (2018-2020), Mexico: +$25B. Didn't create US jobs—just shifted supply chains. Net effect: global inefficiency (Vietnam less efficient than China at some goods ? higher costs)
Data: 40% of lost Chinese imports diverted to other countries, only 10% replaced by US production, 50% = permanent trade loss (demand destroyed by higher prices)
Losers: Consumers (-$120B higher prices), downstream manufacturers (-$35B costs, -75,000 jobs), exporters (-$27B lost sales from retaliation)
Net welfare loss: $7.2B/year deadweight loss (costs exceeded benefits). Opportunity cost: $900K per steel job saved (could retrain workers for $50K ? massive inefficiency)
Comparison to free trade: Tariffs created inefficiency—resources allocated to higher-cost US steel production instead of comparative advantage sectors (tech, services, aerospace). Both countries worse off than free trade baseline.
Externality Analysis: Tariffs = policy with highly concentrated benefits (visible jobs in protected industries) but diffuse costs (invisible price increases spread across millions of consumers, job losses in downstream industries). Political incentive: policymakers respond to concentrated interests (steel lobby) while ignoring dispersed externalities (consumer harm). Economic remedy: internalize externalities via full cost-benefit analysis (account for all affected parties), compensate losers (trade adjustment assistance for displaced workers), or avoid protectionism (free trade = no deadweight loss).
Key Insight: Tariffs impose negative externalities—third parties (consumers, manufacturers, exporters, trading partners) bear costs not reflected in policy decision. Tariff incidence: mostly fell on US consumers/businesses, not Chinese exporters. Trade diversion: shifted supply chains to third countries instead of creating US jobs. Deadweight loss: protectionism destroyed more value (consumer surplus, downstream jobs) than it created (protected jobs). Lesson: protectionist policies create externalities that exceed direct benefits ? free trade maximizes total welfare by avoiding these costs.
ExternalitiesTrade DiversionProtectionismDeadweight Loss
Business Applications
For Supply Chain Teams: Tariff policy creates externalities ? plan for trade diversion opportunities or risks. When tariffs imposed on competitors' sourcing countries, shift production to unaffected regions (Vietnam, Mexico benefited from US-China trade war). Diversify supplier base across multiple countries to mitigate tariff risk. Monitor geopolitical risks—protectionism rising globally (Brexit, US-China decoupling) ? build resilient supply chains with redundancy.
For Risk Management: Internalize externality risks in strategic planning. Tariff uncertainty = negative externality (policy volatility ? delayed investment). Model scenarios: baseline (current tariffs), upside (tariff reduction), downside (escalation). Shadow tariff pricing: incorporate potential future tariffs into pricing models (insurance against policy shocks). Hedging strategies: multi-country sourcing, contract clauses (tariff cost-sharing with suppliers/customers), financial hedges (currency forwards if tariffs drive exchange rate moves).
Internalizing the Externality: 1998 Tobacco Master Settlement Agreement: 46 US states sue tobacco companies for healthcare costs ($200B+ spent treating smoking-related illnesses). Settlement: tobacco companies pay $206B over 25 years. Effectively a retroactive externality tax—forces companies to pay for social costs they previously externalized. Additionally, cigarette taxes raised: federal $1/pack, state average $2/pack (some states $4-5/pack). Total taxes now ~$3-5/pack (partially internalizes health externality).
Market Impact: Cigarette prices: $2/pack (pre-1998) ? $8+/pack (post-settlement + taxes). Consumption drops: 24% of adults smoked (1998) ? 11% (2024). Tax revenue: $25B/year (federal + state). Public health benefit: 8 million premature deaths avoided (1998-2024) from reduced smoking rates. Economic lesson: when externalities internalized through taxes/lawsuits, market outcomes align with social optimum (less smoking = fewer health costs). Tobacco industry fought internalization for decades (denied health risks, lobbied against taxes)—but eventually lost as evidence overwhelmed denial.
Externality Management Framework Negative externalities: Pollution, congestion, noise, health risks. Solutions: Pigovian taxes (carbon tax, congestion pricing), cap-and-trade (emissions permits), regulation (emission standards, bans). Strategy: invest early in clean tech (pre-empt regulation), use shadow pricing (internal carbon tax), lobby for market-based solutions (cap-and-trade > command-and-control) Positive externalities: R&D, education, network effects. Solutions: Subsidies (R&D tax credits, education grants), public provision (NSF, NIH). Strategy: capture subsidies (R&D credits, innovation grants), invest in workforce development (positive externality = skilled labor pool) ESG integration: Internalize externalities into decision-making before regulation forces it (avoid stranded assets, build green competitive advantage)
Carbon StrategyESG ManagementExternality Pricing
Antitrust Economics: Market Power Attracts Scrutiny
Real-World Application: Google Search Antitrust Case
Case Study: DOJ vs. Google (2020-Present)
Big TechAntitrust
Setup: Google: 90% global search market share, 95% mobile search. DOJ lawsuit (2020): alleges monopolization through exclusionary agreements. (1) Pays Apple $15B/year to be default search on iPhone (blocks competitors from distribution). (2) Pays Samsung, Mozilla $5B+/year for default status. (3) Bundles search with Android (OEMs must pre-install Google Search to get Play Store). Allegations: maintains monopoly through distribution control, not superior product.
Google's Defense: (1) Consumers choose Google because it's best (quality, not coercion). (2) Default can be changed (users can switch to Bing, DuckDuckGo—don't, proving Google superior). (3) Payments to Apple/Samsung = competitive bidding (Microsoft could outbid if Bing better). (4) Android bundling = efficient distribution (consumers benefit from integrated experience). Traditional antitrust: focus on consumer harm (higher prices). Google: prices = $0 (free search), consumers benefit from better quality.
Potential Remedies: (1) Ban exclusive agreements (Apple must offer choice screen for search). (2) Unbundle Android (separate Search from Play Store). (3) Structural breakup (spin off Chrome, Android). (4) Behavioral remedies (data sharing with competitors). Trial ongoing (2024)—outcome will reshape big tech antitrust doctrine.
Business Applications
For Dominant Platforms: Market power = antitrust target. 90%+ market share (Google Search, Microsoft Windows, Amazon e-commerce): expect regulatory scrutiny. Mitigation strategies: (1) Avoid exclusionary conduct (don't block competitors from distribution), (2) Don't abuse dominance (tie products, exclusive dealing, predatory pricing), (3) Invest in compliance (competition law training, legal review of product decisions), (4) Document pro-competitive justifications (efficiency gains, consumer benefits). Microsoft learned from 1990s antitrust (browser bundling)—now structures Windows to allow browser choice, avoids exclusionary tactics.
For M&A Strategy: Horizontal mergers (competitors combining) = high antitrust risk. HHI thresholds (market concentration index): <1,500 = safe, 1,500-2,500 = scrutiny, >2,500 = likely blocked. Meta-Within (VR fitness app, 2022): FTC sued to block (small deal, $400M, but high market shares in nascent market—prevented). Remedy: pursue vertical mergers (supplier + customer), conglomerate mergers (unrelated businesses)—lower antitrust risk than horizontal consolidation. Amazon-MGM ($8.5B, 2022): approved (vertical: distribution + content, not horizontal).
For Competitive Strategy: Use antitrust offensively. If dominant competitor abuses market power, file complaint (EU, DOJ). Spotify vs. Apple: complaint about App Store 30% fee + restrictions on Spotify in-app (forced through Apple payment system). EU: fined Apple €1.8B, ordered changes to App Store rules (2024). Antitrust = competitive tool for challengers against dominant platforms. Smaller players: document anti-competitive conduct, build coalition (multiple complainants stronger than one), lobby regulators.
Second Case Study: Microsoft Antitrust (1998-2001)
SoftwareAntitrust
Setup: 1998 DOJ sues Microsoft: 95% desktop OS market share (Windows). Allegation: bundled Internet Explorer (IE) with Windows to kill Netscape Navigator (65% browser share 1995). Tying = illegal under antitrust law when dominant firm forces customers to buy Product B (browser) to get Product A (OS).
Anti-Competitive Conduct: (1) Technical integration: IE embedded into Windows (couldn't uninstall without breaking OS). (2) OEM agreements: PC manufacturers (Dell, HP, Compaq) contractually required to ship Windows PCs with IE as default browser, hide Netscape icon. (3) Exclusive deals: AOL, CompuServe paid to use IE exclusively (blocked Netscape distribution). Result: IE market share 25% (1997) ? 95% (2002). Netscape bankrupted, sold to AOL for $4.2B (down from $10B valuation).
Legal Outcome: 2000: Judge Jackson rules Microsoft violated Sherman Act (monopolization). Proposes breakup: split Windows OS from applications/IE. 2001: Appeals court overturns breakup, but upholds monopolization verdict. Settlement: Microsoft must (1) share APIs with competitors, (2) allow OEMs to install rival browsers, (3) submit to 5-year DOJ oversight. Fines: $750M+ (US), €2.2B (EU for separate violations).
Long-Term Impact: Microsoft learned "antitrust compliance culture." Missed mobile OS (Android/iOS won) partly because conservative on bundling/integration post-lawsuit. Meanwhile, Google built Chrome browser 65%+ market share (2024) using similar tactics (default browser deals with Apple, Samsung) without antitrust penalties—regulatory environment evolved. Case precedent: big tech now faces constant antitrust scrutiny. Microsoft's experience = cautionary tale for Facebook, Google, Amazon dominance strategies.
Antitrust Risk Management High-risk behaviors: (1) Tying (force customers to buy A to get B), (2) Exclusive dealing (block competitors from distribution), (3) Predatory pricing (below-cost pricing to drive out rivals), (4) Refusal to deal (deny competitors access to essential facilities), (5) Horizontal mergers (competitor consolidation in concentrated markets) Safe harbors: (1) Market share <40% (presumed not dominant), (2) Efficiency justifications (lower costs, better quality), (3) Consumer benefits (free products, innovation), (4) Competitive markets (easy entry, many rivals) Compliance: Antitrust training (sales, product, M&A teams), legal review (pricing, distribution agreements, product bundling), document pro-competitive rationale (efficiency, innovation, consumer benefit) Examples: Microsoft (browser bundling fined €1.7B), Google (shopping comparison fined €2.4B), Meta (attempted Within acquisition blocked)
Antitrust ComplianceMarket PowerRegulatory Risk
Rule of Law: Stable Institutions Enable Investment
Core Principle: Rule of law = predictable, enforced legal system (property rights, contract enforcement, judicial independence). Strong institutions: investors confident in legal protections ? long-term investment, innovation, growth. Weak institutions: expropriation risk, corruption, arbitrary enforcement ? capital flight, short-term extraction, stagnation. Institutional quality > natural resources in determining economic success (Norway vs. Nigeria oil wealth).
Setup: China tech sector: 2019-2020 boom (Alibaba, Tencent, Didi combined $2T market cap). November 2020: government blocks Ant Financial IPO (would have been largest ever, $37B). Signals regulatory shift. 2021: regulatory crackdown across tech—Alibaba fined $2.8B (antitrust), Didi banned from app stores (data security), online education sector banned from profits (policy shift eliminated $100B industry overnight), gaming companies limited to 3 hours/week for minors (Tencent revenue hit).
Investor Impact: Chinese tech stocks drop 50-80% (2021-2022). $1.5 trillion market cap destroyed. Foreign investment flees (uncertainty about what's legal, what government will ban next). Rule of law concern: (1) Unpredictable enforcement (Alibaba fined, Tencent/Baidu not—why?), (2) Retroactive policy changes (education companies legal ? illegal overnight), (3) No judicial recourse (government decisions final, courts not independent). Weak institutional predictability ? capital flight, companies delist from US (variable interest entities deemed illegal risk), entrepreneurs pivot from consumer tech (risky) to government-aligned sectors (defense, chips).
Key Insight: Institutional predictability = foundation for long-term investment. Strong rule of law (US, EU): investors plan decades ahead (pharmaceutical 10-year R&D cycles viable). Weak rule of law (arbitrary enforcement, retroactive changes): investors demand high returns to compensate risk, avoid long-duration projects (too much policy uncertainty). Institutional quality drives capital allocation more than GDP growth or market size.
Business Applications
For International Expansion: Assess institutional quality, not just market size. Factors: (1) Property rights (can you own assets? expropriation risk?), (2) Contract enforcement (courts independent? legal system effective?), (3) Regulatory predictability (rules stable? retroactive changes?), (4) Corruption (bribes required? transparent procurement?). World Bank Doing Business rankings, Transparency International Corruption Index = proxies for institutional quality. High-risk institutions (Venezuela, Zimbabwe): avoid long-term capital deployment (government may nationalize). Medium-risk (India, Brazil): joint ventures with local partners (share political risk). Low-risk (Singapore, Switzerland): full ownership, long-term investment.
For Risk Management: Political risk insurance for weak-rule-of-law markets. OPIC, MIGA, private insurers: cover expropriation, currency inconvertibility, political violence. Cost: 1-3% of investment value annually. Chevron in Venezuela: government nationalized $30B in assets (2007). No insurance, total loss. ExxonMobil: had political risk insurance, recovered $1.6B (2014 arbitration award). Weak institutions = insure against downside, cap exposure, maintain exit optionality.
For ESG Strategy: Institutional strength correlates with long-term returns. Countries with strong rule of law (transparent regulation, low corruption, independent judiciary) generate higher risk-adjusted returns (20-year horizon). ESG investing: prioritize institutional quality metrics (governance scores, corruption rankings, regulatory stability). Norway's sovereign wealth fund ($1.4T): excludes countries with weak rule of law (too risky), focuses on OECD markets with strong institutions. Rule of law = leading indicator of sustainable investment returns.
Institutional Quality Framework Strong rule of law indicators: Independent judiciary, consistent enforcement, property rights protected, low corruption, transparent regulation, long government planning horizons Weak rule of law indicators: Political interference in courts, selective enforcement, expropriation risk, corruption, retroactive rule changes, short-term policy volatility Investment strategy: Strong institutions ? long-term capital deployment (R&D, CapEx, brand building). Weak institutions ? short-term extraction (minimize fixed assets, repatriate profits frequently, political risk insurance) Examples: Strong (Singapore, Switzerland, Denmark—attract long-term FDI), Weak (Venezuela, Zimbabwe—capital flight, brain drain), Improving (Vietnam, Poland—FDI surge as institutions strengthen)
Political RiskInstitutional QualityInternational Strategy
Category P: Labour Markets, Immigration & Human Capital Economics
Labour markets are central to business strategy—from talent acquisition and compensation to workforce planning and geographic expansion. Immigration policy directly affects labour supply, skill availability, wage dynamics, and innovation capacity. These economic principles explain how labour mobility shapes productivity, growth, fiscal balance, and competitive advantage across industries and regions.
Why Labour Economics Matters for Business
Understanding labour market dynamics helps executives:
Predict wage pressures and talent shortages in different skill categories
Design compensation strategies that attract and retain critical talent
Leverage immigration policies to access global talent pools
Assess productivity impacts of workforce composition changes
Navigate political economy constraints around hiring and offshoring
Executive Decision Framework: Integrating All 83 Economic Laws
Economic laws are most powerful when synthesized across all 15 categories. The best executives spot patterns where multiple laws converge (powerful signals), recognize trade-offs when laws conflict (judgment calls), and adapt frameworks to context. Here's a structured approach to integrating economic thinking into strategic decisions.
Comprehensive Decision Checklist (15 Categories)
Executive Toolkit
Before Major Strategic Decisions, Synthesize Across All Categories:
When Laws Converge ? Act Decisively (iPhone Example)
2007 Decision: Should Apple Launch iPhone or Wait?
Real Options Analysis (M): Delay has value when uncertainty high. Smartphone market uncertainty resolving (BlackBerry proving market exists, 10M+ users). Option value of waiting declining.
Cannibalization Principle (J): Music phone convergence inevitable—iPhone will cannibalize iPod ($8B revenue, 50% margin). But if Apple doesn't, Nokia/Motorola will. Self-cannibalization necessary.
Network Effects (C/K): App Store platform potential (developers + users two-sided market). First-mover builds network effects moat before Android.
Synthesis: All four laws point same direction: (1) Uncertainty resolving (real options: delay ending), (2) Disruption arriving (technology S-curve transition), (3) Cannibalization inevitable (innovator's dilemma: do it yourself), (4) Network effects race (first-mover advantage in platforms). Convergence signal = move boldly.
Result: iPhone launched June 2007. $1.5T market cap added (2007-2024). Steve Jobs synthesized across laws—didn't analyze each in isolation, but spotted pattern where all pointed to "act now decisively."
When Laws Conflict: Judgment Calls
Real Options vs. First-Mover Advantage: Real options theory says "delay has value" (M). First-mover advantage says "move early to build moat" (C). When do you wait vs. act? Resolution: assess uncertainty reduction rate. If uncertainty resolves quickly (6-12 months), delay (learn, then move). If uncertainty resolves slowly (5+ years), move now (don't cede market to competitors during long learning period). Google waited on smartphones (2014 Fire Phone after observing Apple/Samsung). Amazon waited on same-day delivery until drones/autonomous vehicles developed. Patience when learning fast, action when learning slow.
Economies of Scale vs. Disruptive Innovation: Scale economies favor large incumbent (E). Disruptive innovation favors nimble startup (J). Incumbent dilemma: protect profitable core (scale advantages) or invest in disruptive new technology (cannibalize self). Kodak chose scale (optimized film business for efficiency). Result: bankruptcy when digital disrupted. Netflix chose cannibalization (accelerated streaming despite DVD profits). Result: $280B market cap. Judgment call: when disruption credible threat (S-curve transition visible), choose disruption over scale. When disruption overhyped (blockchain in 2018), protect scale.
Short-Term Profitability vs. Network Effects Investment: Time value of money favors current cash flows (discounted at 10-15%). Network effects require upfront investment (burn cash to acquire users). When does growth > profitability? Resolution: calculate LTV:CAC ratio. If LTV (lifetime value) > 3× CAC (customer acquisition cost), invest aggressively in growth (each customer acquired = profitable). If LTV < 3× CAC, focus on profitability (unit economics broken, growth destroys value). Uber 2015-2019: LTV < 2× CAC in many markets—growth-at-all-costs strategy destroyed value. Meta 2004-2012: LTV > 10× CAC—aggressive growth investment created $1T company.
Economic Laws for Specific Teams
Different business functions must apply economic principles in function-specific ways. Here's how finance, marketing, and strategy teams should think about these laws:
For Finance Teams
Economic Law
Finance Application
Key Metrics
Time Value of Money
Capital allocation, investment decisions
NPV, IRR, Payback Period
Opportunity Cost
Budget trade-offs, resource allocation
ROI comparison, hurdle rates
Economies of Scale
Unit economics, fixed vs. variable costs
Gross margin, contribution margin
Competition
Pricing models, margin sustainability
EBITDA margin, competitive benchmarking
Diminishing Returns
Investment optimization, headcount planning
Marginal ROI, productivity metrics
For Marketing Teams
Economic Law
Marketing Application
Key Metrics
Demand & Supply
Demand generation, market sizing
TAM, SAM, SOM, demand curves
Price Elasticity
Pricing strategy, promotion planning
Price sensitivity analysis, A/B tests
Diminishing Returns
Channel optimization, ad spend allocation
CAC by channel, marginal CAC
Network Effects
Viral loops, referral programs
K-factor, viral coefficient, NPS
Incentives
Customer behavior design, gamification
Conversion rate, engagement metrics
For Strategy Teams
Economic Law
Strategy Application
Key Frameworks
Comparative Advantage
Build vs. buy, partnership decisions
Core competency matrix, make-or-buy analysis
Competition
Competitive positioning, moat building
Porter's Five Forces, moat analysis
Economies of Scale
Market share strategy, M&A targets
Scale curves, consolidation playbooks
Network Effects
Platform strategy, marketplace design
Two-sided markets, cold start solutions
Opportunity Cost
Strategic trade-offs, focus areas
Strategy canvas, prioritization matrix
Cross-Functional Collaboration
Best strategic decisions require input from all three functions:
Finance quantifies opportunity costs and NPV
Marketing estimates demand curves and elasticity
Strategy evaluates competitive dynamics and moats
Use economic laws as a common language across teams—reduces subjective debates, increases data-driven decision-making.
Conclusion: Economics as Competitive Advantage
The 10 economic laws covered in this guide aren't just academic theory—they're battle-tested frameworks used by the world's most successful companies to outmaneuver competitors, optimize resources, and create sustainable advantages.
Key Takeaways
Remember These Principles:
Demand & Supply determines pricing power—understand your elasticity before changing prices
Diminishing Returns means growth in inputs ? proportional growth in outputs—know when to stop scaling
Opportunity Cost is the hidden price of every decision—explicitly list what you're giving up
Price Elasticity varies by customer segment—charge premium to inelastic segments, volume pricing to elastic
Comparative Advantage means focus on what you do best—outsource the rest
Incentives drive behavior more than mission statements—align metrics with long-term value
Competition erodes profits without moats—build barriers that compound over time
Economies of Scale create cost advantages—but watch for diseconomies at extreme size
Network Effects are the ultimate moat—solve the cold start problem to unlock exponential growth
Time Value of Money favors patient capital—short-term thinking creates arbitrage for long-term thinkers
Practical Next Steps
For Executives:
Audit your current strategy through the lens of these 10 laws—identify gaps and vulnerabilities
Run quarterly strategy reviews using the Economic Decision Framework (see Executive Framework section)
Train your leadership team to speak the language of economic laws—creates alignment on trade-offs
For Teams:
Finance: Build NPV models for all major investments, track marginal ROI by initiative
Marketing: Run elasticity experiments quarterly, optimize CAC across channels with diminishing returns in mind
Ultimately, mastering economic laws is about developing a way of thinking—a mental framework that automatically considers trade-offs, incentives, and long-term consequences. The best business leaders don't just react to market conditions; they anticipate how economic forces will shape their industry and position their companies accordingly.
As Amazon's Jeff Bezos famously said: "We've had three big ideas at Amazon that we've stuck with for 18 years, and they're the reason we're successful: Put the customer first. Invent. And be patient." Those three ideas map directly to economic laws: customer obsession (demand), innovation (comparative advantage), and patience (time value of money).
The companies that win aren't always the ones with the best products—they're the ones that best understand and apply the fundamental laws of economics to their business strategy.