Physiology Mastery
Homeostasis & Feedback
Set points, feedback loops, allostasisNeurophysiology & Action Potentials
Neurons, action potentials, synapsesCardiac Electrophysiology & Hemodynamics
Heart rhythm, hemodynamics, cardiac outputRespiratory Mechanics & Gas Exchange
Breathing mechanics, gas exchange, V/QRenal Physiology & Fluid Balance
Nephron function, filtration, acid-baseGI Physiology & Absorption
Motility, secretion, nutrient absorptionEndocrine Regulation & Metabolism
Hormones, thyroid, adrenal, metabolismExercise Physiology & Adaptation
Acute responses, training adaptationsCellular & Membrane Physiology
Ion transport, signaling, second messengersBlood & Immune Physiology
Hematopoiesis, coagulation, immunityReproductive & Developmental
Reproduction, pregnancy, fetal physiologyIntegrative & Clinical Physiology
Stress, shock, sepsis, agingMechanics of Breathing
Breathing is something we do approximately 20,000 times per day without conscious thought, yet the mechanics underlying each breath are remarkably sophisticated. The respiratory system must move air in and out of the lungs (ventilation), exchange gases across an incredibly thin alveolar membrane (diffusion), and transport those gases to every cell in the body. This section examines the physics that makes it all possible.
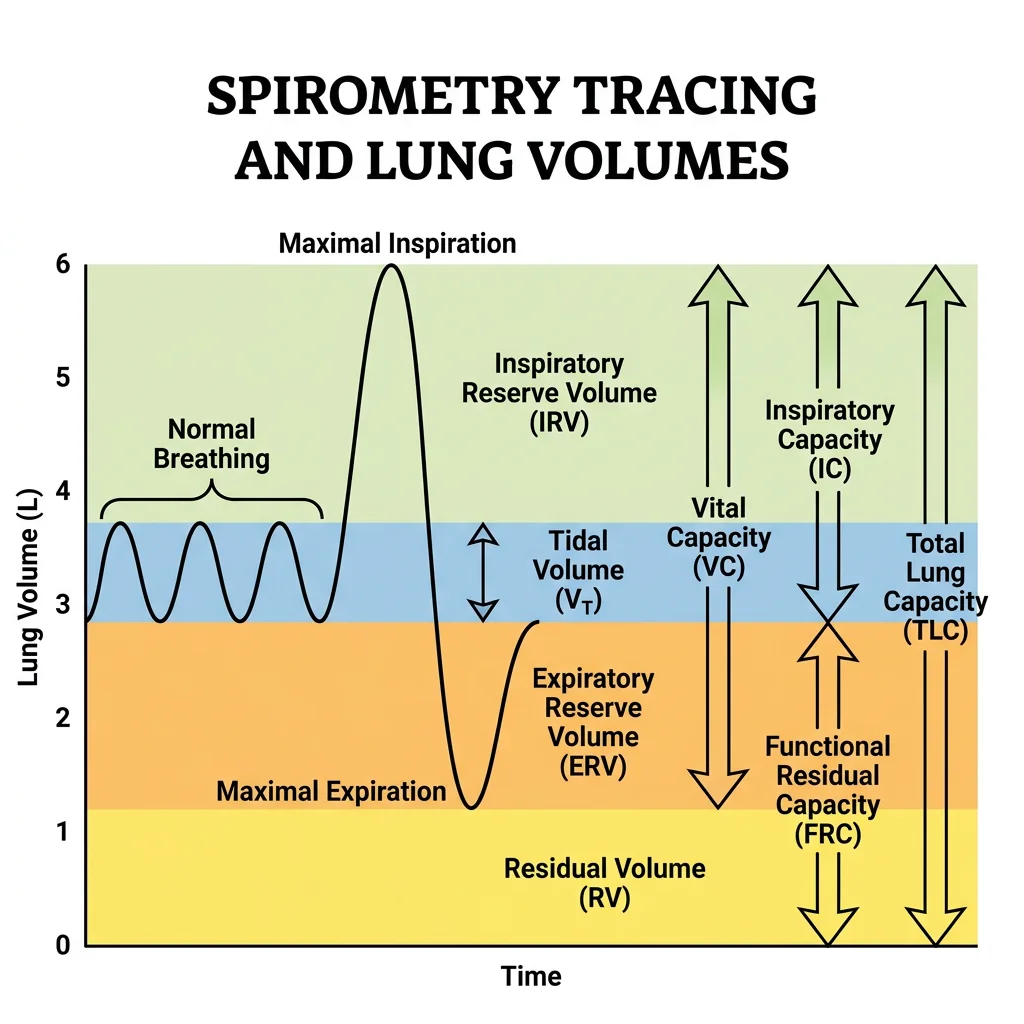
Lung Volumes & Capacities
Spirometry measures four primary volumes and four capacities (combinations of volumes). Understanding these is essential for diagnosing obstructive vs restrictive lung disease:
| Volume / Capacity | Definition | Normal Adult Value | Clinical Significance |
|---|---|---|---|
| Tidal Volume (TV) | Air moved in one normal breath | ~500 mL | Basis of minute ventilation calculation |
| Inspiratory Reserve (IRV) | Extra air inspired beyond TV | ~3,000 mL | Reserve for deep breaths |
| Expiratory Reserve (ERV) | Extra air expired beyond TV | ~1,200 mL | Reduced in obesity (abdominal compression) |
| Residual Volume (RV) | Air remaining after maximal expiration | ~1,200 mL | ↑ in obstructive disease (air trapping); cannot be measured by spirometry |
| Vital Capacity (VC) | TV + IRV + ERV | ~4,700 mL | ↓ in restrictive disease (fibrosis, chest wall restriction) |
| Total Lung Capacity (TLC) | VC + RV | ~5,900 mL | ↑ in emphysema (hyperinflation); ↓ in fibrosis |
| Functional Residual Capacity (FRC) | ERV + RV | ~2,400 mL | The equilibrium volume where elastic recoil = chest wall expansion |
| Inspiratory Capacity (IC) | TV + IRV | ~3,500 mL | Maximum inspiratory effort from FRC |
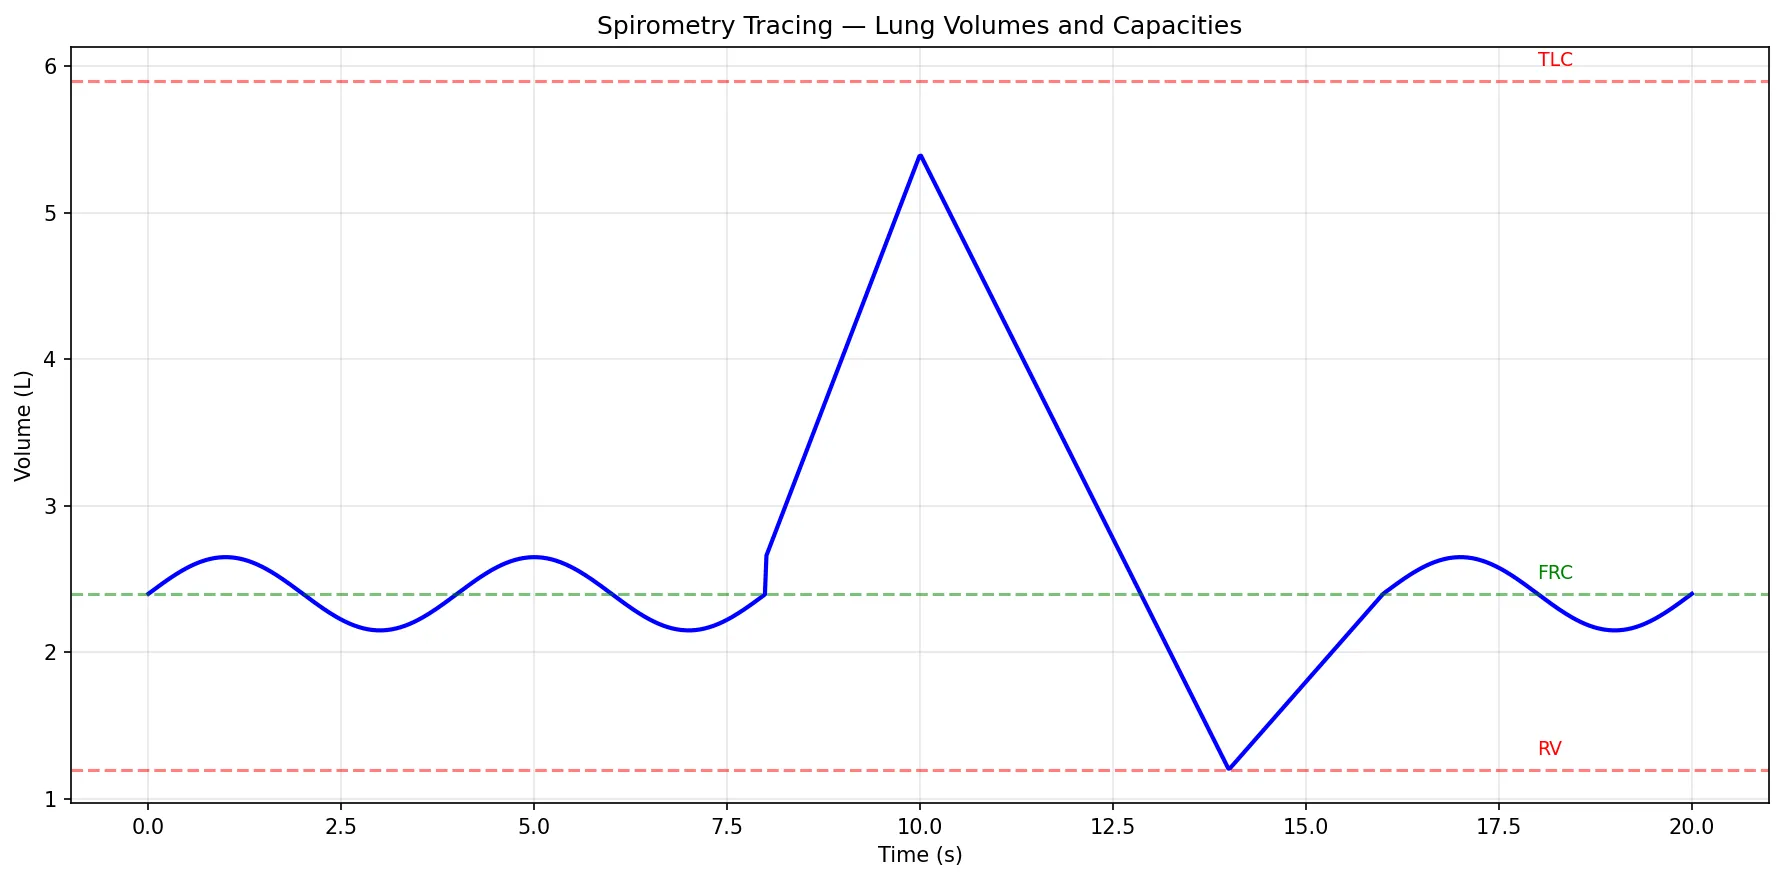
import numpy as np
import matplotlib.pyplot as plt

# Simulate spirometry tracing
time = np.linspace(0, 20, 1000)
volume = np.zeros_like(time)

# Normal tidal breathing (0-8s)
for i, t in enumerate(time):
    if t < 8:
        volume[i] = 2400 + 250 * np.sin(2 * np.pi * t / 4)  # FRC ± TV/2
    elif t < 10:
        # Maximal inspiration
        volume[i] = 2400 + 250 + (3000 - 250) * (t - 8) / 2
    elif t < 14:
        # Maximal expiration through TV, ERV to RV
        volume[i] = 5400 - (5400 - 1200) * (t - 10) / 4
    elif t < 16:
        # Back to FRC
        volume[i] = 1200 + (2400 - 1200) * (t - 14) / 2
    else:
        # Resume tidal breathing
        volume[i] = 2400 + 250 * np.sin(2 * np.pi * (t - 16) / 4)

plt.figure(figsize=(12, 6))
plt.plot(time, volume / 1000, 'b-', linewidth=2)
plt.ylabel('Volume (L)')
plt.xlabel('Time (s)')
plt.title('Spirometry Tracing — Lung Volumes and Capacities')

# Annotate volumes
plt.axhline(y=5.9, color='red', linestyle='--', alpha=0.5)
plt.axhline(y=1.2, color='red', linestyle='--', alpha=0.5)
plt.axhline(y=2.4, color='green', linestyle='--', alpha=0.5)
plt.text(18, 6.0, 'TLC', fontsize=9, color='red')
plt.text(18, 1.3, 'RV', fontsize=9, color='red')
plt.text(18, 2.5, 'FRC', fontsize=9, color='green')
plt.grid(True, alpha=0.3)
plt.tight_layout()
plt.show()
Compliance & Elastic Recoil
Compliance is the ease with which the lung expands — defined as the change in volume per unit change in pressure (C = ΔV/ΔP). Two opposing forces determine lung volume at any moment:
| Property | Definition | Increased In | Decreased In |
|---|---|---|---|
| Lung Compliance | Tendency of lungs to expand | Emphysema (loss of elastic tissue) | Pulmonary fibrosis, ARDS, surfactant deficiency |
| Elastic Recoil | Tendency of lungs to collapse | Pulmonary fibrosis (excess collagen) | Emphysema (elastin destruction) |
| Chest Wall Compliance | Tendency of chest to expand | Normal state (chest wants to spring outward) | Kyphoscoliosis, obesity, ankylosing spondylitis |
Surfactant — The Life-Saving Molecule
Pulmonary surfactant, produced by Type II alveolar cells (pneumocytes), is a phospholipid complex (primarily dipalmitoylphosphatidylcholine — DPPC) that reduces surface tension at the air-liquid interface. According to LaPlace's Law (P = 2T/r), small alveoli with high surface tension would collapse into larger ones without surfactant. Surfactant also reduces the work of breathing by approximately 50%.
Airway Resistance
Airway resistance follows the same Poiseuille principles as vascular resistance (R ∝ 1/r⁴). Notably, the medium-sized bronchi (generations 3–8) are the primary site of airway resistance — not the smallest airways, which have enormous total cross-sectional area in parallel.
| Factor | ↑ Resistance | ↓ Resistance |
|---|---|---|
| Airway Diameter | Bronchoconstriction (asthma, COPD) | Bronchodilation (β₂-agonists, epinephrine) |
| Lung Volume | Low volume (airways compressed) | High volume (airways stretched open by radial traction) |
| Mucus/Oedema | Excess secretions (bronchitis, CF) | Mucolytics, suctioning |
| Neural Control | Parasympathetic (vagal ACh → M₃ receptors) | Sympathetic (β₂-adrenergic receptors) |
Work of Breathing
Normally, breathing consumes only 3–5% of total body oxygen consumption. This can rise dramatically in respiratory disease:
- Obstructive disease (asthma, COPD): Increased resistive work — patients breathe slowly and deeply to minimise turbulent flow
- Restrictive disease (fibrosis, obesity): Increased elastic work — patients breathe rapidly and shallowly to minimise the stiff-lung penalty
- Respiratory failure: When work of breathing exceeds 30–40% of total O₂ consumption, respiratory muscles fatigue and mechanical ventilation becomes necessary
Gas Exchange
The ultimate purpose of ventilation is to deliver fresh air to the alveoli where gas exchange occurs across one of the thinnest biological barriers in the body — just 0.5 μm separating air from blood. Each minute, approximately 250 mL of O₂ crosses this membrane into the blood while 200 mL of CO₂ crosses in the opposite direction.
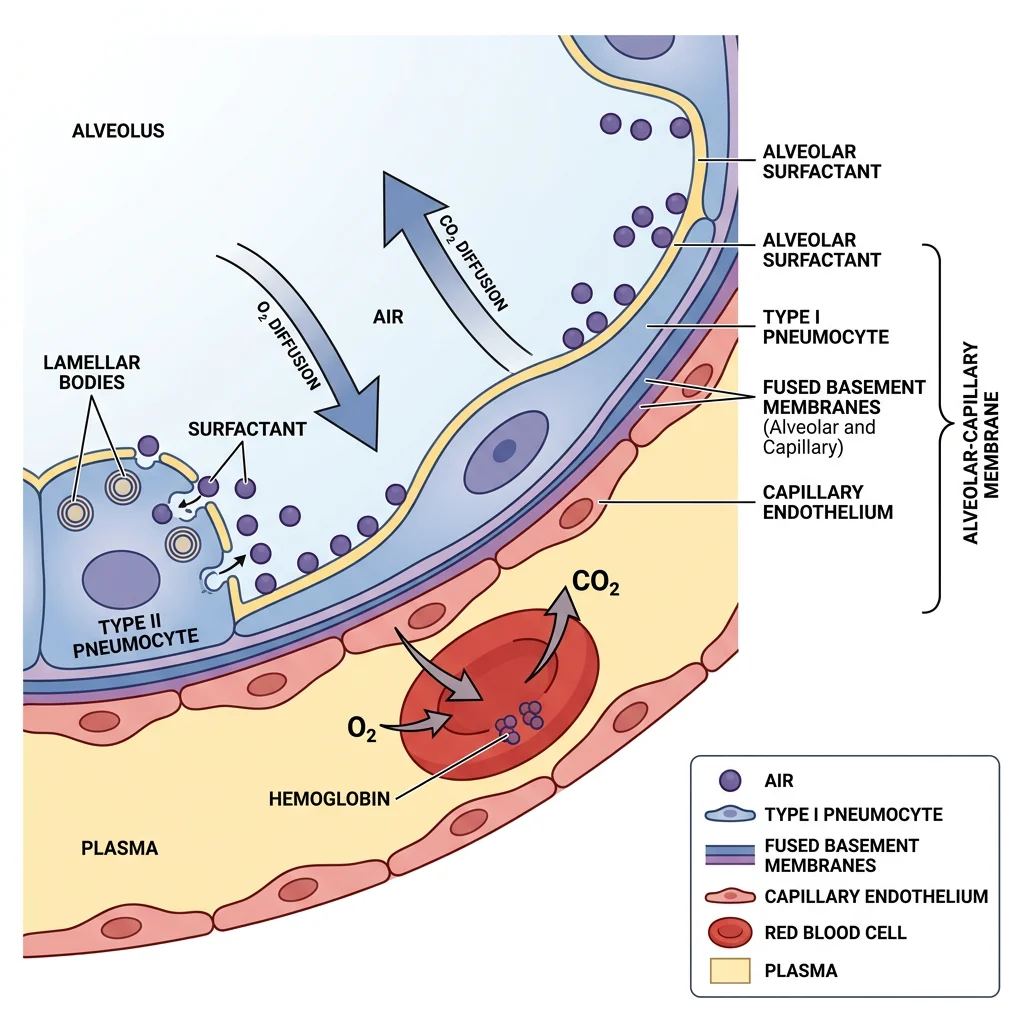
Alveolar Structure
The lungs contain approximately 300 million alveoli providing a gas exchange surface area of ~70 m² (roughly the size of a tennis court). The alveolar-capillary membrane consists of:
- Surfactant layer — reduces surface tension
- Type I pneumocytes — thin squamous cells (95% of alveolar surface area) optimised for gas exchange
- Basement membrane — fused alveolar and capillary membranes
- Capillary endothelium — single cell layer
Diffusion Principles
Gas exchange is governed by Fick's Law of Diffusion:
Where: A = surface area, D = diffusion coefficient (solubility/√MW), ΔP = partial pressure gradient, T = membrane thickness
Clinical implication: CO₂ diffuses ~20× faster than O₂ (much higher solubility despite similar MW). Therefore, hypoxia always occurs before hypercapnia in diffusion impairment — CO₂ retention is a late and ominous sign.
| Partial Pressure | Atmosphere | Alveolar Air | Arterial Blood | Venous Blood | Tissues |
|---|---|---|---|---|---|
| PO₂ (mmHg) | 160 | 100 | 95–100 | 40 | ≤40 |
| PCO₂ (mmHg) | 0.3 | 40 | 40 | 46 | ≥46 |
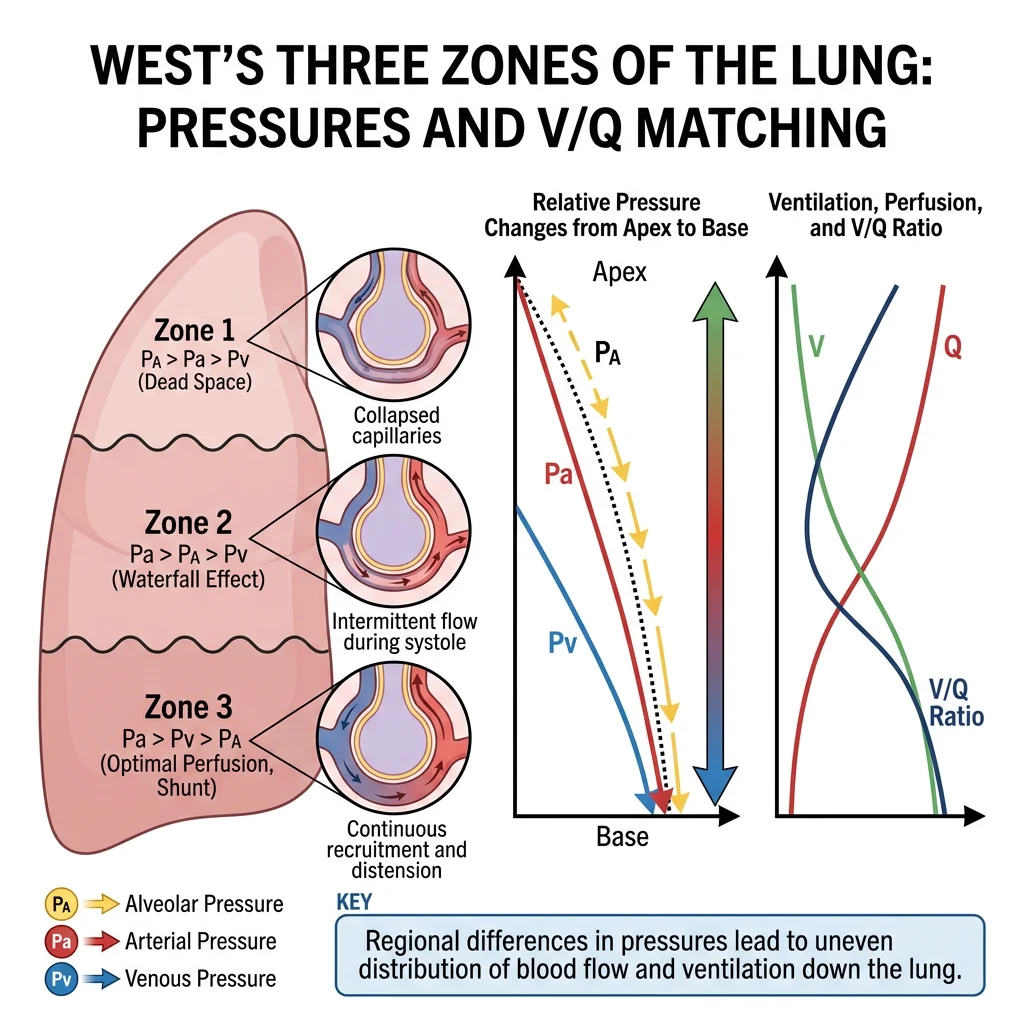
Ventilation-Perfusion Ratio
For optimal gas exchange, ventilation (V̇) and perfusion (Q̇) must be matched. The ideal V̇/Q̇ ratio is approximately 0.8 (4 L/min alveolar ventilation ÷ 5 L/min cardiac output). However, gravity creates a gradient:
| Lung Zone | Ventilation | Perfusion | V̇/Q̇ Ratio | Gas Exchange |
|---|---|---|---|---|
| Apex (Zone 1) | Good | Poor (gravity pulls blood down) | High (~3.3) | Relative dead space — wasted ventilation |
| Middle (Zone 2) | Good | Good | ~1.0 | Best V̇/Q̇ matching |
| Base (Zone 3) | Best | Best (gravity) | Low (~0.6) | Relative shunt — blood passes with less gas exchange |
Pulmonary Embolism: V̇/Q̇ Mismatch in Action
A 35-year-old woman on oral contraceptives presents post-long-haul flight with sudden dyspnoea, pleuritic chest pain, and tachycardia. SpO₂ = 88% on room air.
- Pathophysiology: A thrombus from deep leg veins embolises to the pulmonary vasculature, blocking perfusion to a lung segment
- V̇/Q̇ effect: The blocked segment has ventilation but NO perfusion → V̇/Q̇ = ∞ (dead space). Alveolar dead space increases dramatically
- A-a gradient: Markedly elevated (normally < 10 mmHg in young adult) — distinguishing this from hypoventilation
- Diagnosis: CT pulmonary angiography (CTPA) — gold standard; D-dimer screening (high negative predictive value)
- Treatment: Anticoagulation (heparin → warfarin/DOAC); thrombolysis for massive PE with hemodynamic compromise
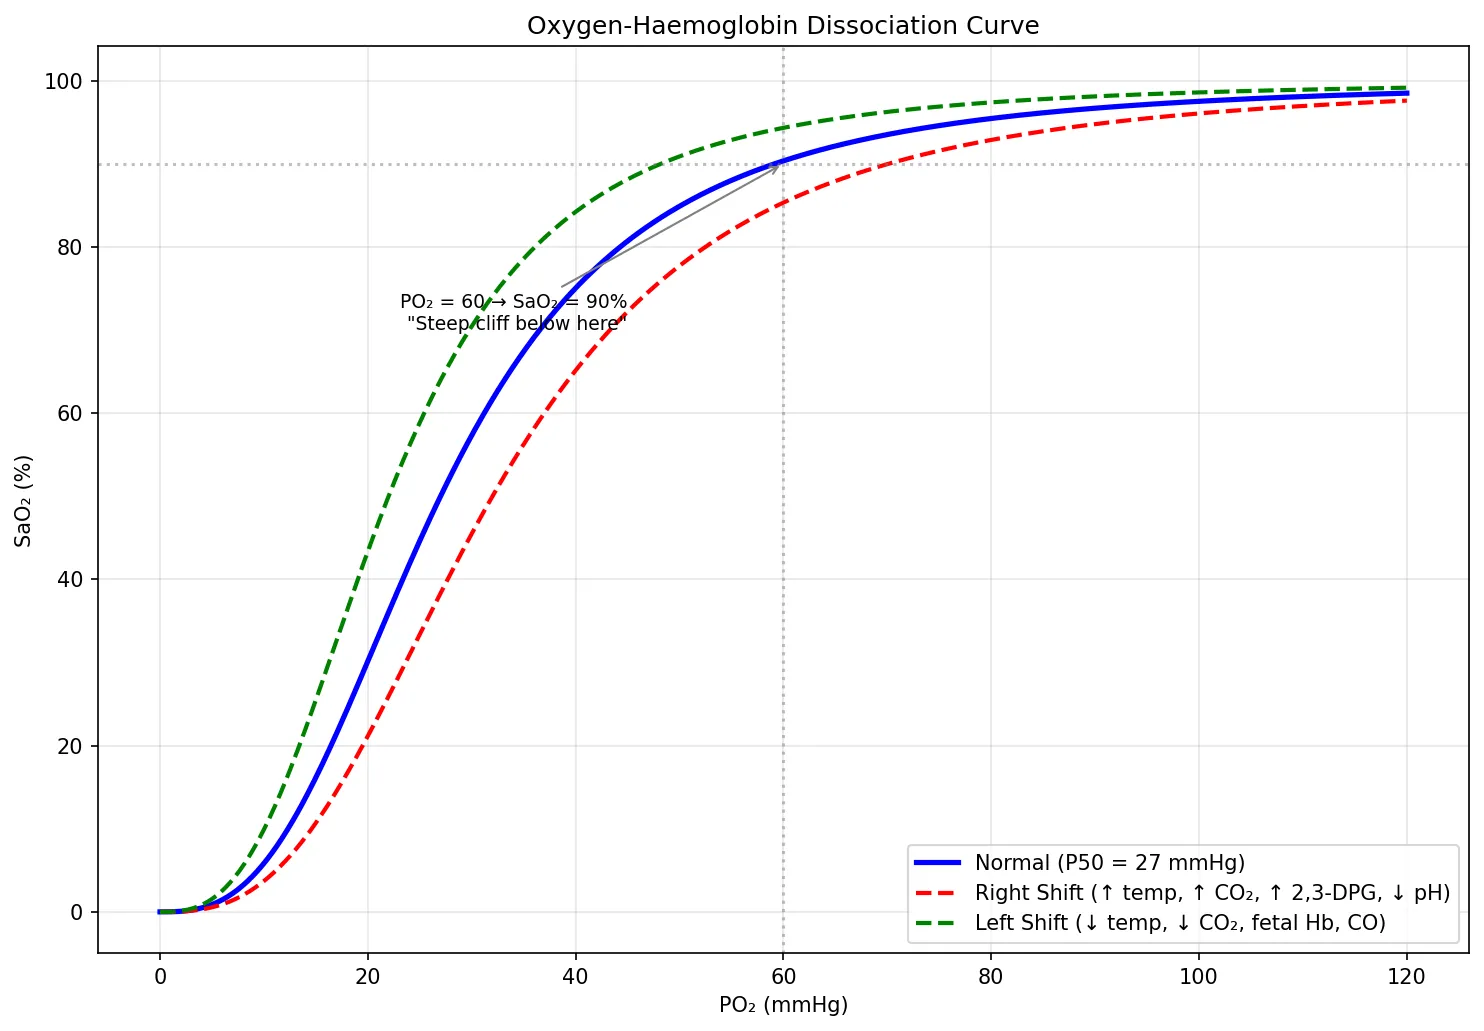
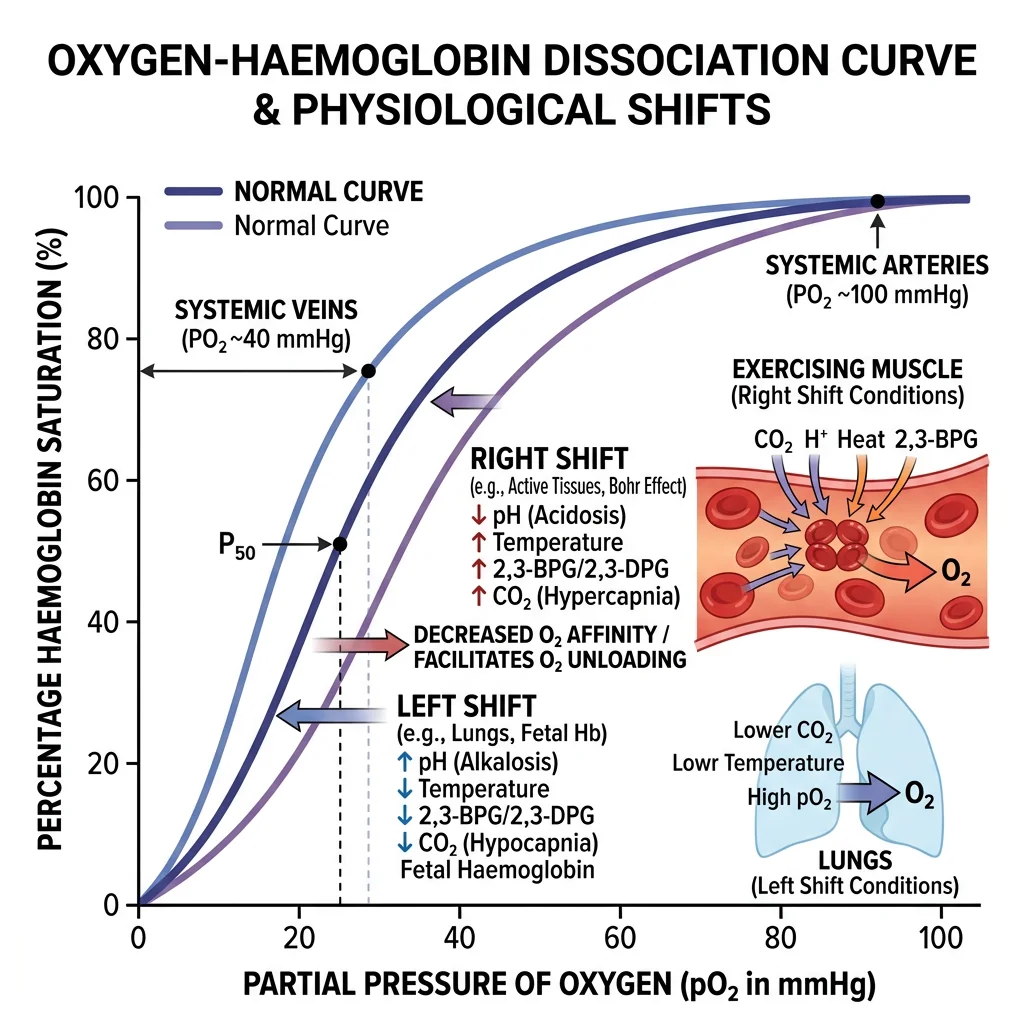
Oxygen Dissociation Curve
The oxygen-haemoglobin dissociation curve is perhaps the most clinically important graph in physiology. Its sigmoidal shape reflects cooperative binding — once one O₂ molecule binds to haemoglobin, subsequent binding becomes easier (positive cooperativity).
| PO₂ (mmHg) | SaO₂ (%) | Clinical Significance |
|---|---|---|
| 100 | ~98% | Normal arterial blood — nearly fully saturated |
| 60 | ~90% | Critical threshold — below this, saturation drops steeply ("cliff") |
| 40 | ~75% | Normal mixed venous blood |
| 27 | ~50% | P50 — PO₂ at 50% saturation (measure of Hb O₂ affinity) |
import numpy as np
import matplotlib.pyplot as plt

# Hill equation for oxygen-hemoglobin dissociation curve
def sao2(po2, p50=27, n=2.8):
    """Calculate SaO2 using Hill equation."""
    return 100 * (po2**n) / (p50**n + po2**n)

po2 = np.linspace(0, 120, 500)

# Normal curve
sat_normal = sao2(po2, p50=27)
# Right-shifted (↑ P50 = ↓ affinity = easier O2 release)
sat_right = sao2(po2, p50=32)
# Left-shifted (↓ P50 = ↑ affinity = harder O2 release)
sat_left = sao2(po2, p50=22)

plt.figure(figsize=(10, 7))
plt.plot(po2, sat_normal, 'b-', linewidth=2.5, label='Normal (P50 = 27 mmHg)')
plt.plot(po2, sat_right, 'r--', linewidth=2, label='Right Shift (↑ temp, ↑ CO₂, ↑ 2,3-DPG, ↓ pH)')
plt.plot(po2, sat_left, 'g--', linewidth=2, label='Left Shift (↓ temp, ↓ CO₂, fetal Hb, CO)')

plt.axhline(y=90, color='gray', linestyle=':', alpha=0.5)
plt.axvline(x=60, color='gray', linestyle=':', alpha=0.5)
plt.annotate('PO₂ = 60 → SaO₂ = 90%\n"Steep cliff below here"',
            xy=(60, 90), fontsize=9, ha='right',
            xytext=(45, 70), arrowprops=dict(arrowstyle='->', color='gray'))

plt.xlabel('PO₂ (mmHg)')
plt.ylabel('SaO₂ (%)')
plt.title('Oxygen-Haemoglobin Dissociation Curve')
plt.legend(loc='lower right')
plt.grid(True, alpha=0.3)
plt.tight_layout()
plt.show()
Transport in Blood
Once O₂ crosses the alveolar membrane, it must be carried to tissues — and CO₂ must travel the reverse journey. Haemoglobin is the molecular workhorse, carrying 98.5% of all oxygen in the blood. Without it, plasma alone could only dissolve enough O₂ to support life for about 3 seconds.
Haemoglobin Binding
Haemoglobin (Hb) is a tetrameric protein with four haem groups, each containing an iron atom (Fe²⁺) that reversibly binds one O₂ molecule. Key concepts:
| Haemoglobin Form | Structure | Oxygen Affinity | Clinical Relevance |
|---|---|---|---|
| Adult Hb (HbA) | α₂β₂ | Normal (P50 = 27) | 97% of adult Hb |
| Fetal Hb (HbF) | α₂γ₂ | ↑ (left shift, lower P50) | Grabs O₂ from maternal HbA across placenta |
| Carboxyhaemoglobin (HbCO) | Hb + CO | ↑↑ (CO binds 240× more than O₂) | Carbon monoxide poisoning — cherry red appearance, SpO₂ falsely normal |
| Methaemoglobin (MetHb) | Fe³⁺ (oxidised) | ↑ (cannot release O₂) | Caused by dapsone, nitrites; treat with methylene blue |
| Sickle Hb (HbS) | α₂βS₂ (Glu→Val) | ↓ when deoxygenated | Polymerises when deoxygenated → sickle shape → vaso-occlusion |
CaO₂ = (1.34 × Hb × SaO₂/100) + (0.003 × PaO₂)
Normal: (1.34 × 15 × 0.98) + (0.003 × 100) = 19.7 + 0.3 = ~20 mL O₂/dL
Note: Dissolved O₂ (0.3 mL) is trivial compared to Hb-bound O₂ (19.7 mL) — this is why anaemia is far more dangerous than mild hypoxia for oxygen delivery.
CO₂ Transport Forms
CO₂ is transported in three forms:
| Form | Percentage | Mechanism | Key Detail |
|---|---|---|---|
| Bicarbonate (HCO₃⁻) | ~70% | CO₂ + H₂O → H₂CO₃ → H⁺ + HCO₃⁻ (catalysed by carbonic anhydrase in RBCs) | HCO₃⁻ exits RBC via chloride shift (Cl⁻/HCO₃⁻ antiporter) |
| Carbaminohaemoglobin | ~23% | CO₂ binds directly to amino groups on Hb | Deoxygenated Hb binds CO₂ more readily (Haldane effect) |
| Dissolved CO₂ | ~7% | CO₂ dissolves directly in plasma | This is what PaCO₂ measures on ABG |
Bohr & Haldane Effects
These two reciprocal effects are the genius of oxygen-CO₂ transport, ensuring efficient loading and unloading at exactly the right locations:
Bohr Effect (Discovered 1904)
"CO₂ and acid help O₂ unload at tissues."
At the tissues: ↑ PCO₂ and ↑ H⁺ (↓ pH) shift the O₂ dissociation curve RIGHT → ↓ Hb-O₂ affinity → O₂ is released to metabolically active tissues that need it most.
Haldane Effect (Described 1914)
"O₂ unloading helps Hb pick up CO₂ at tissues."
At the tissues: As O₂ leaves Hb (deoxygenation), Hb's affinity for CO₂ and H⁺ INCREASES → more CO₂ is carried as carbaminohaemoglobin, and more H⁺ is buffered. At the lungs, the reverse occurs — O₂ binding displaces CO₂.
Together, these effects create a beautiful molecular conveyor belt: O₂ delivery and CO₂ removal are automatically coupled at both the tissue and lung levels.
Regulation of Respiration
Breathing is one of the few vital functions that operates both automatically (brainstem control) and voluntarily (cortical override for speaking, singing, breath-holding). The regulatory system must maintain PaO₂, PaCO₂, and pH within tight limits despite wildly varying metabolic demands — from sleep to maximal exercise.
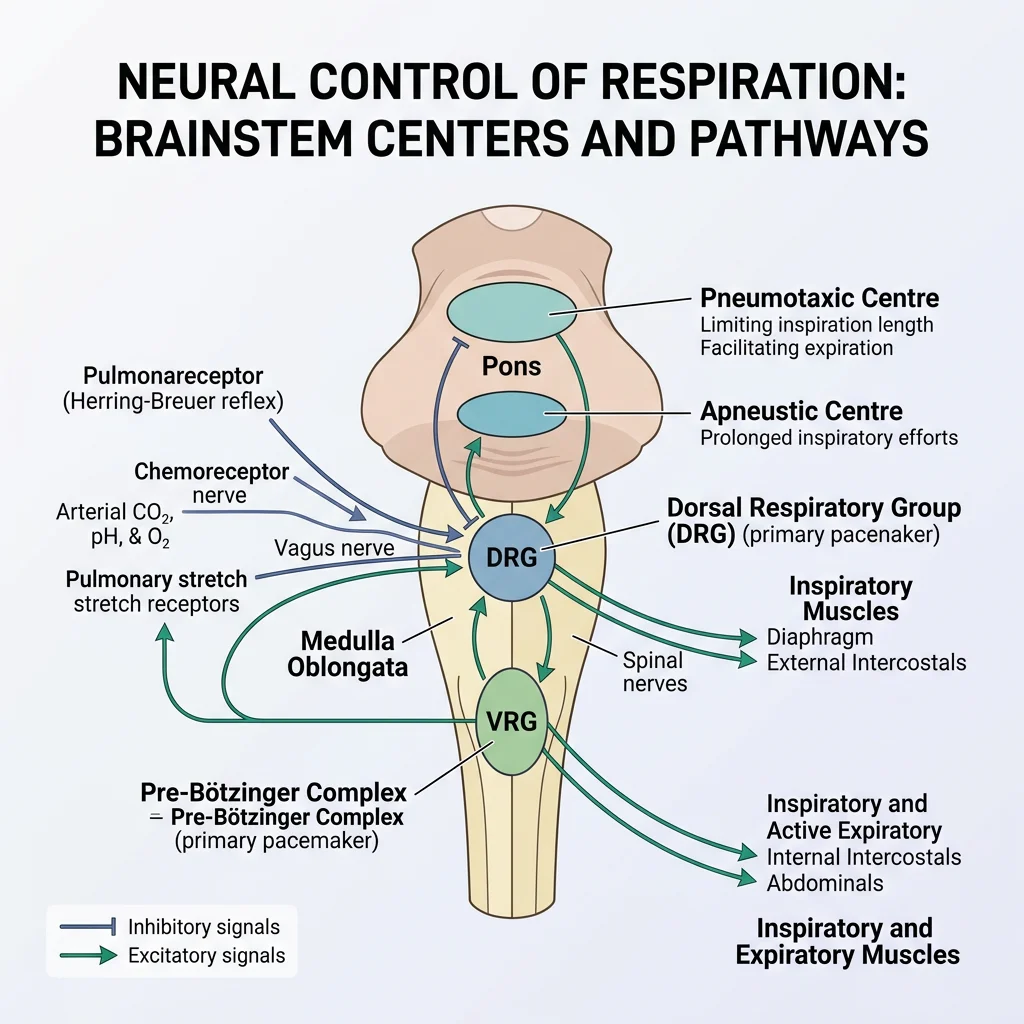
Medullary Respiratory Centres
The brainstem contains the central pattern generators for breathing:
| Centre | Location | Function | Clinical Correlation |
|---|---|---|---|
| Dorsal Respiratory Group (DRG) | Nucleus tractus solitarius (medulla) | Inspiration — receives input from vagus (X) and glossopharyngeal (IX) | Primary inspiratory pacemaker |
| Ventral Respiratory Group (VRG) | Nucleus ambiguus, retroambiguus (medulla) | Both inspiration and active expiration; inactive during quiet breathing | Recruits accessory muscles during exercise |
| Pneumotaxic Centre | Pons (dorsolateral) | Limits inspiration duration → controls respiratory rate | Lesion → apneustic breathing (prolonged inspiration) |
| Apneustic Centre | Pons (lower) | Promotes inspiration (opposed by pneumotaxic centre) | Unopposed → deep gasping inspirations |
| Pre-Bötzinger Complex | Ventrolateral medulla | Generates the fundamental respiratory rhythm | Discovered 1991; now recognised as the true pacemaker |
Chemoreceptor Control
Chemoreceptors provide the crucial feedback that adjusts ventilation to metabolic demands:
| Type | Location | Primary Stimulus | Mechanism | Response |
|---|---|---|---|---|
| Central | Ventral medulla surface | ↑ H⁺ in CSF (from CO₂) | CO₂ crosses BBB → carbonic anhydrase → H⁺ + HCO₃⁻ → H⁺ stimulates receptors | ↑ Ventilation (most important minute-to-minute driver) |
| Peripheral (Carotid body) | Carotid bifurcation (CN IX) | ↓ PaO₂ (<60 mmHg), ↑ PaCO₂, ↓ pH | Glomus (Type I) cells sense O₂ via O₂-sensitive K⁺ channels | ↑ Ventilation; ONLY sensors that detect hypoxia |
| Peripheral (Aortic body) | Aortic arch (CN X) | ↓ PaO₂, ↑ PaCO₂, ↓ pH | Similar to carotid body but less sensitive | ↑ Ventilation (minor role compared to carotid) |
Response to Altitude & Exercise
Altitude Adaptation
At 5,500 m (18,000 ft), atmospheric pressure is ~50% of sea level, so PiO₂ ≈ 80 mmHg (vs 160 mmHg). The body adapts through a cascade of responses:
- Acute (hours): Peripheral chemoreceptor-driven hyperventilation → ↓ PaCO₂ → respiratory alkalosis
- Days: Renal compensation — HCO₃⁻ excretion restores pH, allowing further hyperventilation
- Weeks: ↑ Erythropoietin → ↑ red blood cell mass → ↑ oxygen-carrying capacity
- Weeks: ↑ 2,3-DPG in RBCs → right-shift of O₂ dissociation curve → better tissue O₂ release
- Months: ↑ Capillary density, ↑ mitochondrial oxidative enzymes
Exercise Response
During maximal exercise, ventilation increases from ~6 L/min to ~100+ L/min — a 15-fold increase — yet PaO₂ and PaCO₂ remain remarkably stable in healthy individuals. The mechanism remains debated ("exercise hyperpnoea paradox") but likely involves:
- Cortical anticipatory drive ("central command")
- Proprioceptor feedback from exercising muscles (Group III/IV afferents)
- Increased CO₂ production matching increased ventilation
- Oscillations in PaCO₂ (not mean level) detected by chemoreceptors
Advanced Topics
This section integrates respiratory physiology into clinical pathophysiology — the conditions that bring patients to emergency departments and intensive care units.
Respiratory Failure Types
| Type | PaO₂ | PaCO₂ | A-a Gradient | Mechanism | Examples |
|---|---|---|---|---|---|
| Type I (Hypoxaemic) | ↓ (<60 mmHg) | Normal or ↓ | ↑ | V̇/Q̇ mismatch, shunt, diffusion impairment | Pneumonia, PE, ARDS, pulmonary fibrosis |
| Type II (Hypercapnic) | ↓ | ↑ (>45 mmHg) | Normal | Alveolar hypoventilation | COPD, neuromuscular disease (MND, GBS), drug overdose (opioids) |
A-a gradient = PAO₂ − PaO₂
PAO₂ = FiO₂(Patm − PH₂O) − PaCO₂/RQ
PAO₂ = 0.21(760 − 47) − 40/0.8 = 150 − 50 = 100 mmHg
Normal A-a gradient = ½(Age in years/4) + 4 ≈ < 10–15 mmHg in young adults
If A-a gradient is normal → hypoventilation (Type II). If ↑ → V̇/Q̇ mismatch / shunt / diffusion defect (Type I).
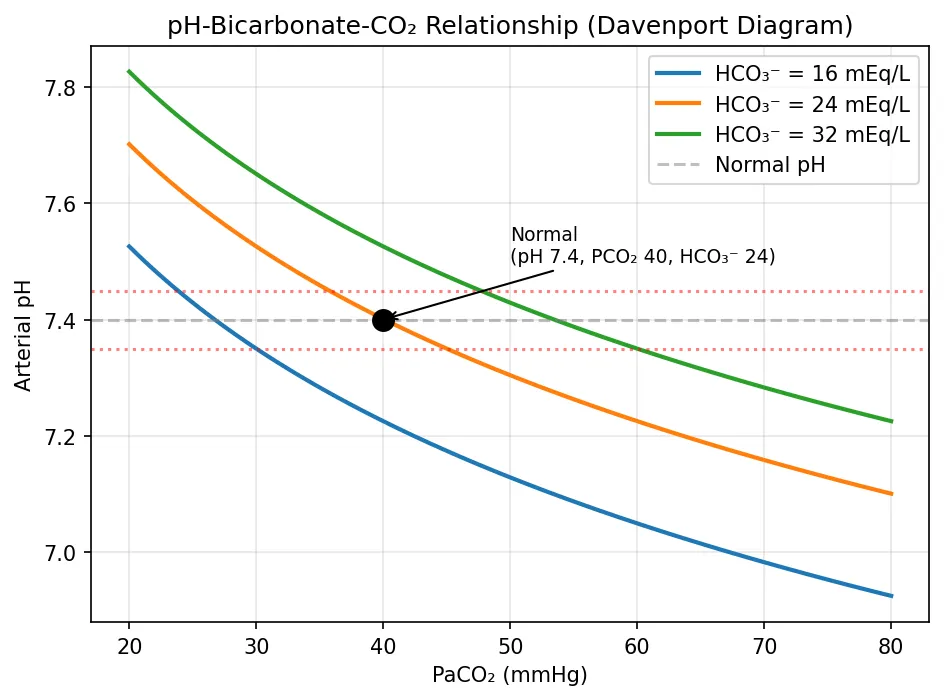
Acid-Base Integration
The respiratory system is the second line of defence (after chemical buffers) and the fastest physiological system for acid-base correction:
| Disturbance | Primary Change | Respiratory Compensation | Expected Response |
|---|---|---|---|
| Metabolic Acidosis | ↓ HCO₃⁻ | Hyperventilation (Kussmaul) | Winter's formula: PaCO₂ = 1.5(HCO₃⁻) + 8 ± 2 |
| Metabolic Alkalosis | ↑ HCO₃⁻ | Hypoventilation | PaCO₂ = 0.7(HCO₃⁻) + 21 ± 2 |
| Respiratory Acidosis | ↑ PaCO₂ | N/A (this IS the respiratory problem) | Renal compensation: ↑ HCO₃⁻ retention (3–5 days) |
| Respiratory Alkalosis | ↓ PaCO₂ | N/A | Renal compensation: ↓ HCO₃⁻ retention |
import numpy as np
import matplotlib.pyplot as plt

# Henderson-Hasselbalch: pH = 6.1 + log10([HCO3] / (0.03 * PCO2))
pco2_range = np.linspace(20, 80, 100)

# Different HCO3 levels
for hco3 in [16, 24, 32]:
    pH = 6.1 + np.log10(hco3 / (0.03 * pco2_range))
    label = f'HCO₃⁻ = {hco3} mEq/L'
    plt.plot(pco2_range, pH, linewidth=2, label=label)

plt.axhline(y=7.4, color='gray', linestyle='--', alpha=0.5, label='Normal pH')
plt.axhline(y=7.35, color='red', linestyle=':', alpha=0.5)
plt.axhline(y=7.45, color='red', linestyle=':', alpha=0.5)

plt.xlabel('PaCO₂ (mmHg)')
plt.ylabel('Arterial pH')
plt.title('pH-Bicarbonate-CO₂ Relationship (Davenport Diagram)')
plt.legend()
plt.grid(True, alpha=0.3)

# Mark normal operating point
plt.plot(40, 7.4, 'ko', markersize=10)
plt.annotate('Normal\n(pH 7.4, PCO₂ 40, HCO₃⁻ 24)',
            xy=(40, 7.4), xytext=(50, 7.5),
            fontsize=9, arrowprops=dict(arrowstyle='->'))
plt.tight_layout()
plt.show()
Mechanical Ventilation Physiology
Understanding the physiology of mechanical ventilation requires understanding how positive-pressure ventilation reverses the normal mechanics:
| Feature | Spontaneous Breathing | Positive Pressure Ventilation |
|---|---|---|
| Driving Pressure | Negative intrapleural pressure (diaphragm contraction pulls air in) | Positive airway pressure pushes air in |
| Intrathoracic Pressure | ↓ during inspiration (augments venous return) | ↑ during inspiration (impedes venous return) |
| Effect on Preload | ↑ (negative pressure sucks blood into thorax) | ↓ (positive pressure squeezes blood out and impedes return) |
| Effect on Cardiac Output | Augmented | Potentially reduced (↓ preload → ↓ CO), especially with high PEEP |
Interactive Tool
Use this Pulmonary Function Analyser to document spirometry values, arterial blood gas results, and clinical context. Generate a professional report in Word, Excel, or PDF format.
Pulmonary Function Analyser
Enter pulmonary function data and ABG results. Download as Word, Excel, or PDF.
Conclusion & Next Steps
In this article, we explored the complete respiratory pathway — from the physics of ventilation (Boyle's Law, compliance, resistance) through alveolar gas exchange (Fick's Law, V̇/Q̇ matching) to the elegant molecular choreography of O₂ and CO₂ transport (haemoglobin binding, Bohr and Haldane effects). We then examined how the brainstem orchestrates breathing through a hierarchy of respiratory centres and chemoreceptors, and how the system adapts to extreme challenges like altitude and exercise.
The advanced section connected these principles to clinical reality — respiratory failure classification, acid-base integration, and the reversal of normal mechanics under positive-pressure ventilation.
The respiratory system works hand-in-hand with the kidneys for long-term acid-base regulation. In the next article, we'll dive deep into renal physiology — glomerular filtration, tubular processing, and how the kidney maintains fluid, electrolyte, and acid-base homeostasis.