Business Strategy
Structured Problem Solving
Hypothesis-driven thinking, problem structuring, root cause analysisMECE & Issue Trees
Mutually exclusive, collectively exhaustive, logic treesStrategy Frameworks
Porter's Five Forces, SWOT, BCG Matrix, value chainMcKinsey 7S & Organizational Analysis
Structure, strategy, systems, shared values, skillsFinancial Due Diligence
Financial statements, valuation, M&A analysis, modelingClient Communication & Delivery
Pyramid principle, slide design, stakeholder managementAdvanced Frameworks (Bonus)
Blue ocean, disruption theory, scenario planningCase Interview Master Pack (Bonus)
Market sizing, profitability, M&A, pricing casesConsultant Toolkit (Bonus)
Templates, checklists, presentation frameworksKey Insight
The best analysis means nothing if you can't communicate it effectively. The Pyramid Principle structures your thinking for executive audiences, while stakeholder management ensures your recommendations actually get implemented. Master these skills to drive real business impact.
1. Consulting Communication Standards
Consulting is fundamentally a communication business. Your analysis is only as valuable as your ability to communicate it clearly to clients.

Clear, Concise, Confident
The three C's of consulting communication:
| Standard | What It Means | Common Mistakes |
|---|---|---|
| Clear | Simple language; no jargon unless necessary; one idea per sentence | Overusing buzzwords; ambiguous statements; passive voice |
| Concise | Every word earns its place; edit ruthlessly; respect the reader's time | Redundancy; throat-clearing phrases; over-explaining |
| Confident | Direct statements; clear recommendations; own your position | "I think maybe we could consider..."; excessive hedging |
Executive-Ready Messaging
Executives are time-poor and decision-focused. Your communication must be:
- Action-oriented: What do you want them to do?
- Bottom-line up front: Lead with the conclusion, not the methodology
- Decision-ready: Provide what they need to decide, not everything you know
- Risk-aware: Acknowledge uncertainties and assumptions
Answer-First Communication
The fundamental shift from academic to consulting communication:
Academic vs Consulting Style
| Academic Style | Consulting Style |
|---|---|
|
"We analyzed market trends, interviewed 20 customers, reviewed financial data, and built three scenarios..." "...therefore, we recommend entering the market." |
"Enter the China market in Q3—it's a $500M opportunity with 15% CAGR." "Here's why: [supporting points]" "Here's how: [implementation]" "Here's the evidence: [data]" |
2. Pyramid Principle (Minto)
Barbara Minto developed the Pyramid Principle at McKinsey. It's the gold standard for structuring business communication.
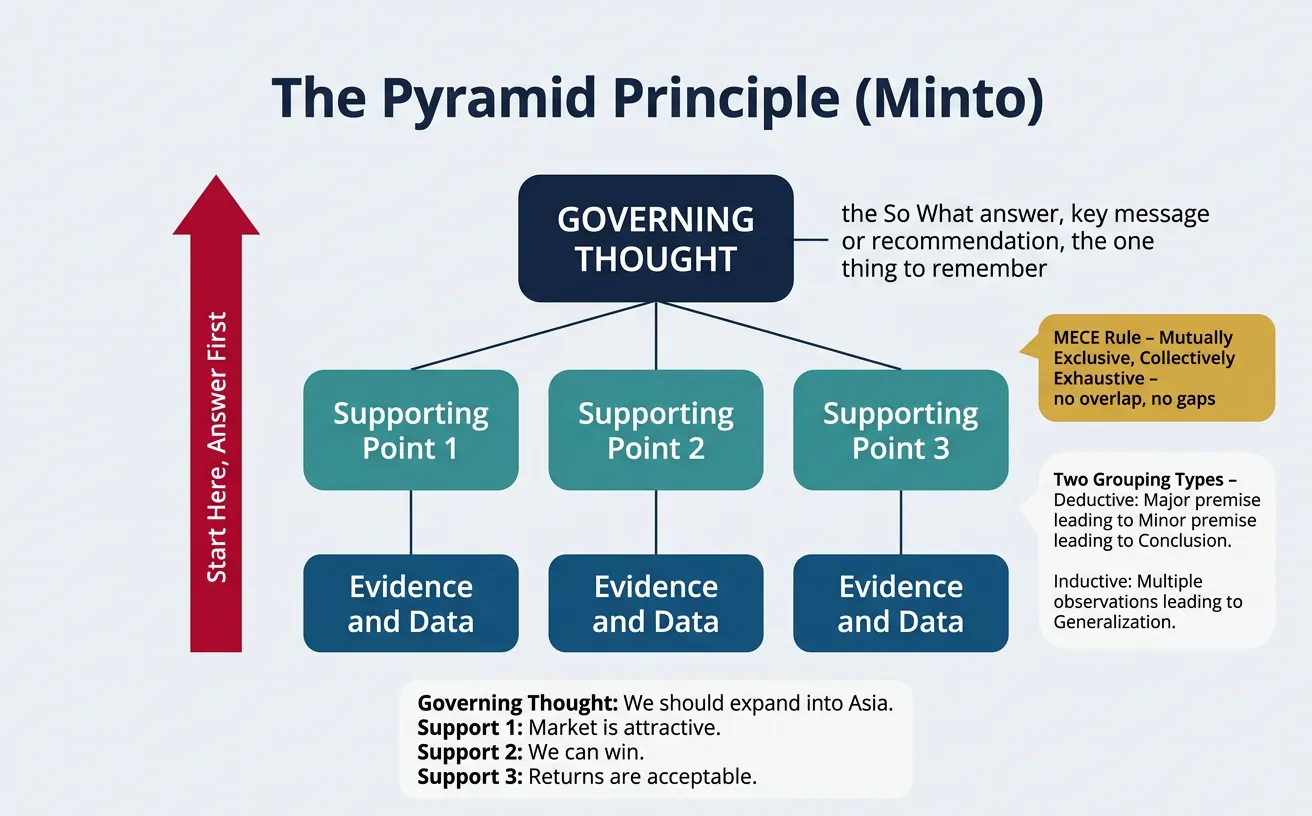
Key Message First
Start with your Governing Thought—the single most important message:
Pyramid Structure
                    ┌─────────────────────────────────┐
                    │     GOVERNING THOUGHT           │  ← "So what?" answer
                    │   (Key message / Recommendation)│     The one thing to remember
                    └─────────────┬───────────────────┘
                                  │
        ┌─────────────────────────┼─────────────────────────┐
        │                         │                         │
  ┌─────▼─────┐            ┌─────▼─────┐            ┌─────▼─────┐
  │ Supporting│            │ Supporting│            │ Supporting│
  │  Point 1  │            │  Point 2  │            │  Point 3  │
  └─────┬─────┘            └─────┬─────┘            └─────┬─────┘
        │                         │                         │
   ┌────┴────┐               ┌────┴────┐               ┌────┴────┐
   │Evidence │               │Evidence │               │Evidence │
   │& Data   │               │& Data   │               │& Data   │
   └─────────┘               └─────────┘               └─────────┘
Supporting Arguments
Supporting points must follow two rules:
| Rule | Description | Example |
|---|---|---|
| MECE | Mutually Exclusive, Collectively Exhaustive—no overlap, no gaps | "We should expand because: (1) Market is attractive, (2) We can win, (3) Returns are acceptable" |
| Same kind | All points at the same level must be the same type (reasons, steps, problems) | Wrong: "Revenues are declining (problem), improve sales training (solution)" |
Two Types of Logical Grouping
- Deductive: Major premise → Minor premise → Conclusion (Socrates is a man...)
- Inductive: Multiple observations → Generalization (Sales are down in NA, EMEA, APAC → Global sales are declining)
Consulting typically uses inductive grouping because it's easier for readers to follow.
Evidence & Data
Evidence supports your arguments with proof:
- Quantitative: Numbers, metrics, benchmarks
- Qualitative: Expert interviews, customer quotes, case studies
- External: Industry reports, market data, competitor information
3. Slide Deck & Storytelling Skills
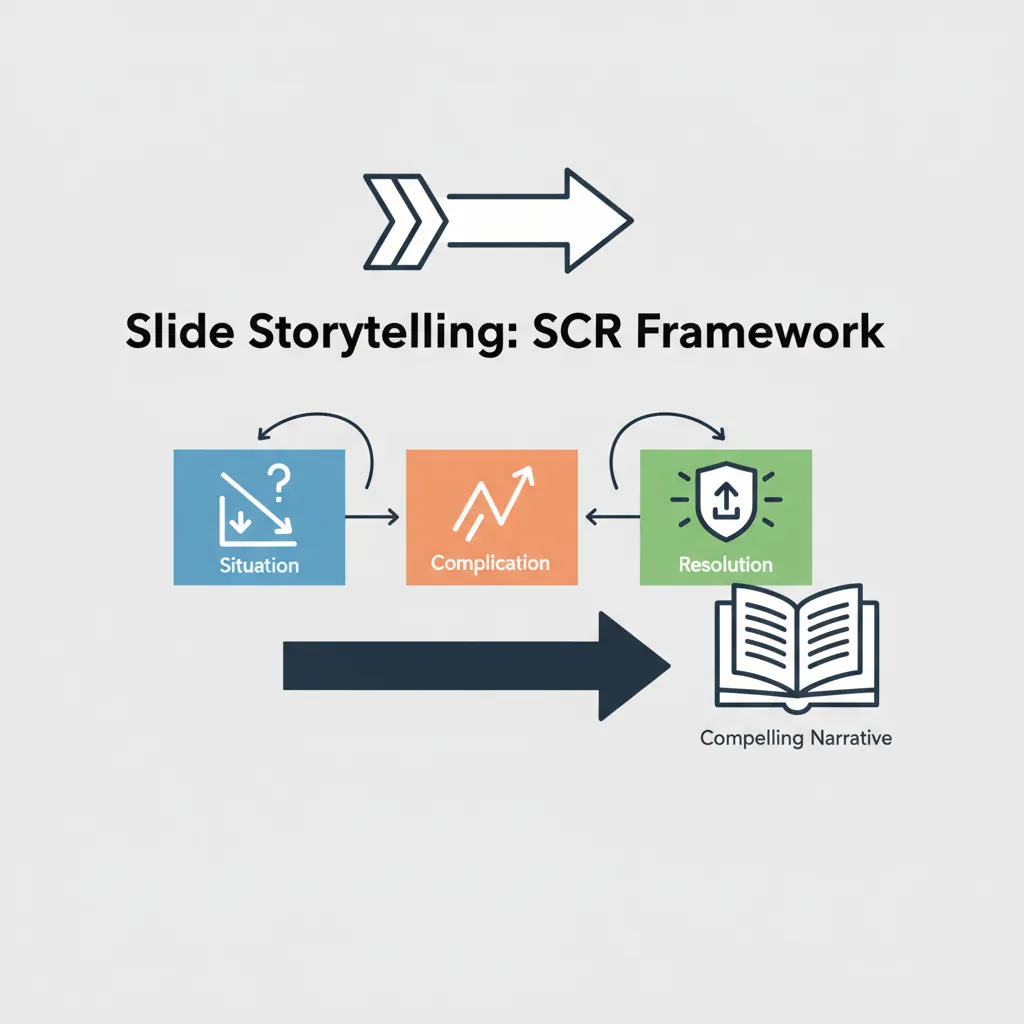
Situation-Complication-Resolution (SCR)
The SCR framework creates narrative tension that engages your audience:
| Element | Purpose | Example |
|---|---|---|
| Situation | Establish context; stable state everyone agrees on | "You're the market leader with 35% share and $500M revenue." |
| Complication | Introduce the problem or change that creates tension | "But a digital disruptor is growing 50% YoY and taking your best customers." |
| Resolution | Your recommendation to address the complication | "Launch a digital-first product line to defend your core and capture growth." |
One Message Per Slide
The single most important slide design rule: One message per slide.
Slide Structure
┌─────────────────────────────────────────────────────────────┐
│ ACTION TITLE (Complete sentence stating the "so what")      │
│ "Digital revenue grew 40% while traditional declined 5%"    │
├─────────────────────────────────────────────────────────────┤
│                                                             │
│                    SUPPORTING CONTENT                       │
│           (Chart, table, or visual that proves              │
│                    the action title)                        │
│                                                             │
├─────────────────────────────────────────────────────────────┤
│ Source: [Data source]           Key insight: [Call-out box] │
└─────────────────────────────────────────────────────────────┘
Action Title Test
Read only the slide titles in order. They should tell the complete story. If your titles are "Market Overview" or "Financial Analysis," they fail the test. Use: "Market is growing 12% driven by SMB segment" instead.
Charts That Tell the Story
| Chart Type | Best For | Key Design Principles |
|---|---|---|
| Bar chart | Comparing categories | Sort by value (unless categorical order matters); highlight the key bar |
| Line chart | Trends over time | Start Y-axis at zero (usually); annotate key inflection points |
| Waterfall | Building from one value to another | Show what added and subtracted; use consistent colors for +/- |
| Pie/Donut | Part-to-whole (sparingly) | Max 5-6 slices; start at 12 o'clock; consider bar instead |
| Scatter plot | Correlation between two variables | Add reference lines (average, targets); call out outliers |
4. Stakeholder Management
Sponsors vs Blockers
Every project has stakeholders who will help or hinder success:
| Type | Characteristics | Management Approach |
|---|---|---|
| Sponsors | Support the project; provide resources; remove obstacles | Keep informed; leverage their influence; protect relationship |
| Skeptics | Undecided; need convincing; have legitimate concerns | Engage early; address concerns; show quick wins |
| Blockers | Actively resist; may undermine progress; protect status quo | Understand their interests; find common ground; or neutralize/work around |
Influence Mapping
Map stakeholders on two dimensions: Influence (power) and Support (attitude):
Stakeholder Matrix
| Low Influence | High Influence | |
|---|---|---|
| Supportive | Mobilize Use as change agents; give them voice |
Leverage Your champions; keep them engaged |
| Opposed | Monitor Don't over-invest; watch for escalation |
Convert or Neutralize Critical to address; engage heavily |
Handling Difficult Clients
| Situation | Approach |
|---|---|
| Client disagrees with findings | Separate data from interpretation; invite them to analyze; find common ground on facts first |
| Client wants different answer | Understand their constraints; explore what would change the answer; be honest about trade-offs |
| Scope creep | Document scope changes; discuss trade-offs; get sign-off; protect team capacity |
| Unresponsive client | Escalate to sponsor; document attempts; propose alternatives; don't let project stall |
Map stakeholders by influence and interest to develop targeted engagement strategies. Download as Word, Excel, or PDF.
All data stays in your browser. Nothing is sent to or stored on any server.
5. Workshop & Meeting Facilitation
Consultants often facilitate workshops to gather input, align stakeholders, and drive decisions. Good facilitation is a distinct skill from presentation.
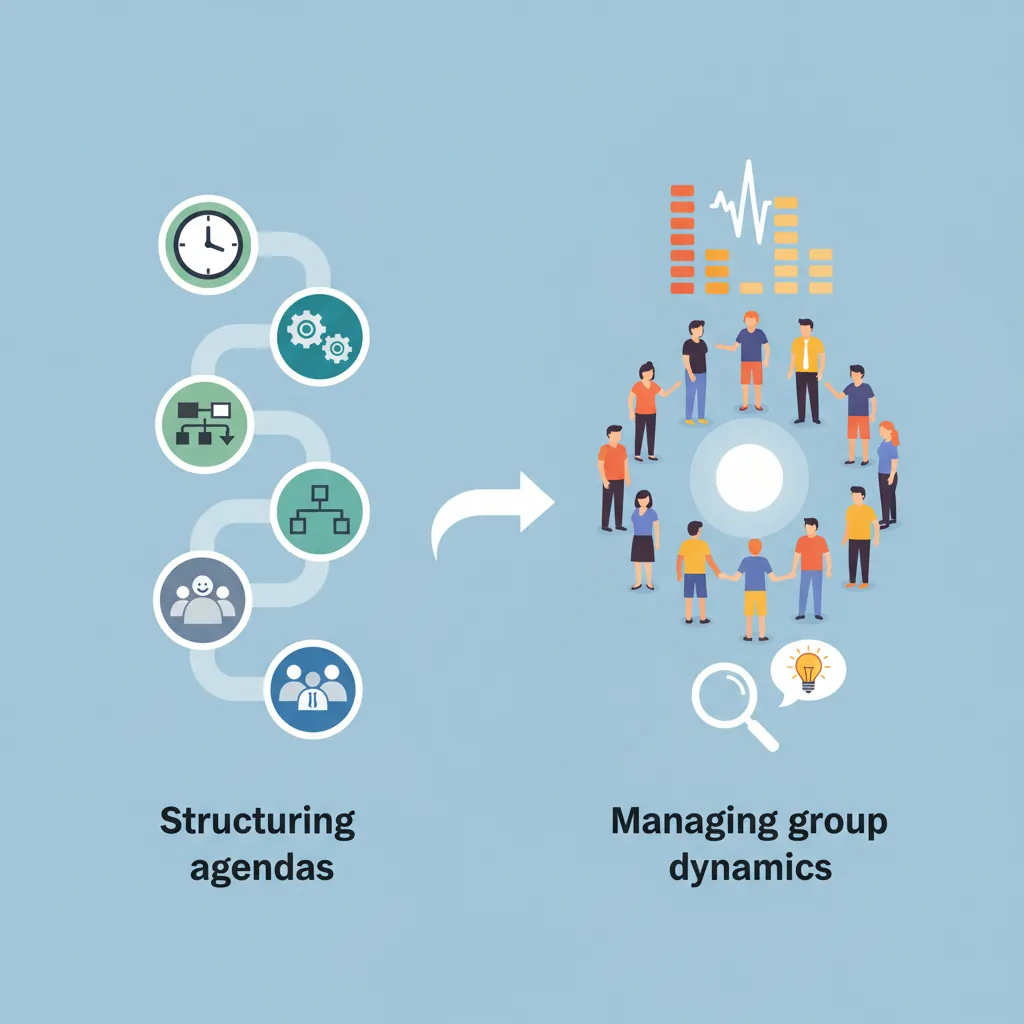
Structured Agendas
Every workshop needs a clear agenda shared in advance:
Workshop Agenda Template
STRATEGY ALIGNMENT WORKSHOP
Date: [Date]    Time: 9:00 AM - 12:00 PM    Location: [Room/Virtual]

OBJECTIVES:
1. Align on strategic priorities for FY26
2. Identify resource requirements
3. Agree on next steps and owners

AGENDA:
09:00 - 09:15   Welcome & Objectives (Facilitator)
09:15 - 10:00   Current State Assessment (Present findings; Q&A)
10:00 - 10:15   Break
10:15 - 11:00   Priority Discussion (Breakout groups)
11:00 - 11:30   Group Report-Back & Alignment
11:30 - 11:50   Resource Discussion & Trade-offs
11:50 - 12:00   Next Steps & Close (Capture decisions)

PRE-WORK: Review attached analysis (15 min)
PARTICIPANTS: [List with roles]
Alignment Sessions
Key techniques for driving alignment:
| Technique | When to Use | How It Works |
|---|---|---|
| Dot voting | Prioritizing many options | Each person gets 3-5 dots to vote on preferences |
| 2x2 matrix | Evaluating trade-offs | Plot options on Impact vs Effort (or other criteria) |
| Round-robin | Ensuring all voices heard | Go around room; each person speaks in turn |
| Breakout groups | Parallel problem-solving | Small groups tackle different aspects; report back |
| "Fist of five" voting | Gauging support levels | 1-5 fingers indicate agreement level; address 1s and 2s |
Decision Capture
Always capture decisions and action items in real-time. Use this format:
Decision & Action Log
For each decision:
- Decision: What was decided (specific wording)
- Rationale: Why (brief)
- Owner: Who is accountable
- Timeline: When it will be done
Send summary within 24 hours. Silence = agreement.
6. Deliverables in Consulting
Understanding standard deliverable formats helps you communicate effectively with clients.
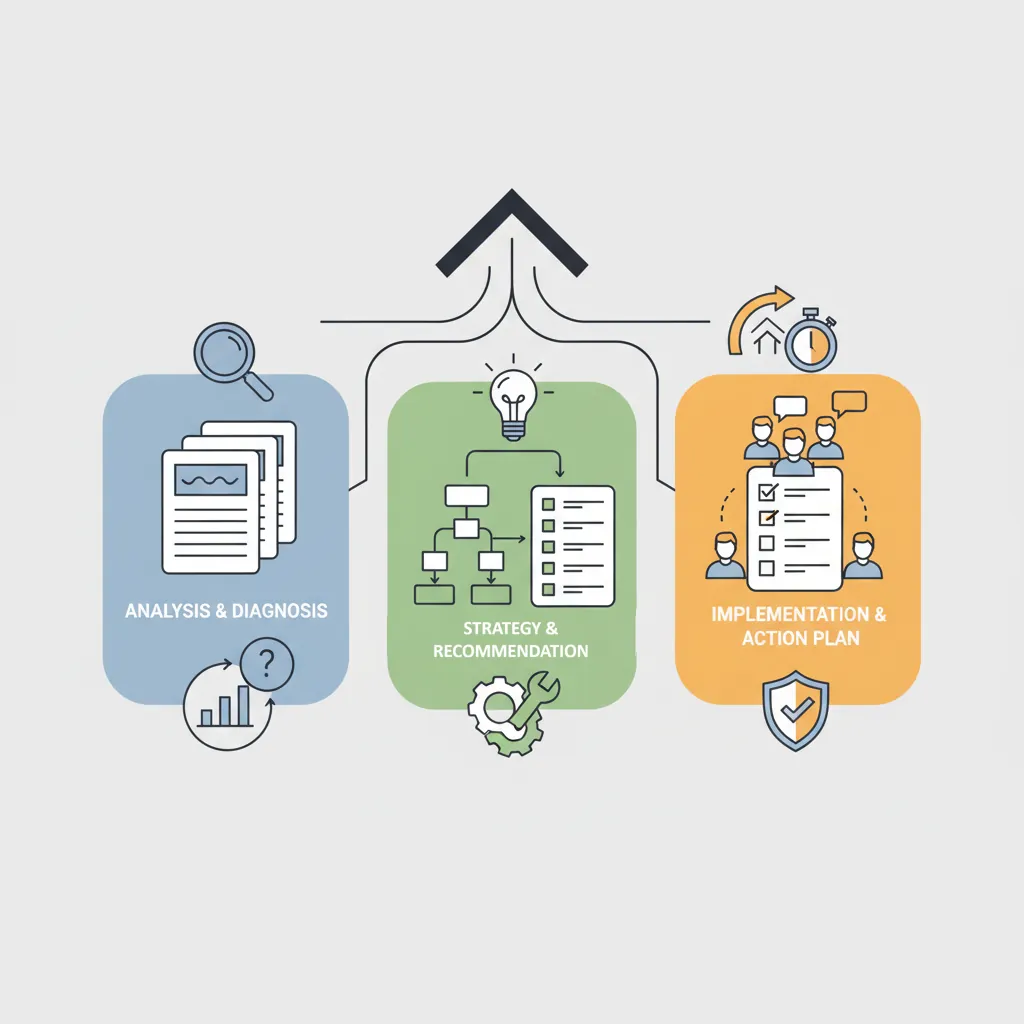
Executive Summary
The most critical pages—often the only ones executives read:
| Section | Content | Length |
|---|---|---|
| Context | Why we did this work; problem statement | 1-2 sentences |
| Key findings | Top 3-5 insights from analysis | Bullet points |
| Recommendation | What we recommend doing | Clear, specific statement |
| Expected impact | Quantified benefits; ROI | Key numbers |
| Next steps | Immediate actions; decisions needed | 3-5 items with owners |
Strategic Roadmap
A visual representation of initiatives over time:
Roadmap Structure
DIGITAL TRANSFORMATION ROADMAP

                    NOW → QUICK WINS      FOUNDATION         SCALE             OPTIMIZE
                         (0-3 months)     (3-6 months)       (6-12 months)     (12-18 months)
─────────────────────────────────────────────────────────────────────────────────────────────
CUSTOMER          │ Launch mobile app    │ Personalization   │ AI recommendations │
EXPERIENCE        │ Fix checkout flow    │ Omnichannel       │ Voice commerce     │
─────────────────────────────────────────────────────────────────────────────────────────────
OPERATIONS        │ Cloud migration      │ Automate back     │ Predictive         │
                  │ started              │ office            │ analytics          │
─────────────────────────────────────────────────────────────────────────────────────────────
TALENT &          │ Hire digital lead    │ Upskill sales     │ Data science       │
CULTURE           │                      │ teams             │ center of          │
                  │                      │                   │ excellence         │
─────────────────────────────────────────────────────────────────────────────────────────────
Key Milestones:   ★ App launch         ★ Platform go-live ★ Full rollout     ★ Target ROI
Business Case Model
Quantifies the financial impact of a recommendation:
| Component | What to Include |
|---|---|
| Investment required | CapEx, OpEx, one-time costs, ongoing costs |
| Benefits | Revenue increase, cost savings, risk reduction (quantified) |
| Timeline | When costs hit; when benefits realize; ramp-up period |
| ROI metrics | NPV, IRR, Payback period, Benefit-to-cost ratio |
| Sensitivity | What if assumptions are wrong? Best/base/worst cases |
Implementation Plan
Turns recommendations into action:
| Element | Description |
|---|---|
| Workstreams | Major areas of work (usually 3-7) |
| Milestones | Key checkpoints; phase gates; deliverables |
| Dependencies | What must happen before what; critical path |
| Resource requirements | People, budget, systems needed per phase |
| Risk mitigation | Key risks; mitigation strategies; contingencies |
| Governance | Steering committee, decision rights, escalation |
7. Driving Impact Beyond Slides
The ultimate measure of consulting success is impact achieved, not slides delivered.
Change Management Integration
Embed change management from day one:
- Communication plan: Who needs to know what, when, and how?
- Training plan: What skills do people need? When and how will they learn?
- Resistance plan: Who will resist? Why? How will you address it?
- Reinforcement: How will you make changes stick?
KPI Tracking
Define success metrics and track them:
KPI Dashboard Elements
- Leading indicators: Early warning signs (e.g., pipeline growth)
- Lagging indicators: Outcome measures (e.g., revenue achieved)
- Baseline: Where we started
- Target: Where we're aiming
- Actual: Where we are now
- Trend: Direction of movement
Continuous Improvement Loops
Build feedback mechanisms:
- Weekly check-ins: Track progress; identify blockers; adjust course
- Monthly reviews: Review KPIs; celebrate wins; course-correct
- Quarterly retrospectives: What's working? What isn't? What to change?
- Annual reset: Re-baseline; adjust targets; update strategy
8. Conclusion & Next Steps
You now have the communication and delivery toolkit:
- Communication standards: Clear, concise, confident, answer-first
- Pyramid Principle: Structure thinking for executives
- Storytelling: SCR framework, action titles, effective charts
- Stakeholder management: Influence mapping, difficult conversations
- Facilitation: Structured workshops, alignment techniques
- Deliverables: Executive summary, roadmap, business case, implementation plan
- Impact: Change management, KPIs, continuous improvement
Practice Exercise
Take a recent analysis or recommendation you made and restructure it using the Pyramid Principle:
- Write a single Governing Thought (the "so what")
- Identify 3 MECE supporting points
- List the evidence under each point
- Create an action title for each slide