Business Strategy
Structured Problem Solving
Hypothesis-driven thinking, problem structuring, root cause analysisMECE & Issue Trees
Mutually exclusive, collectively exhaustive, logic treesStrategy Frameworks
Porter's Five Forces, SWOT, BCG Matrix, value chainMcKinsey 7S & Organizational Analysis
Structure, strategy, systems, shared values, skillsFinancial Due Diligence
Financial statements, valuation, M&A analysis, modelingClient Communication & Delivery
Pyramid principle, slide design, stakeholder managementAdvanced Frameworks (Bonus)
Blue ocean, disruption theory, scenario planningCase Interview Master Pack (Bonus)
Market sizing, profitability, M&A, pricing casesConsultant Toolkit (Bonus)
Templates, checklists, presentation frameworksKey Insight
Strategy frameworks aren't just academic tools—they're battle-tested methods for analyzing competitive dynamics and making investment decisions. BCG Matrix helps prioritize portfolios, Porter's Five Forces reveals industry profitability, and SWOT connects internal capabilities to external opportunities.
1. Corporate Strategy Foundations
Before diving into specific frameworks, understand the fundamental questions of strategy. Roger Martin and A.G. Lafley's "Playing to Win" framework provides the essential questions every strategy must answer.

Where to Play
The first strategic choice: which markets, segments, and geographies to compete in. "Where to play" defines your playing field.
| Dimension | Questions to Answer | Examples |
|---|---|---|
| Geography | Which regions/countries? | US-only, North America, Global |
| Customer segments | Which types of buyers? | Enterprise, SMB, Consumer |
| Products/Services | What offerings? | Premium only, Full range, Niche |
| Channels | How to reach customers? | Direct, Partners, Digital |
| Value chain stage | Which activities to own? | Design only, Manufacturing, Full vertical |
How to Win
Once you've chosen where to play, define how you'll beat competitors in that arena. This is your competitive advantage.
Classic "How to Win" Choices
| Strategy | How You Win | Example Companies |
|---|---|---|
| Cost Leadership | Lowest cost producer; win on price | Walmart, IKEA, Ryanair |
| Differentiation | Superior features, brand, experience | Apple, BMW, Four Seasons |
| Focus/Niche | Serve a specific segment better than anyone | Porsche, Whole Foods |
| Customer Intimacy | Deep relationships, customization | Nordstrom, Home Depot |
Capabilities & Systems
Strategy only works if you build the capabilities and management systems to execute it. Without this, strategy is just a wish.
Capability Questions
- What must we be best at to win?
- What systems (processes, technology, metrics) support this?
- How do capabilities reinforce each other?
Example: IKEA's cost leadership requires capabilities in flat-pack design, efficient logistics, and large-format retail—all reinforcing each other.
2. BCG Growth-Share Matrix
Developed by Boston Consulting Group in the 1970s, the BCG Matrix helps companies prioritize investments across their business portfolio. It plots business units on two dimensions: market growth rate and relative market share.
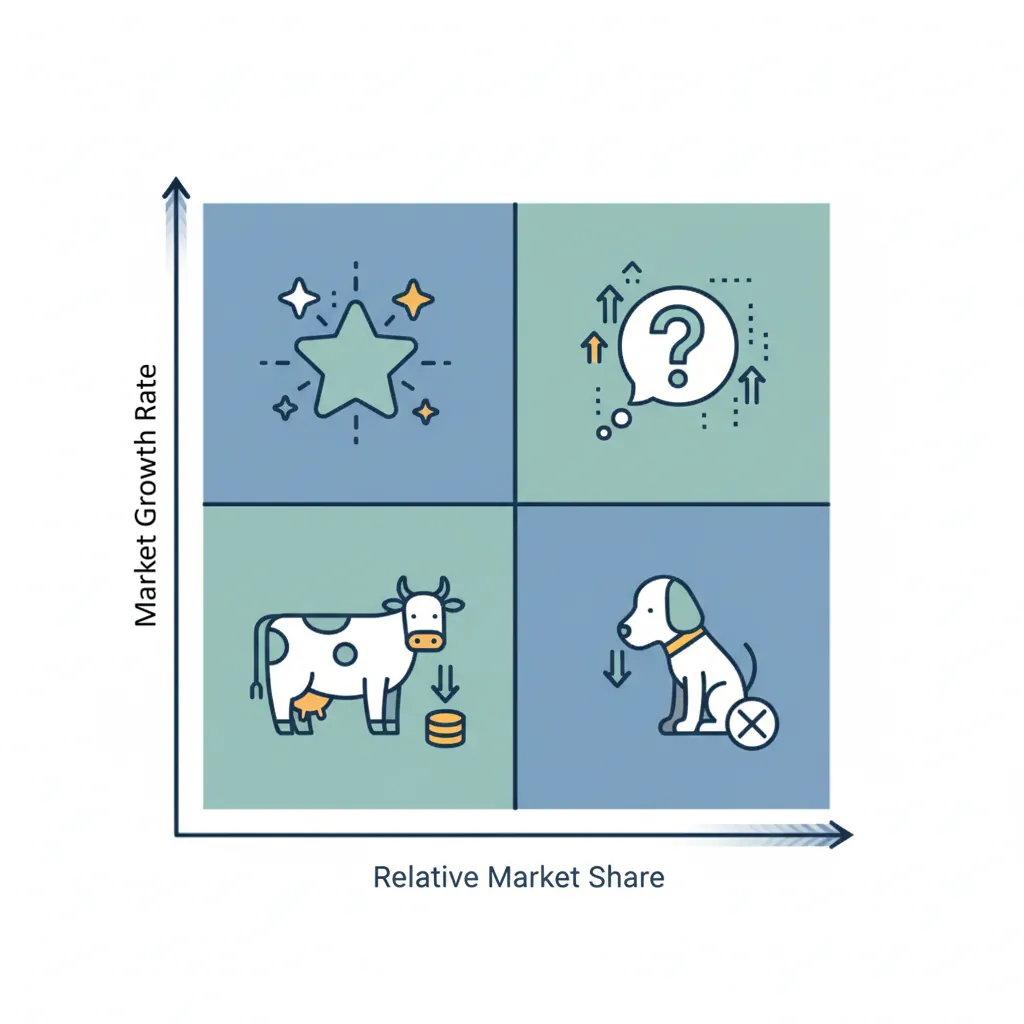
BCG Growth-Share Matrix
| High Market Share | Low Market Share | |
|---|---|---|
| High Market Growth | ⭐ Stars Invest to maintain leadership |
❓ Question Marks Invest selectively or exit |
| Low Market Growth | 🐄 Cash Cows Harvest for cash |
🐕 Dogs Divest or manage for cash |
Stars (High Growth, High Share)
Leaders in high-growth markets. They generate cash but also require significant investment to maintain position.
- Strategy: Invest heavily to maintain market leadership
- Cash position: Roughly break-even (high cash generation, high cash needs)
- Example: iPhone in 2010—growing rapidly, dominant share, requires massive R&D
Cash Cows (Low Growth, High Share)
Leaders in mature markets. They generate more cash than they need, funding other business units.
- Strategy: Harvest cash; invest only to maintain position
- Cash position: Strong positive cash flow
- Example: Microsoft Office—mature market, dominant share, throws off billions annually
Question Marks (High Growth, Low Share)
Followers in high-growth markets. Require investment to gain share but uncertain outcomes.
- Strategy: Invest selectively in winners; exit the rest
- Cash position: Cash consumers (need investment to compete)
- Example: A new SaaS product in a hot market—potential but unproven
Dogs (Low Growth, Low Share)
Weak positions in slow markets. Generally destroy value unless niche profitable.
- Strategy: Divest, harvest, or turnaround
- Cash position: Often cash traps
- Example: Declining product line in a commoditized market
BCG Matrix Limitations
- Oversimplifies: Only two dimensions; ignores synergies between units
- Market definition matters: Share depends on how you define the market
- Past-focused: Uses current data; doesn't predict future shifts
Classify your products/business units into Stars, Cash Cows, Question Marks, and Dogs. Download as Word, Excel, or PDF.
All data stays in your browser. Nothing is sent to or stored on any server.
3. GE/McKinsey Matrix
A more sophisticated alternative to BCG, the GE/McKinsey Matrix (also called the 9-Box Matrix) uses multiple factors to assess market attractiveness and competitive strength.
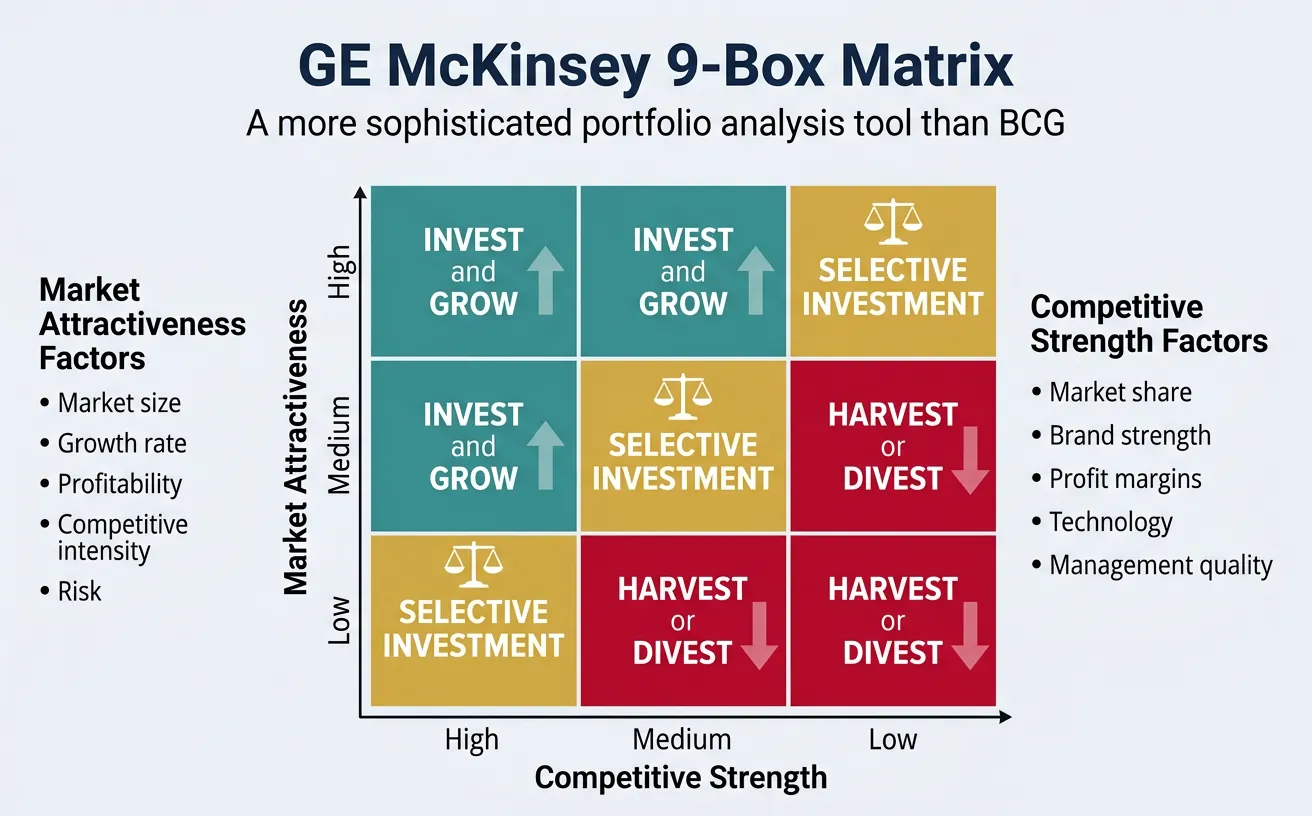
Market Attractiveness Factors
Rate each factor and create a weighted composite score:
| Factor | What to Assess | High Attractiveness |
|---|---|---|
| Market size | Total addressable market | Large market ($1B+) |
| Growth rate | Historical and projected growth | Double-digit growth |
| Profitability | Industry average margins | High margins (20%+ EBIT) |
| Competitive intensity | Number and strength of competitors | Fragmented, no dominant player |
| Cyclicality/Risk | Volatility, regulatory risk | Stable, low regulatory burden |
Competitive Strength Factors
| Factor | What to Assess | High Strength |
|---|---|---|
| Market share | Current position vs competitors | #1 or #2 position |
| Share trend | Gaining or losing share? | Gaining share |
| Brand strength | Recognition, loyalty, pricing power | Premium brand |
| Capability fit | Core competencies match market needs | Strong alignment |
| Profitability | Your margins vs industry | Above-average margins |
GE/McKinsey 9-Box Strategic Actions
| High Competitive Strength | Medium | Low | |
|---|---|---|---|
| High Attractiveness | Invest/Grow | Invest/Grow | Selective |
| Medium | Invest/Grow | Selective | Harvest/Divest |
| Low | Selective | Harvest/Divest | Harvest/Divest |
4. Porter's Core Strategy Frameworks
Michael Porter's frameworks remain foundational in strategic analysis. His Five Forces model analyzes industry structure; Generic Strategies define competitive positioning.
Five Forces Analysis
The Five Forces model explains why some industries are more profitable than others. Strong forces = lower industry profits.
Porter's Five Forces
| Force | What Drives It | High Threat Indicators |
|---|---|---|
| 1. Rivalry | Competition among existing firms | Many equal competitors, slow growth, high fixed costs, low differentiation |
| 2. New Entrants | Threat of new competitors entering | Low barriers (capital, regulation), weak brand loyalty, easy distribution |
| 3. Substitutes | Alternative products/services | Attractive price-performance ratio, low switching costs |
| 4. Buyer Power | Bargaining power of customers | Concentrated buyers, standardized products, price sensitivity |
| 5. Supplier Power | Bargaining power of suppliers | Few suppliers, unique inputs, high switching costs |
Five Forces Application
Airlines industry: High rivalry (many carriers), low entry barriers (lease planes), strong substitutes (trains, video calls), powerful buyers (price-sensitive consumers), powerful suppliers (Boeing/Airbus duopoly). Result: Chronically low industry profitability.
Enterprise software: Moderate rivalry, high entry barriers (R&D), weak substitutes, fragmented buyers, low supplier power. Result: Consistently high profitability.
Generic Strategies
Porter's Generic Strategies describe three fundamental ways to compete:
| Strategy | Definition | Key Requirements | Risks |
|---|---|---|---|
| Cost Leadership | Lowest cost producer in the industry | Scale, efficiency, tight cost control | Tech change, imitation, neglecting quality |
| Differentiation | Unique offering valued by customers | R&D, marketing, quality, innovation | Imitation, basis of differentiation erodes |
| Focus | Serve a narrow segment exceptionally well | Deep segment understanding | Segment shrinks, broad competitors enter |
The "Stuck in the Middle" Trap
Porter warns against pursuing multiple strategies simultaneously. Companies that try to be both low-cost AND differentiated often fail at both. Choose and commit.
Analyze the competitive dynamics of any industry. Rate each force and download your analysis as Word, Excel, or PDF.
All data stays in your browser. Nothing is sent to or stored on any server.
5. SWOT Analysis (Correct Usage)
SWOT (Strengths, Weaknesses, Opportunities, Threats) is the most widely used—and misused—strategy framework. Done correctly, it connects internal capabilities to external conditions.
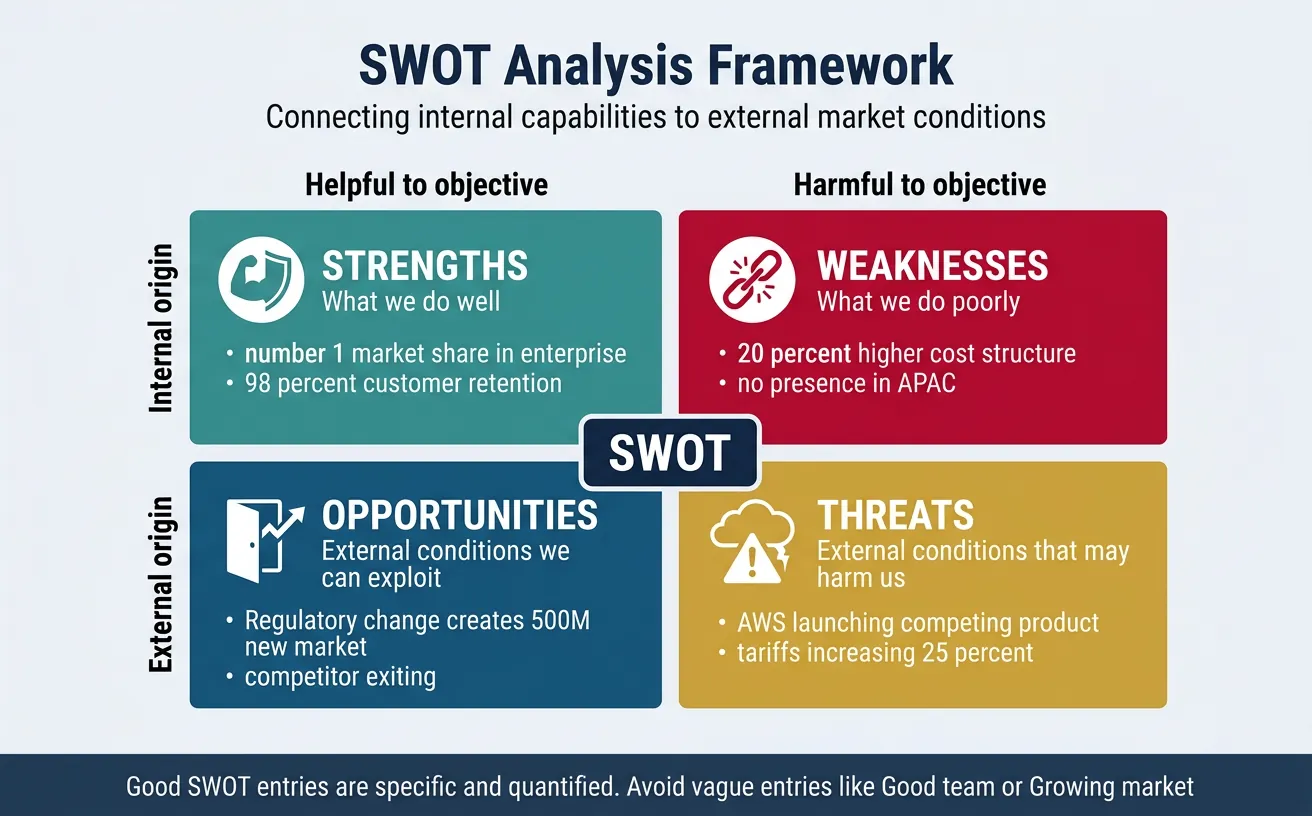
SWOT Components
SWOT Framework
| Helpful (to objective) | Harmful (to objective) | |
|---|---|---|
| Internal | Strengths What we do well |
Weaknesses What we do poorly |
| External | Opportunities External conditions we can exploit |
Threats External conditions that may harm us |
| Component | Good Examples | Poor Examples (Too Vague) |
|---|---|---|
| Strength | #1 market share in enterprise; 98% customer retention | "Good team", "Strong brand" |
| Weakness | 20% higher cost structure than competitors; no presence in APAC | "Need improvement", "Could be better" |
| Opportunity | Regulatory change creates $500M new market; competitor exiting | "Growing market", "Technology trends" |
| Threat | AWS launching competing product; tariffs increasing 25% | "Competition", "Economic uncertainty" |
Linking SWOT to Action
The power of SWOT comes from cross-matching quadrants to generate strategic options:
| Combination | Strategic Question | Example Action |
|---|---|---|
| S + O | How can we use strengths to capture opportunities? | Leverage brand strength to expand into adjacent market |
| W + O | Can we fix weaknesses to capture opportunities? | Acquire capabilities to enter new market |
| S + T | Can our strengths neutralize threats? | Use cost advantage to outlast price war |
| W + T | Are weaknesses exposed to threats? (Danger zone) | Exit market or divest before loss deepens |
6. Market Entry Framework
Entering a new market—whether geographic, product, or customer segment—is a common consulting case. Use this structured approach.
Market Size & Growth (TAM/SAM/SOM)
| Metric | Definition | Example (E-bikes in US) |
|---|---|---|
| TAM (Total Addressable Market) | Total market demand if 100% captured | $5B (all bike sales in US) |
| SAM (Serviceable Addressable Market) | Portion of TAM we can realistically target | $1.5B (e-bike segment only) |
| SOM (Serviceable Obtainable Market) | Realistic share we can capture | $150M (10% share target) |
Market Sizing Methods
- Top-down: Start with total market, narrow down (Industry reports → Segment → Geography → Target share)
- Bottom-up: Build from unit economics (# customers × average deal size × purchase frequency)
- Triangulation: Use both methods to validate
Entry Modes
| Mode | Speed | Investment | Control | Risk | Best When |
|---|---|---|---|---|---|
| Organic (Build) | Slow | Low | High | Low | Strong capabilities; time available |
| Acquisition (Buy) | Fast | High | High | High | Speed critical; targets available |
| Partnership/JV | Medium | Medium | Shared | Medium | Local expertise needed; regulated markets |
| Licensing/Franchise | Fast | Low | Low | Low | Asset-light scaling; brand monetization |
Evaluate a new market opportunity with attractiveness, competition, and go/no-go analysis. Download as Word, Excel, or PDF.
All data stays in your browser. Nothing is sent to or stored on any server.
7. Growth Strategy Frameworks
Ansoff Matrix
Igor Ansoff's matrix maps four growth strategies based on product and market newness:
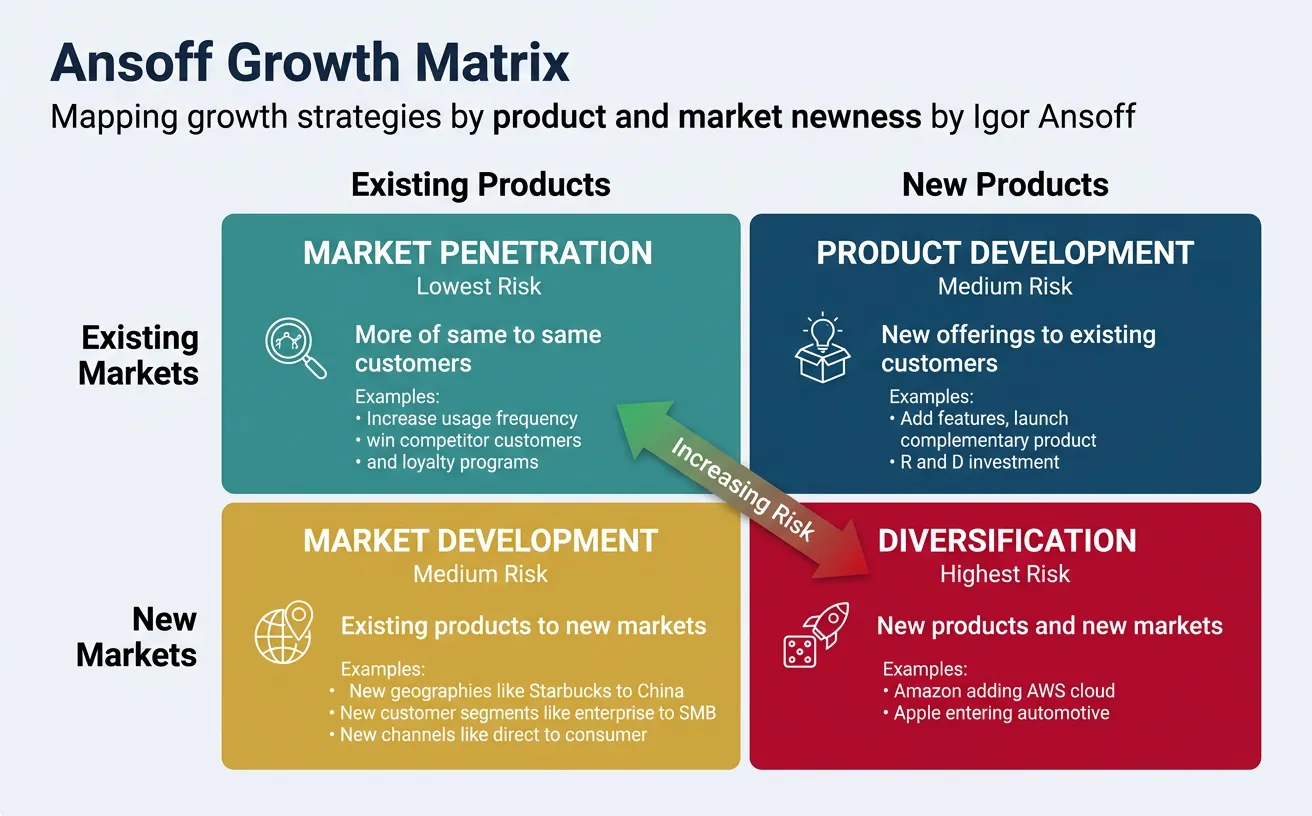
Ansoff Growth Matrix
| Existing Products | New Products | |
|---|---|---|
| Existing Markets | Market Penetration Lowest risk More of same to same |
Product Development Medium risk New offerings to existing |
| New Markets | Market Development Medium risk Existing products, new markets |
Diversification Highest risk New products, new markets |
Adjacent Expansion
Chris Zook's research shows that adjacent moves—expanding into related areas—have higher success rates than distant diversification.
| Adjacency Type | Description | Example |
|---|---|---|
| Geographic | Same product, new geography | Starbucks expanding from US to China |
| Customer segment | Same product, different customers | Enterprise software company targeting SMBs |
| Product/Service | New offering to same customers | Amazon adding AWS cloud to e-commerce |
| Value chain | Vertical integration | Netflix producing original content |
| Channel | New route to market | Nike opening direct-to-consumer stores |
M&A Growth
Acquisition is the fastest but riskiest growth path. Key evaluation criteria:
| Criterion | Questions |
|---|---|
| Strategic fit | Does this support our strategy? Fill a capability gap? |
| Synergies | Revenue synergies? Cost synergies? Are they realistic? |
| Valuation | Is the price justified? What's the standalone vs combined value? |
| Integration | Can we integrate successfully? Cultural fit? Systems compatibility? |
| Risk | What can go wrong? Key person risk? Customer concentration? |
M&A Reality Check
Studies consistently show that 50-70% of acquisitions fail to create value for the acquirer. The most common reasons: overpaying, overestimating synergies, and underestimating integration challenges.
8. Conclusion & Next Steps
You now have the core strategy frameworks in your toolkit:
- Where to Play / How to Win: The fundamental strategy questions
- BCG and GE/McKinsey Matrices: Portfolio prioritization
- Porter's Five Forces & Generic Strategies: Industry and competitive analysis
- SWOT: Connecting internal capabilities to external conditions
- Market Entry & Growth: Expansion frameworks
Practice Exercise
Choose a company you know well (your employer, a favorite brand, or a public company). Apply:
- Five Forces analysis to its industry
- SWOT analysis with specific, measurable items
- Ansoff matrix to identify its recent growth moves