Business Strategy
Structured Problem Solving
Hypothesis-driven thinking, problem structuring, root cause analysisMECE & Issue Trees
Mutually exclusive, collectively exhaustive, logic treesStrategy Frameworks
Porter's Five Forces, SWOT, BCG Matrix, value chainMcKinsey 7S & Organizational Analysis
Structure, strategy, systems, shared values, skillsFinancial Due Diligence
Financial statements, valuation, M&A analysis, modelingClient Communication & Delivery
Pyramid principle, slide design, stakeholder managementAdvanced Frameworks (Bonus)
Blue ocean, disruption theory, scenario planningCase Interview Master Pack (Bonus)
Market sizing, profitability, M&A, pricing casesConsultant Toolkit
Templates, checklists, presentation frameworksKey Insight
Frameworks and strategy are only as good as your ability to execute. Excel skills enable rapid financial analysis, PowerPoint mastery brings ideas to life, SQL basics unlock data insights, and project management keeps everything on track. These tools separate good consultants from great ones.
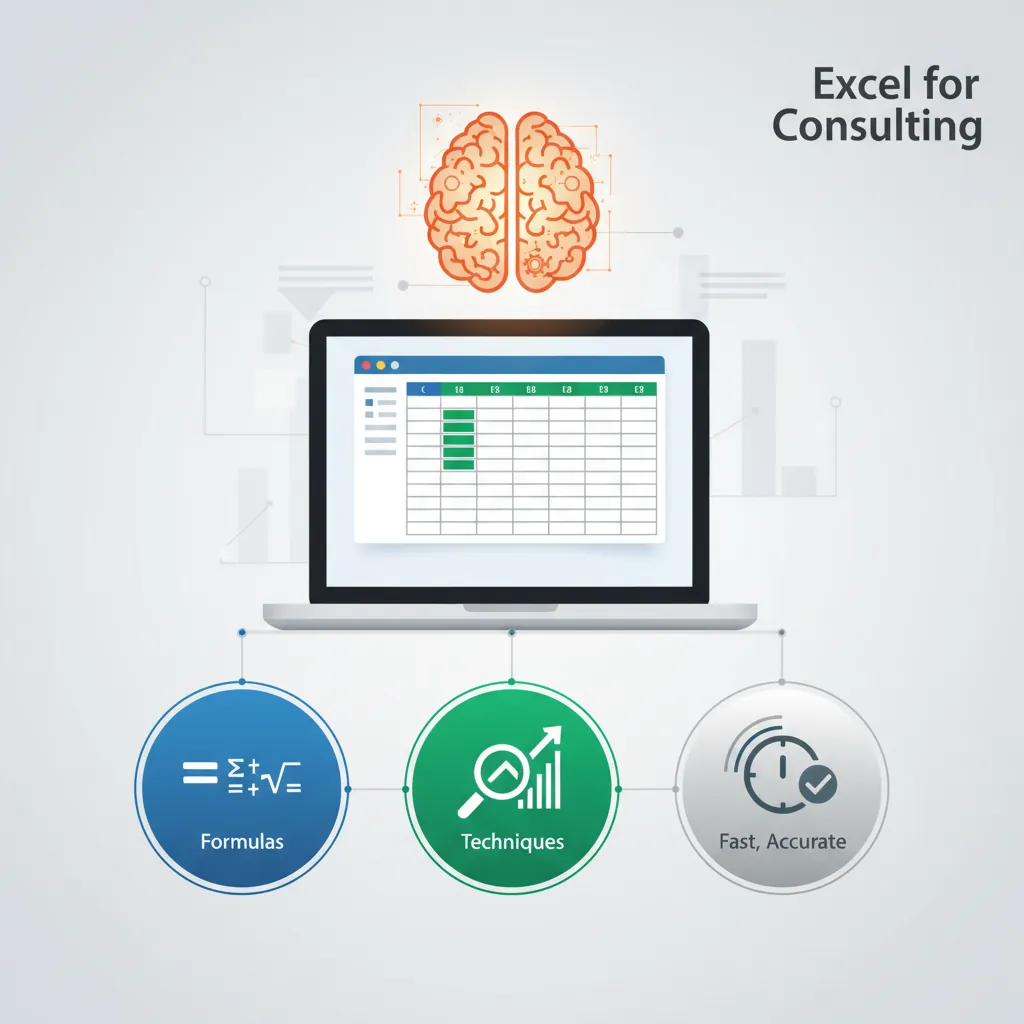
1. Excel for Consulting
Excel is the workhorse of consulting analysis. Speed and accuracy in Excel directly impact your productivity and credibility.
Essential Formulas
| Formula | Use Case | Example |
|---|---|---|
SUMIF / SUMIFS |
Conditional totals | =SUMIFS(Revenue, Region, "East", Year, 2024) |
VLOOKUP / XLOOKUP |
Data matching | =XLOOKUP(A2, IDs, Prices, "Not Found") |
INDEX-MATCH |
Flexible lookups | =INDEX(Prices, MATCH(A2, IDs, 0)) |
COUNTIF / COUNTIFS |
Conditional counting | =COUNTIFS(Status, "Complete", Priority, "High") |
IF / IFS / SWITCH |
Conditional logic | =IF(Score>=90, "A", IF(Score>=80, "B", "C")) |
TEXT |
Number formatting | =TEXT(Value, "$#,##0") |
Pivot Tables
Pivot tables are essential for rapid data exploration:
- Rows: Categories you want to group by (e.g., Region, Product)
- Columns: Secondary breakdown (e.g., Year, Quarter)
- Values: Metrics to aggregate (Sum, Count, Average)
- Filters: Slice data to specific subsets
Pivot Table Best Practices
- Always use Tables (Ctrl+T) as source data for auto-updating ranges
- Use Slicers for interactive filtering
- Right-click → Show Field List to customize layout
- Use Calculated Fields for derived metrics
Financial Modeling Basics
Key principles for robust financial models:
Model Structure
STANDARD MODEL LAYOUT
─────────────────────────────────────────────────────
TAB 1: ASSUMPTIONS
       All inputs in ONE place (blue cells)
       Scenarios: Base, Upside, Downside

TAB 2: CALCULATIONS
       Revenue build-up
       Cost build-up
       Working capital
       CapEx

TAB 3: OUTPUTS
       Income Statement
       Balance Sheet
       Cash Flow Statement

TAB 4: ANALYSIS
       DCF Valuation
       Sensitivity tables
       Charts
- Hardcodes in blue: All inputs should be clearly identifiable
- Formulas in black: All calculated cells use formulas
- Links in green: References to other sheets are highlighted
- No circular references: Use iterative calculations sparingly
- Error checks: Add balance checks (Assets = Liabilities + Equity)
Keyboard Shortcuts
| Shortcut | Action |
|---|---|
| Ctrl + Shift + L | Toggle filters |
| Ctrl + T | Create table |
| Ctrl + ; | Insert current date |
| F4 | Toggle absolute/relative reference |
| Ctrl + ` | Show formulas |
| Alt + = | Auto-sum |
| Ctrl + Shift + + | Insert row/column |
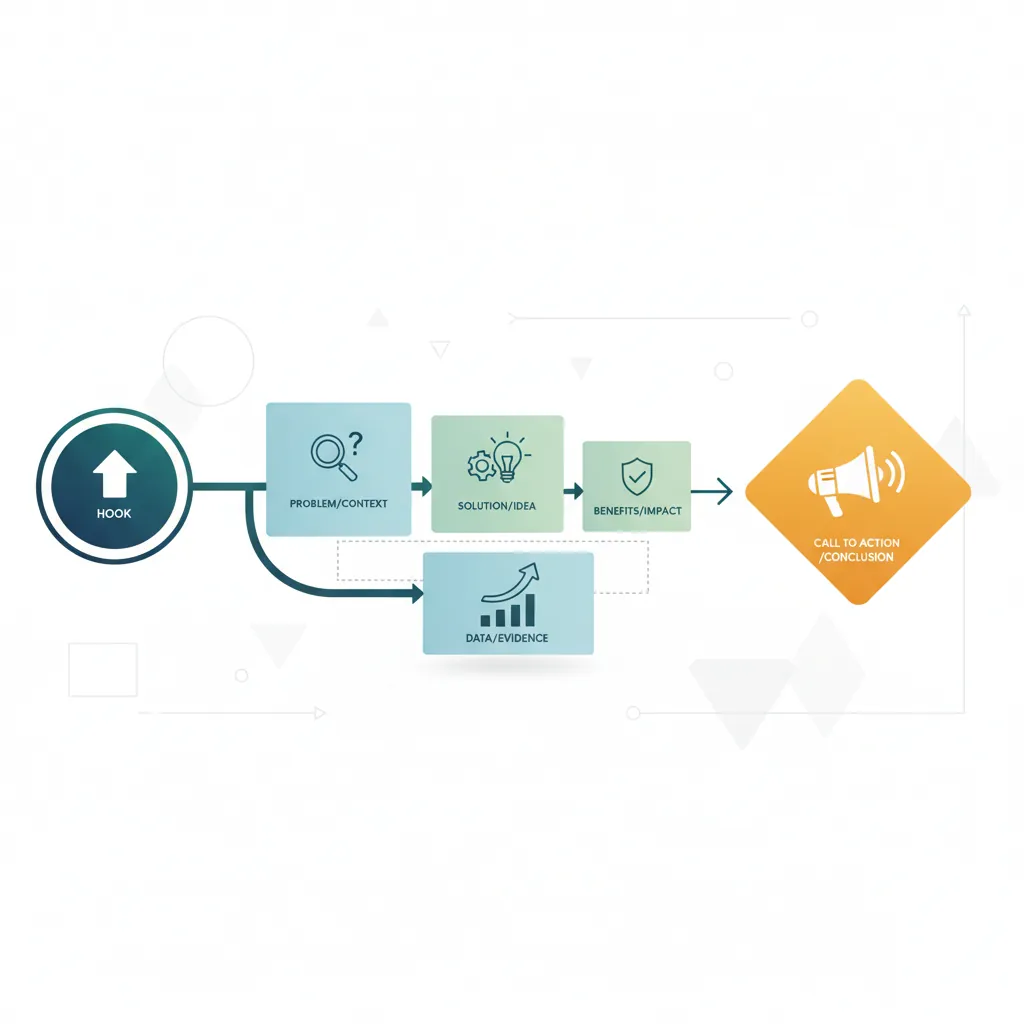
2. PowerPoint Best Practices
In consulting, PowerPoint is how ideas become reality. Your slides should tell a story, not just display data.
Slide Structure
Consulting Slide Anatomy
┌─────────────────────────────────────────────────────────────┐
│ ACTION TITLE (Complete sentence with the "so what")         │
├─────────────────────────────────────────────────────────────┤
│                                                             │
│   ┌─────────────────────────────────────────────────────┐   │
│   │                                                     │   │
│   │               BODY CONTENT                          │   │
│   │           (Charts, tables, text)                    │   │
│   │                                                     │   │
│   │   Key insight: Use visual hierarchy               │   │
│   │   - Most important information largest/top         │   │
│   │   - Supporting details smaller/below               │   │
│   │                                                     │   │
│   └─────────────────────────────────────────────────────┘   │
│                                                             │
├─────────────────────────────────────────────────────────────┤
│ Source: Company data; Client interviews (n=25); 2024       │
└─────────────────────────────────────────────────────────────┘
Common Mistakes
- Topic titles: "Revenue Analysis" → "Revenue declined 15% due to pricing pressure"
- Too much text: If they can read it, they don't need you to present
- Inconsistent formatting: Use master slides; align everything
Chart Selection
| Data Type | Best Chart | When to Use |
|---|---|---|
| Comparison | Bar chart (horizontal) | Comparing categories or rankings |
| Trend over time | Line chart | Showing change over periods |
| Part of whole | Stacked bar / waterfall | Showing composition (avoid pie charts) |
| Distribution | Histogram / Box plot | Showing spread of values |
| Relationship | Scatter plot | Showing correlation between variables |
| Process / flow | Waterfall / Sankey | Showing buildup or flow |
Formatting Standards
- Fonts: Sans-serif (Arial, Calibri); 24pt titles, 14-18pt body
- Colors: Limit to 3-4 colors; use firm brand palette
- Alignment: Use guides; align everything to a grid
- White space: Don't fill every inch; let content breathe
Consulting Templates
Common slide types in consulting decks:
- Agenda slide: Overview of presentation structure
- Executive summary: Key findings and recommendations upfront
- Data slide: Chart with action title and source
- Framework slide: Visual 2x2 or process diagram
- Recommendation slide: Clear action items with owners and timelines
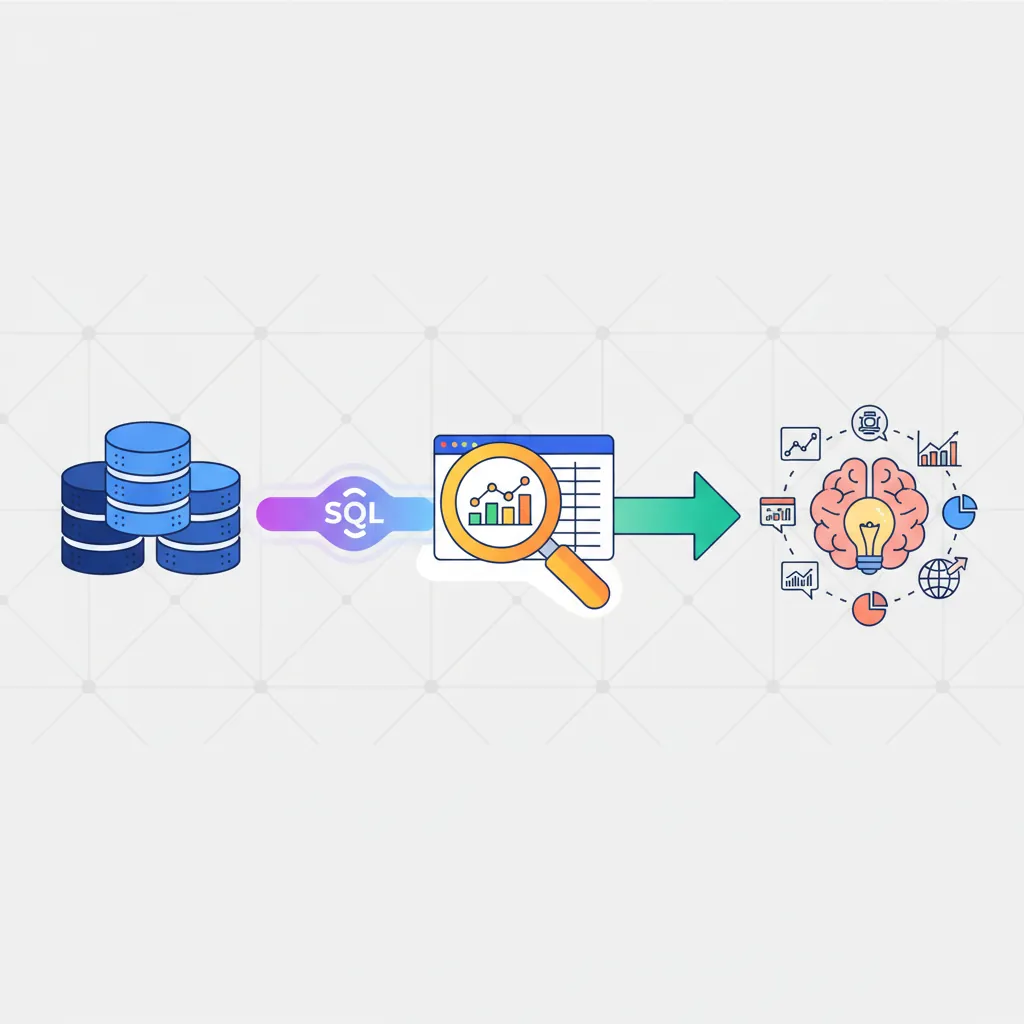
3. SQL Basics for Consultants
SQL lets you extract insights directly from databases. Even basic SQL dramatically expands what you can analyze independently.
SELECT Queries
Basic Query Structure
SELECT column1, column2        -- What columns to retrieve
FROM table_name                -- Which table to query
WHERE condition                -- Filter rows
ORDER BY column1 DESC          -- Sort results
LIMIT 100;                     -- Limit number of rows

-- Example: Get top 10 customers by revenue
SELECT
    customer_name,
    SUM(order_total) AS total_revenue
FROM orders
WHERE order_date >= '2024-01-01'
GROUP BY customer_name
ORDER BY total_revenue DESC
LIMIT 10;
JOINs & Relationships
JOINs combine data from multiple tables:
| JOIN Type | Returns | Use Case |
|---|---|---|
INNER JOIN |
Only matching rows in both tables | Link orders to customers |
LEFT JOIN |
All rows from left table + matches from right | Find customers with no orders |
RIGHT JOIN |
All rows from right table + matches from left | Less common; use LEFT JOIN instead |
FULL OUTER JOIN |
All rows from both tables | Data reconciliation |
Aggregations & GROUP BY
Aggregation Functions
-- Count, Sum, Average, Min, Max
SELECT
    region,
    COUNT(*) AS num_orders,
    SUM(revenue) AS total_revenue,
    AVG(revenue) AS avg_order_value,
    MIN(order_date) AS first_order,
    MAX(order_date) AS last_order
FROM orders
GROUP BY region
HAVING SUM(revenue) > 100000   -- Filter AFTER grouping
ORDER BY total_revenue DESC;
Practical Examples
Common Consulting Queries
- Revenue by segment: GROUP BY product_category, customer_segment
- Customer cohort analysis: GROUP BY signup_month, calculate retention
- Year-over-year comparison: Use window functions or self-join
- Top N analysis: ORDER BY + LIMIT or ROW_NUMBER()
4. Project Management Basics
Consulting projects have fixed timelines and deliverables. Structured project management keeps everything on track.
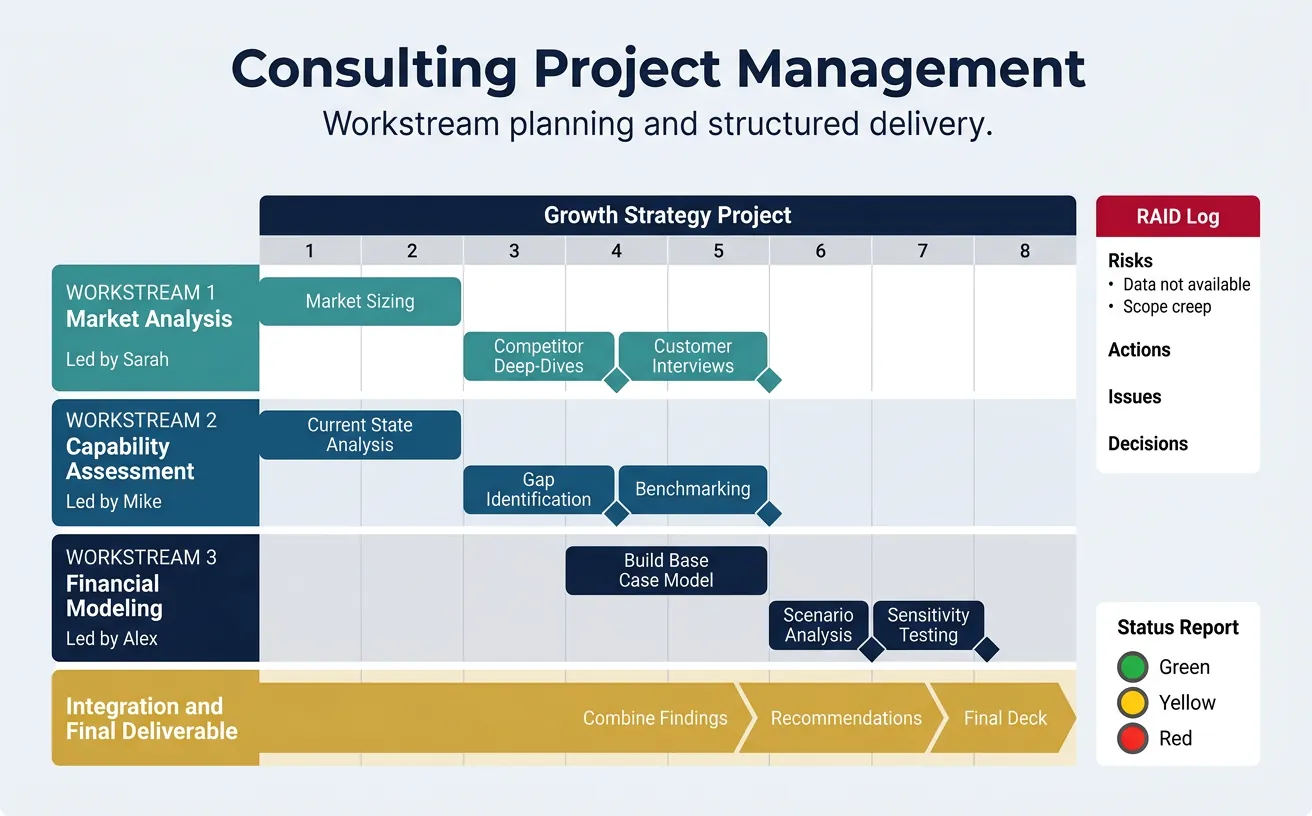
Workstream Planning
Break projects into parallel workstreams:
Example Workstream Structure
GROWTH STRATEGY PROJECT (8 weeks)
─────────────────────────────────────────────────────
Workstream 1: Market Analysis        [Lead: Sarah]
├── Week 1-2: Market sizing
├── Week 3-4: Competitor deep-dives
└── Week 5: Customer interviews

Workstream 2: Capability Assessment  [Lead: Mike]
├── Week 1-2: Current state analysis
├── Week 3-4: Gap identification
└── Week 5: Benchmarking

Workstream 3: Financial Modeling     [Lead: Alex]
├── Week 4-5: Build base case model
├── Week 6: Scenario analysis
└── Week 7: Sensitivity testing

Integration & Final Deliverable      [Week 6-8]
└── Combine findings → Recommendations → Final deck
Gantt Charts & Timelines
Gantt charts visualize tasks against time:
- Tasks: Break down into 1-3 day activities
- Dependencies: What must complete before next task starts?
- Critical path: The longest chain; delays here delay the project
- Milestones: Key check-in points and deliverables
Risk Management
| Risk | Likelihood | Impact | Mitigation |
|---|---|---|---|
| Data not available | Medium | High | Identify proxy metrics; request data early |
| Key stakeholder unavailable | Low | Medium | Schedule interviews Week 1; have backups |
| Scope creep | High | High | Document scope; change control process |
Status Reporting
Weekly status reports should include:
- Summary: Overall project health (Green/Yellow/Red)
- Accomplishments: What was completed this week
- Next steps: What's planned for next week
- Risks/Issues: What might derail progress
- Decisions needed: What do you need from the client/leadership
5. Productivity Tips
Consulting hours are long. Working smarter—not just harder—separates top performers.

Time Management
- Time-box analysis: Set deadlines for "good enough" answers
- 80/20 ruthlessly: Which 20% of work drives 80% of value?
- Batch similar tasks: Do all data pulls together; all formatting together
- Protect focus time: Block calendar for deep work
Email Best Practices
BLUF Email Structure
Bottom Line Up Front:
- Subject line: [Action Required] / [FYI] / [Decision Needed]
- First sentence: State the ask or key message
- Supporting details: Context and rationale
- Next steps: Clear action items with deadlines
Meeting Efficiency
- Send agenda in advance: Include objectives and pre-read
- Start on time: Respect everyone's calendar
- Assign a note-taker: Capture decisions and action items
- End with next steps: Who does what by when?
- Send follow-up: Email summary within 24 hours
6. Series Conclusion
Congratulations on completing the Complete Consulting Frameworks Series! You now have a comprehensive toolkit that covers:
Your Consulting Toolkit Summary
- Part 1: Structured problem solving, hypothesis-driven thinking, 80/20
- Part 2: MECE frameworks, issue trees, root cause analysis
- Part 3: Strategy frameworks (Porter's, BCG, SWOT, M&A)
- Part 4: Organizational analysis (7S, Operating Models, Change)
- Part 5: Financial due diligence, valuation, investor thinking
- Part 6: Client communication, Pyramid Principle, deliverables
- Part 7: Advanced frameworks (Value Chain, Blue Ocean, JTBD, OKRs)
- Part 8: Case interview prep for profitability, M&A, pricing, operations
- Part 9: Essential tools—Excel, PowerPoint, SQL, project management
Your Path Forward
Knowledge becomes skill through application. Here's how to develop mastery:
- Practice cases: Do 50+ case interviews before recruiting
- Apply frameworks: Use them in your current work
- Build Excel models: Model real business scenarios
- Create slides: Turn every analysis into a presentation
- Teach others: Explaining reinforces understanding
Congratulations!
You've completed the Complete Consulting Frameworks Series! You now have a comprehensive toolkit covering structured problem solving, MECE thinking, strategy frameworks, organizational analysis, financial due diligence, client communication, advanced frameworks, case interview prep, and essential consulting tools. Apply these frameworks in your work and continue practicing to develop mastery.