Business Strategy
Structured Problem Solving
Hypothesis-driven thinking, problem structuring, root cause analysisMECE & Issue Trees
Mutually exclusive, collectively exhaustive, logic treesStrategy Frameworks
Porter's Five Forces, SWOT, BCG Matrix, value chainMcKinsey 7S & Organizational Analysis
Structure, strategy, systems, shared values, skillsFinancial Due Diligence
Financial statements, valuation, M&A analysis, modelingClient Communication & Delivery
Pyramid principle, slide design, stakeholder managementAdvanced Frameworks (Bonus)
Blue ocean, disruption theory, scenario planningCase Interview Master Pack (Bonus)
Market sizing, profitability, M&A, pricing casesConsultant Toolkit (Bonus)
Templates, checklists, presentation frameworksKey Insight
Financial due diligence is the backbone of M&A, private equity, and strategic consulting. Understanding financial statements, profitability drivers, and valuation methods enables consultants to assess deal quality, identify red flags, and build compelling investment theses.
1. Financial Statement Mastery
Every consultant must read and interpret the three core financial statements. They tell different but interconnected stories about a business.
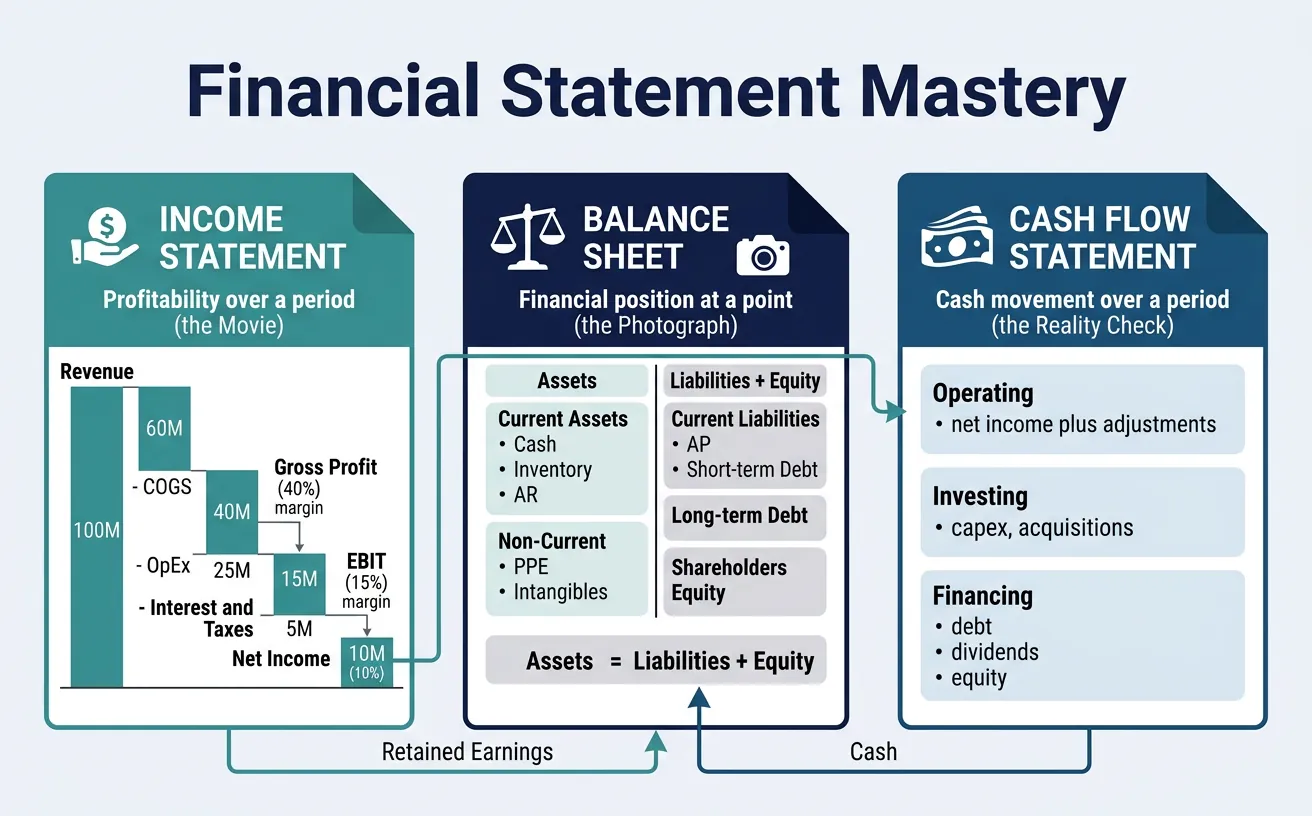
Income Statement (P&L)
Shows profitability over a period (quarter, year). Think of it as a movie—showing the flow of revenues and expenses.
Income Statement Structure
Revenue (Sales)                          $100M
 - Cost of Goods Sold (COGS)              -60M
 ─────────────────────────────────────────────
= Gross Profit                            $40M     (Gross Margin = 40%)

 - Operating Expenses (SG&A, R&D)         -25M
 ─────────────────────────────────────────────
= Operating Income (EBIT)                 $15M     (Operating Margin = 15%)

 - Interest Expense                        -2M
 - Taxes                                   -3M
 ─────────────────────────────────────────────
= Net Income                              $10M     (Net Margin = 10%)
Balance Sheet
Shows financial position at a point in time. Think of it as a photograph—a snapshot of what the company owns and owes.
| Assets (What you own) | Liabilities + Equity (What you owe) |
|---|---|
|
Current Assets Cash, Inventory, Accounts Receivable Non-Current Assets Property, Plant, Equipment (PP&E), Intangibles |
Current Liabilities Accounts Payable, Short-term Debt Long-term Liabilities Long-term Debt, Deferred Tax Shareholders' Equity Common Stock, Retained Earnings |
| Assets = Liabilities + Equity (The fundamental equation) | |
Cash Flow Statement
Shows cash movement over a period. Critical insight: Profit ≠ Cash. A company can be profitable but cash-poor.
| Section | What It Shows | Key Items |
|---|---|---|
| Operating (CFO) | Cash from core business | Net income + depreciation ± working capital changes |
| Investing (CFI) | Cash from buying/selling assets | CapEx, acquisitions, asset sales |
| Financing (CFF) | Cash from debt/equity activities | Debt issuance/repayment, dividends, stock buybacks |
The Cash Flow Warning
Free Cash Flow (FCF) = Operating Cash Flow - CapEx
This is the cash truly available to shareholders after maintaining the business. Companies can manipulate earnings, but cash doesn't lie.
2. Profitability Analysis
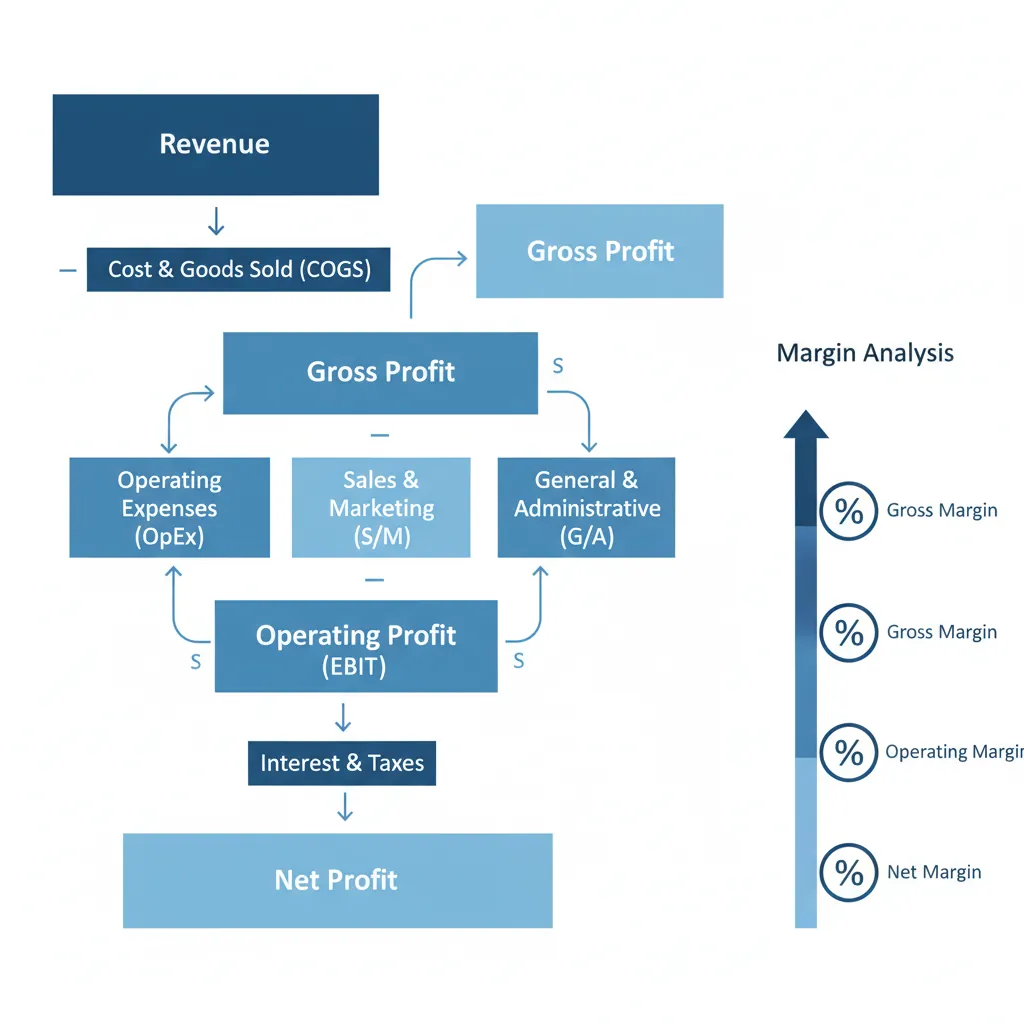
Margin Analysis
Margins reveal efficiency at each level of the P&L:
| Margin | Formula | What It Tells You | Typical Range |
|---|---|---|---|
| Gross Margin | (Revenue - COGS) / Revenue | Product/service profitability; pricing power | 20-80% (varies by industry) |
| Operating Margin | Operating Income / Revenue | Core business efficiency | 10-25% for healthy businesses |
| EBITDA Margin | EBITDA / Revenue | Cash-generating ability | 15-35% is strong |
| Net Margin | Net Income / Revenue | Bottom-line profitability | 5-20% (after all costs) |
EBITDA & Operating Leverage
EBITDA (Earnings Before Interest, Taxes, Depreciation, Amortization) is the most common metric in consulting and PE:
EBITDA Calculation
Net Income                   $10M
 + Interest Expense           +2M
 + Taxes                      +3M
 + Depreciation               +4M
 + Amortization               +1M
 ─────────────────────────────────
= EBITDA                     $20M
Operating Leverage
Operating leverage measures how much profit changes when revenue changes:
- High fixed costs: High operating leverage → Profits grow faster than revenue (but losses also accelerate)
- High variable costs: Low operating leverage → Profits grow proportionally to revenue
Example: A software company (90% gross margin) has high operating leverage; a staffing agency (15% gross margin) has low operating leverage.
Unit Economics
Unit economics answers: "Is the core business model profitable at the individual customer or transaction level?"
| Metric | Definition | Good Benchmark |
|---|---|---|
| CAC (Customer Acquisition Cost) | Total S&M spend / New customers acquired | Lower is better; depends on LTV |
| LTV (Lifetime Value) | Avg revenue per customer × Gross margin × Customer lifespan | Should be 3x+ CAC |
| LTV:CAC Ratio | LTV / CAC | >3:1 healthy; >5:1 excellent |
| Payback Period | CAC / Monthly gross profit per customer | <12 months for SaaS; <18 months acceptable |
3. Revenue Quality Assessment
Not all revenue is equal. High-quality revenue is predictable, sticky, and growing.
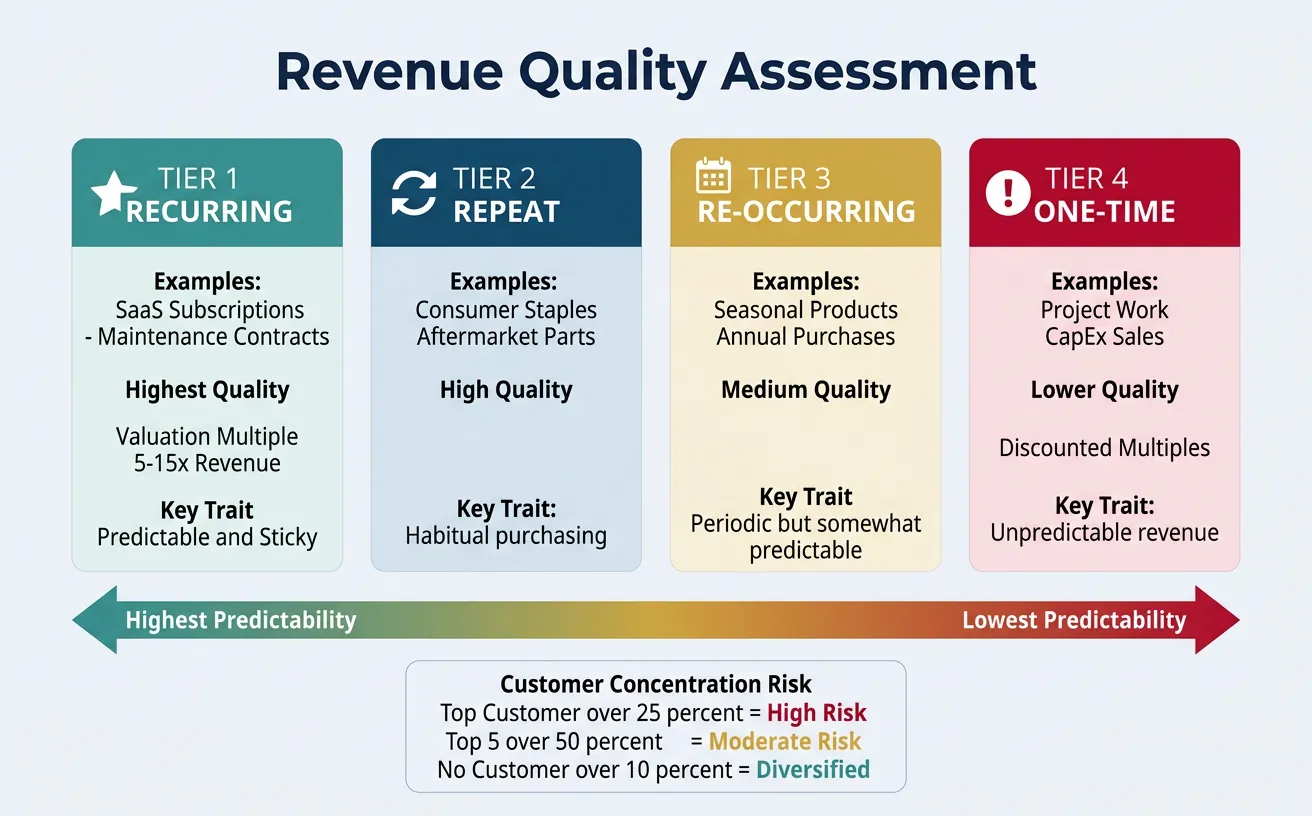
Recurring vs One-Time Revenue
| Revenue Type | Examples | Quality | Valuation Impact |
|---|---|---|---|
| Recurring | SaaS subscriptions, maintenance contracts | Highest | Premium multiples (5-15x revenue) |
| Repeat | Consumer staples, aftermarket parts | High | Strong multiples |
| Re-occurring | Seasonal products, annual purchases | Medium | Moderate multiples |
| One-time | Project work, capex sales | Lower | Discounted multiples |
Customer Concentration Risk
Customer concentration is a major risk factor in due diligence:
| Concentration Level | Assessment | DD Action |
|---|---|---|
| Top customer >25% of revenue | High risk | Interview customer; understand contract; assess switching costs |
| Top 5 customers >50% | Moderate risk | Review contract terms; renewal rates; diversification plan |
| No customer >10% | Diversified | Positive factor; validate data accuracy |
Pricing Power
Pricing power indicates competitive moat and margin sustainability:
- Strong pricing power: Can raise prices without losing customers (Apple, luxury brands)
- Weak pricing power: Must match competitors or lose share (commodities, undifferentiated products)
Pricing Power Assessment Questions
- Has the company raised prices in the last 3 years? By how much?
- What happened to volume after price increases?
- How do prices compare to competitors?
- What are customer switching costs?
4. Cost Structure Analysis
Fixed vs Variable Costs
| Cost Type | Definition | Examples | Strategic Implication |
|---|---|---|---|
| Fixed | Don't change with volume | Rent, salaries, depreciation | High fixed costs → need scale; risk in downturns |
| Variable | Change with volume | Raw materials, commissions, shipping | Flexible but limits margin expansion |
| Semi-variable | Step-function with volume | Warehouse staff, equipment | Capacity planning critical |
Cost Drivers
Understand what drives costs to identify improvement opportunities:
| Cost Category | Typical Drivers | Improvement Levers |
|---|---|---|
| Labor | Headcount, wage rates, productivity | Automation, offshoring, spans of control |
| Materials | Volume, commodity prices, supplier terms | Procurement optimization, substitution, renegotiation |
| Facilities | Square footage, location, utilization | Consolidation, sale-leaseback, remote work |
| Technology | Licenses, cloud costs, complexity | Rationalization, cloud optimization, vendor consolidation |
Benchmarking Opportunities
Compare cost metrics against industry benchmarks to identify improvement potential:
Common Benchmarking Metrics
- SG&A as % of revenue: 15-25% typical; higher indicates overhead bloat
- R&D as % of revenue: Varies widely (5% manufacturing, 15-25% tech)
- Revenue per employee: $200-400K typical; $500K+ for software
- IT spend as % of revenue: 3-6% typical; higher for tech-intensive industries
5. Business Valuation Basics
Valuation determines what a company is worth. Three primary methods are used, often in combination ("triangulation").
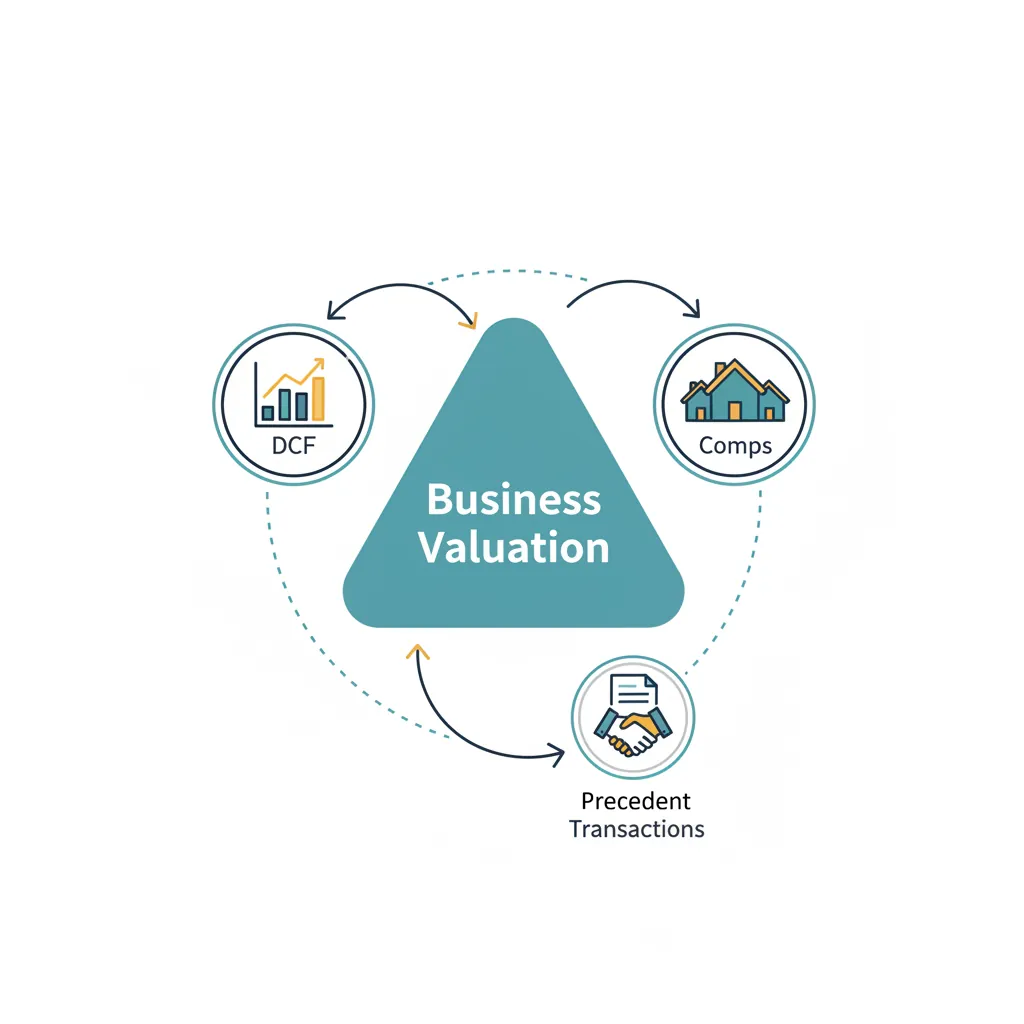
DCF Analysis (Discounted Cash Flow)
DCF values a company based on its future cash flows, discounted to present value. It's the most theoretically pure but most assumption-sensitive method.
DCF Formula
Enterprise Value = Σ [ FCF(t) / (1 + WACC)^t ] + Terminal Value / (1 + WACC)^n

Where:
  FCF(t)         = Free Cash Flow in year t
  WACC           = Weighted Average Cost of Capital (typically 8-12%)
  Terminal Value = FCF(n+1) / (WACC - g), where g = perpetual growth rate (2-3%)
| DCF Component | Key Assumptions | Sensitivity |
|---|---|---|
| Revenue growth | Based on market size, share, pricing | High impact |
| Margin expansion | Operating leverage, cost improvements | High impact |
| WACC | Risk profile, capital structure | ±1% WACC change = ±10-15% value change |
| Terminal growth rate | Perpetual growth (usually 2-3%) | ±0.5% change = ±5-10% value change |
Comparable Company Multiples
Values a company based on trading multiples of similar public companies.
| Multiple | Formula | When to Use | Typical Range |
|---|---|---|---|
| EV/Revenue | Enterprise Value / Revenue | High-growth, unprofitable companies | 1-10x (SaaS: 5-15x) |
| EV/EBITDA | Enterprise Value / EBITDA | Most common; mature businesses | 6-12x typical |
| P/E | Stock Price / Earnings Per Share | Public equity comparisons | 15-25x typical |
Precedent Transactions
Values a company based on multiples paid in recent M&A deals for similar companies.
Precedent Transaction Adjustments
- Control premium: Acquirers typically pay 20-40% premium over trading price
- Synergies: Strategic buyers pay more than financial buyers
- Market timing: Deals in hot markets command higher multiples
- Size: Larger deals often have slightly higher multiples
Build a discounted cash flow valuation model. Enter projected cash flows, discount rate, and terminal value assumptions. Download as Excel or PDF.
All data stays in your browser. Nothing is sent to or stored on any server.
6. Due Diligence Types
Comprehensive due diligence covers multiple workstreams, each answering different questions.
Commercial Due Diligence
Validates the market opportunity and competitive position.
| Focus Area | Key Questions |
|---|---|
| Market | What's the market size? Growth rate? Key trends? Disruption risks? |
| Competition | Who are competitors? What's the target's position? Sustainable advantages? |
| Customers | Who are key customers? Why do they buy? Churn risk? Concentration? |
| Growth plan | Is management's plan credible? What are the key assumptions? |
Financial Due Diligence
Validates the quality of earnings and financial projections.
| Focus Area | Key Questions |
|---|---|
| Quality of Earnings (QoE) | Are reported earnings sustainable? What adjustments are needed? |
| Working capital | What's the normalized working capital need? Trends? |
| Debt & liabilities | All debt identified? Contingent liabilities? Off-balance sheet items? |
| Financial projections | Are assumptions reasonable? Historical accuracy of management forecasts? |
Operational & Technology DD
| DD Type | Focus Areas |
|---|---|
| Operational DD | Manufacturing efficiency, supply chain, capacity, capex needs, operational improvements |
| Technology DD | Tech stack quality, technical debt, cybersecurity, scalability, IP ownership |
| HR DD | Key person risk, compensation, culture, retention risk, union issues |
| Legal DD | Contracts, litigation, IP, regulatory compliance, environmental |
Create a structured due diligence checklist covering financial, legal, operational, and commercial areas. Download as Word, Excel, or PDF.
All data stays in your browser. Nothing is sent to or stored on any server.
7. Red Flags Consultants Look For
Warning Signs
| Red Flag | What It Might Indicate | DD Response |
|---|---|---|
| Revenue growing faster than cash flow | Revenue recognition issues; poor collection | Analyze AR aging; DSO trends; collection rates |
| Declining gross margins | Pricing pressure; cost increases; mix shift | Decompose by product/customer; analyze pricing |
| Frequent "one-time" adjustments | Earnings manipulation; poor cost control | Track adjusted vs GAAP over time; scrutinize add-backs |
| High employee turnover | Culture issues; management problems; operational stress | Interview departing employees; analyze by function |
| Key customer loss or concentration | Relationship risk; competitive vulnerability | Customer interviews; contract review; retention analysis |
| Deferred maintenance/CapEx | Understated true costs; future liabilities | Asset age analysis; CapEx vs depreciation |
Hidden Liabilities
Things that might not appear on the balance sheet:
- Off-balance sheet leases: Operating leases (pre-IFRS 16)
- Pension obligations: Underfunded pension plans
- Litigation: Pending lawsuits, product liability
- Environmental: Cleanup costs, compliance requirements
- Tax: Transfer pricing disputes, uncertain tax positions
- Warranty/guarantees: Product warranties, customer guarantees
8. Private Equity Case Style Thinking
PE investors have a specific way of evaluating deals. Understanding their framework helps consultants add value.
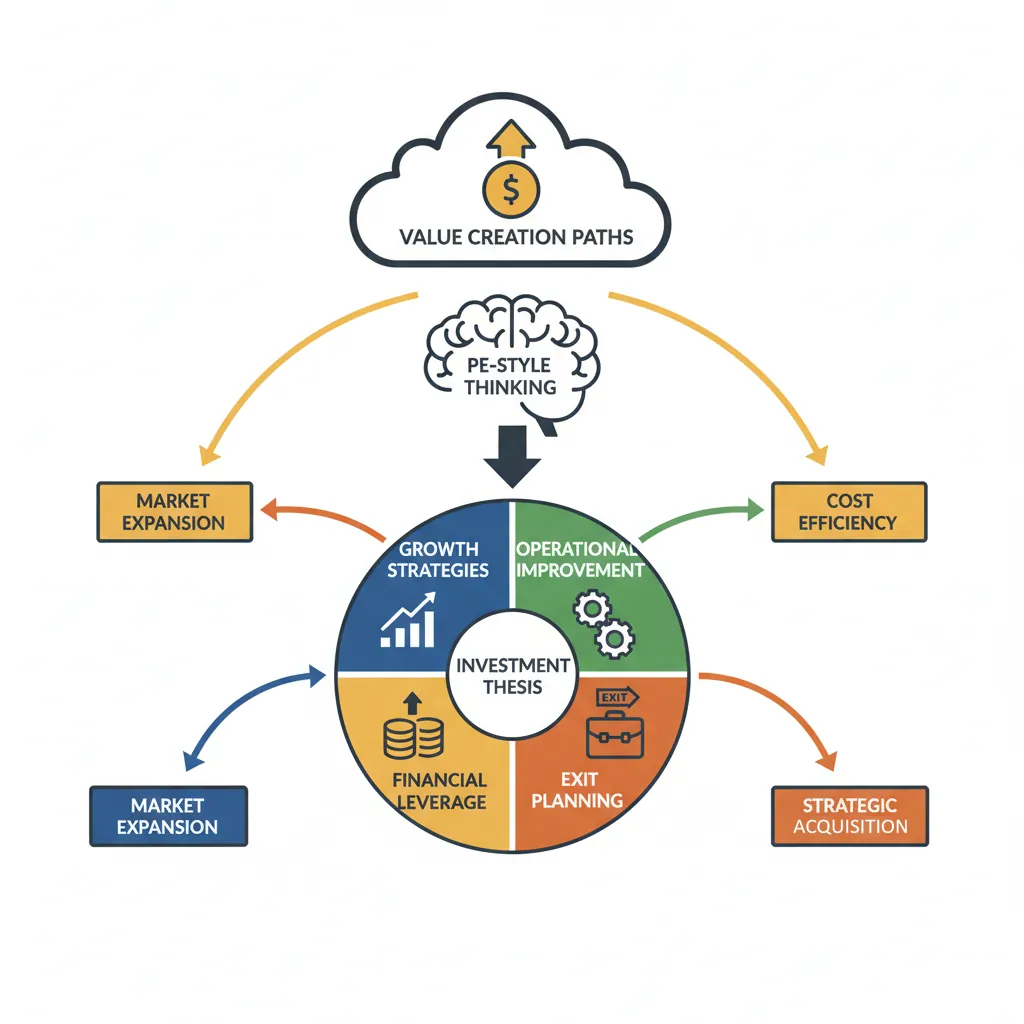
Investment Thesis
Every PE deal starts with an investment thesis—a clear statement of why this deal will create value:
Investment Thesis Structure
1. MARKET OPPORTUNITY
   "We believe [market] will grow at [X]% because [drivers]..."

2. COMPANY'S POSITION
   "Target has [competitive advantages] that will allow it to [win]..."

3. VALUE CREATION PATH
   "We will create value through [specific initiatives] resulting in [outcomes]..."

4. DOWNSIDE PROTECTION
   "Key risks include [risks]; mitigated by [protections]..."

5. EXIT POTENTIAL
   "We expect to exit via [path] at [multiple] in [years] for [IRR]..."
Value Creation Levers
| Lever | Description | Examples |
|---|---|---|
| Revenue growth | Grow the top line organically or via M&A | Geographic expansion, new products, pricing, sales force effectiveness |
| Margin improvement | Improve operating margins | Procurement savings, operational efficiency, overhead reduction |
| Multiple expansion | Sell at higher multiple than purchase | Improve growth profile, reduce risk, better positioning |
| Deleveraging | Pay down debt over hold period | Use cash flow to reduce debt; equity value increases |
PE Returns Attribution
A typical PE return might break down as:
- Revenue growth: 40% of return
- Margin improvement: 25% of return
- Multiple expansion: 20% of return
- Deleveraging: 15% of return
Target IRR: Most PE funds target 20-25% IRR; 2-3x MOIC (Multiple on Invested Capital) over 4-6 years.
Exit Strategy Planning
| Exit Route | Description | Best When |
|---|---|---|
| Strategic sale | Sell to corporate buyer | Synergies exist; strategic buyers active in space |
| Secondary PE sale | Sell to another PE firm | More growth runway; company too small for IPO |
| IPO | Go public | Large, high-growth companies; favorable markets |
| Dividend recap | Refinance and dividend out cash | Strong cash flows; low interest rates; partial exit |
9. Conclusion & Next Steps
You now have a solid foundation in financial due diligence:
- Financial statements: Income statement, balance sheet, and cash flow analysis
- Profitability: Margins, EBITDA, unit economics
- Revenue quality: Recurring vs one-time, concentration, pricing power
- Cost structure: Fixed vs variable, drivers, benchmarking
- Valuation: DCF, comparables, precedent transactions
- DD types: Commercial, financial, operational
- Red flags: Warning signs and hidden liabilities
- PE thinking: Investment thesis and value creation
Practice Exercise
Pick a public company and analyze:
- Calculate gross margin, operating margin, and EBITDA margin for the last 3 years
- Assess revenue quality: What percentage is recurring? Customer concentration?
- Estimate a valuation using EV/EBITDA and compare to current market cap