1. Introduction
Technology alone doesn't create data-driven organizations—culture does. Even the best dashboards and analytics tools fail if people don't use them to make decisions.
Data-Driven Decisions
Introduction to Business Analytics & DDDM
Analytics maturity, data-driven culture, business valueDefining & Tracking KPIs
OKRs, leading/lagging indicators, scorecard designDashboard Design & BI Tools
Tableau, Power BI, dashboard best practices, data vizExperimentation & A/B Testing
Hypothesis testing, control groups, sample sizingStatistical Significance & Interpretation
P-values, confidence intervals, effect size, power analysisDecision Frameworks & Structured Decision Making
Decision matrices, Bayesian thinking, risk analysisData Collection & Quality Management
Surveys, ETL, data governance, cleaning pipelinesBusiness Storytelling & Visualization
Narrative structure, chart selection, audience designPredictive Analytics & Forecasting
Regression, time series, ML models, forecasting methodsData-Driven Culture & Organizational Adoption
Change management, data literacy, organizational buy-inFunction-Specific Data Applications
Marketing, finance, operations, HR analyticsCapstone Projects (Portfolio-Ready)
End-to-end analytics projects, portfolio buildingAdvanced Analytics & Automation
ML pipelines, AutoML, real-time analytics, AI integrationWhat is Data Culture?
A data culture is an organizational environment where:
- Data is valued as a strategic asset
- Decisions are expected to be supported by evidence
- People are empowered and skilled to use data
- Experimentation and learning from data is encouraged
- Data quality is everyone's responsibility
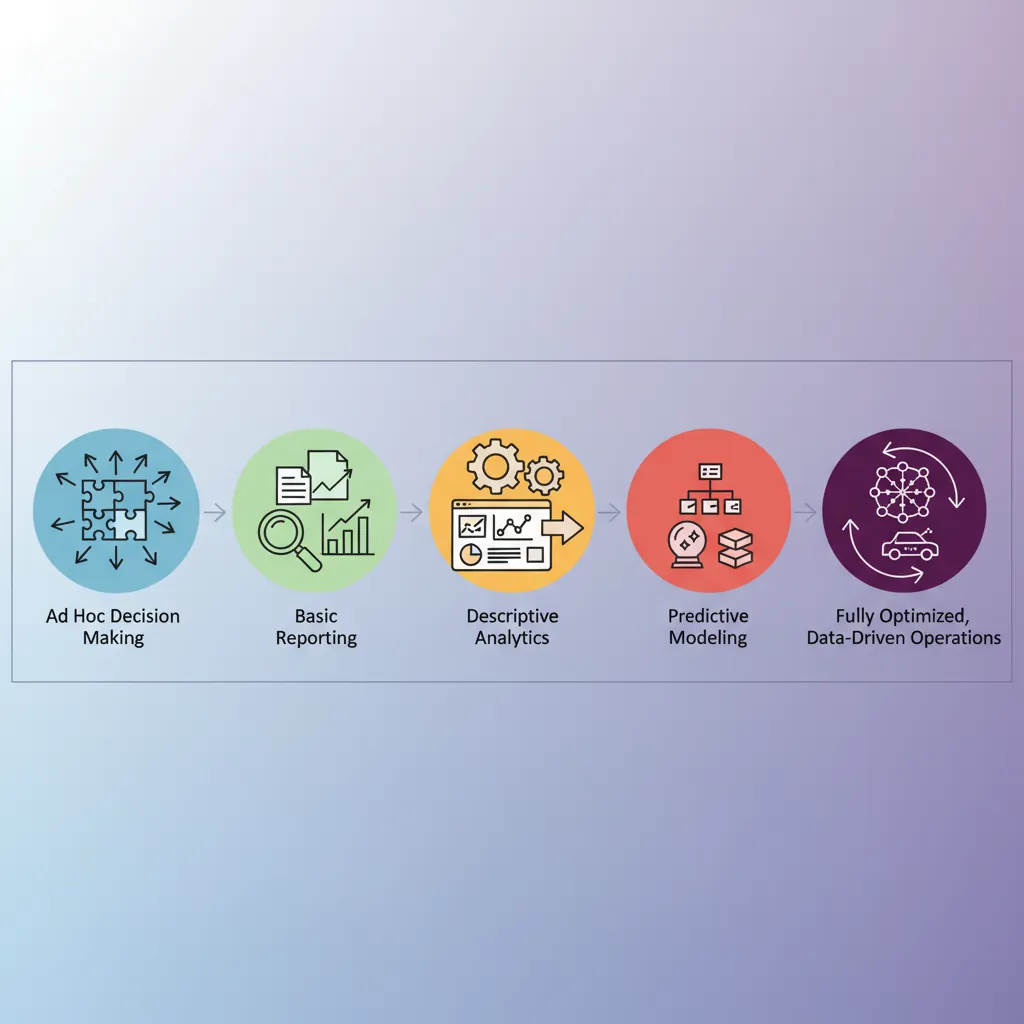
Maturity Assessment
| Level | Characteristics |
|---|---|
| 1. Ad Hoc | Data in silos, decisions based on gut feel, no standardization |
| 2. Aware | Some reporting exists, but inconsistent; few people have access |
| 3. Defined | Standard metrics, centralized data warehouse, some self-service |
| 4. Managed | Data governance in place, widespread adoption, experimentation culture |
| 5. Optimizing | Predictive/prescriptive analytics, AI-driven decisions, continuous improvement |
2. Data Literacy
Data literacy is the ability to read, work with, analyze, and communicate with data.
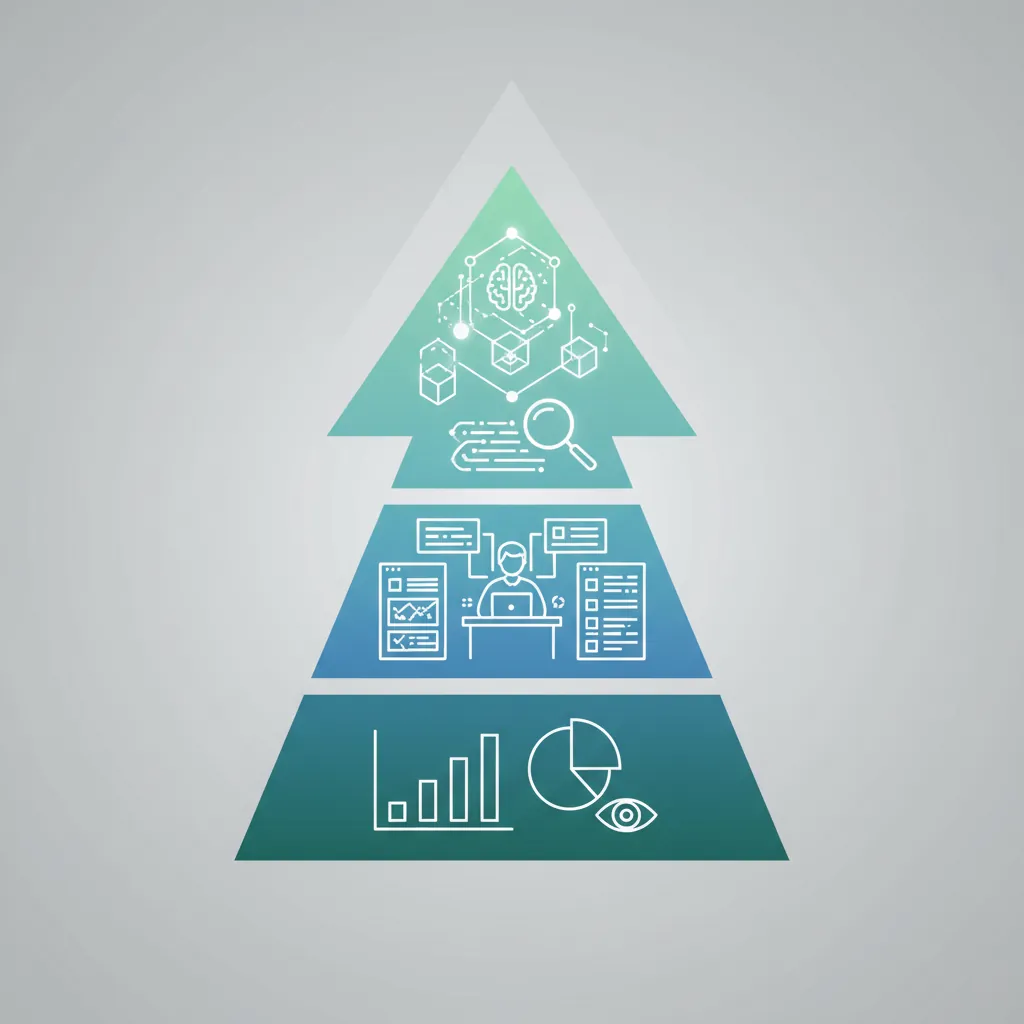
Literacy Framework
Data Literacy Competency Levels
Level 4: ADVANCED
├── Build models, statistical analysis
├── Design experiments, causal inference
└── Mentor others on data use

Level 3: PROFICIENT
├── Create dashboards, complex queries
├── Interpret statistical concepts
└── Identify data quality issues

Level 2: COMPETENT
├── Use self-service BI tools
├── Understand KPIs and trends
└── Ask good data questions

Level 1: FOUNDATIONAL
├── Read charts and tables
├── Understand basic metrics
└── Navigate dashboards
Training Programs
| Audience | Topics | Format |
|---|---|---|
| All employees | Reading charts, understanding KPIs, data ethics | E-learning, 2-4 hours |
| Managers | Interpreting dashboards, asking data questions, decision frameworks | Workshop, 1 day |
| Analysts | SQL, statistics, visualization, storytelling | Bootcamp, 2-4 weeks |
| Data champions | Advanced analytics, coaching skills, change management | Certification program |
Skill Assessment
- Pre/post assessments: Measure learning outcomes
- Practical exercises: Can they apply skills to real scenarios?
- Manager feedback: Are they using data in their work?
- Certification: Formal validation of competency
3. Change Management
Building data culture is organizational change. It requires structured approaches.
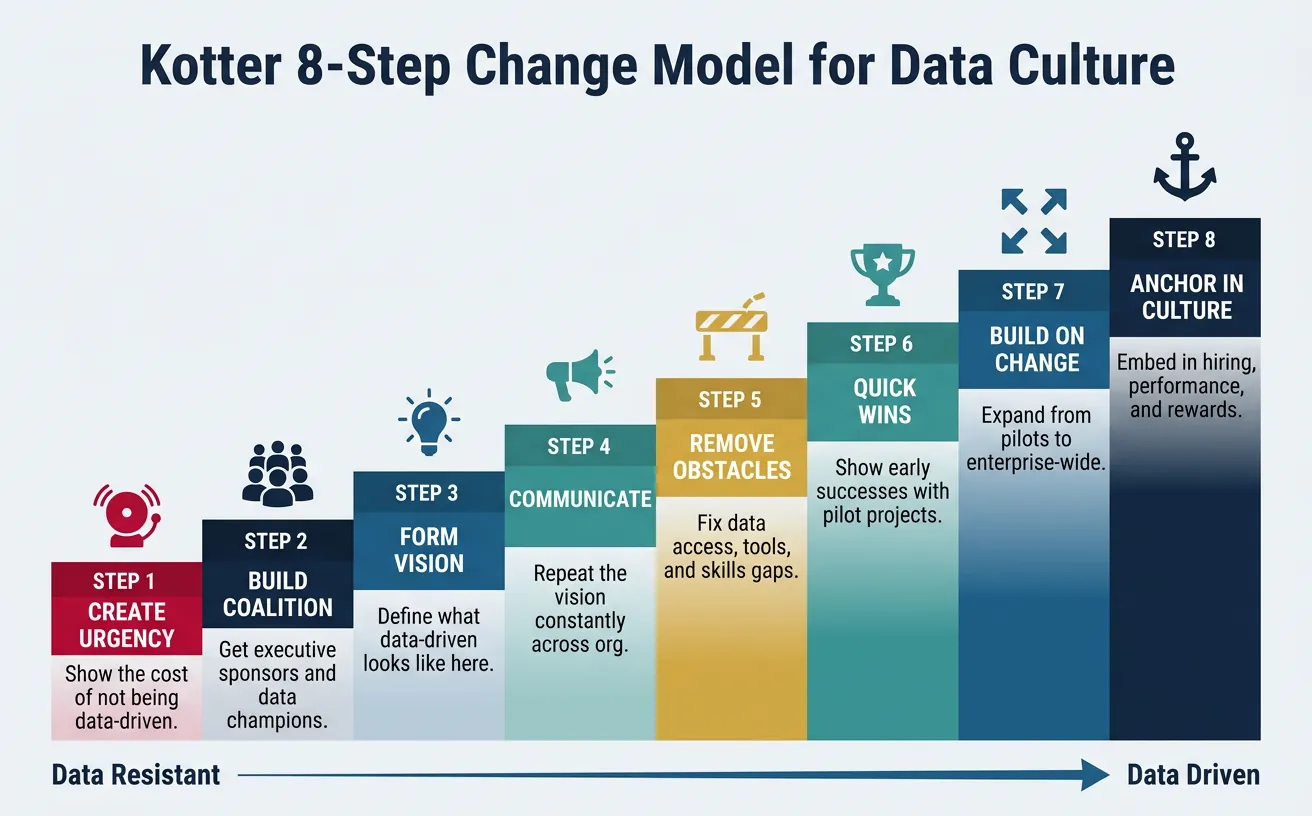
Kotter's 8-Step Model (Applied to Data)
- Create urgency: Show the cost of not being data-driven
- Build a coalition: Get executive sponsors and data champions
- Form a vision: Define what "data-driven" looks like here
- Communicate: Repeat the vision constantly
- Remove obstacles: Fix data access, tools, skills gaps
- Create quick wins: Show early successes (pilot projects)
- Build on change: Expand from pilots to enterprise
- Anchor in culture: Embed in hiring, performance, rewards
Handling Resistance
| Resistance Type | Root Cause | Strategy |
|---|---|---|
| "I don't have time" | Competing priorities | Make data easier to access; show time savings |
| "I don't trust the data" | Past bad experiences | Fix data quality; involve them in validation |
| "Data threatens my expertise" | Fear of replacement | Frame data as enhancing, not replacing, judgment |
| "It's too complicated" | Skill gap | Training + simpler tools + support |
Stakeholder Engagement
- Identify: Who are the key stakeholders for data adoption?
- Map: What's their current attitude (champion, neutral, skeptic)?
- Engage: Involve skeptics early; let them shape solutions
- Communicate: Tailor messages to what each group cares about
4. Data Democratization
Making data accessible to everyone who needs it, not just data teams.
Self-Service Analytics
- Curated data sets: Pre-cleaned, documented, trusted data
- User-friendly tools: Looker, Tableau, Power BI
- Training & support: Help people help themselves
- Templates: Pre-built dashboards for common use cases
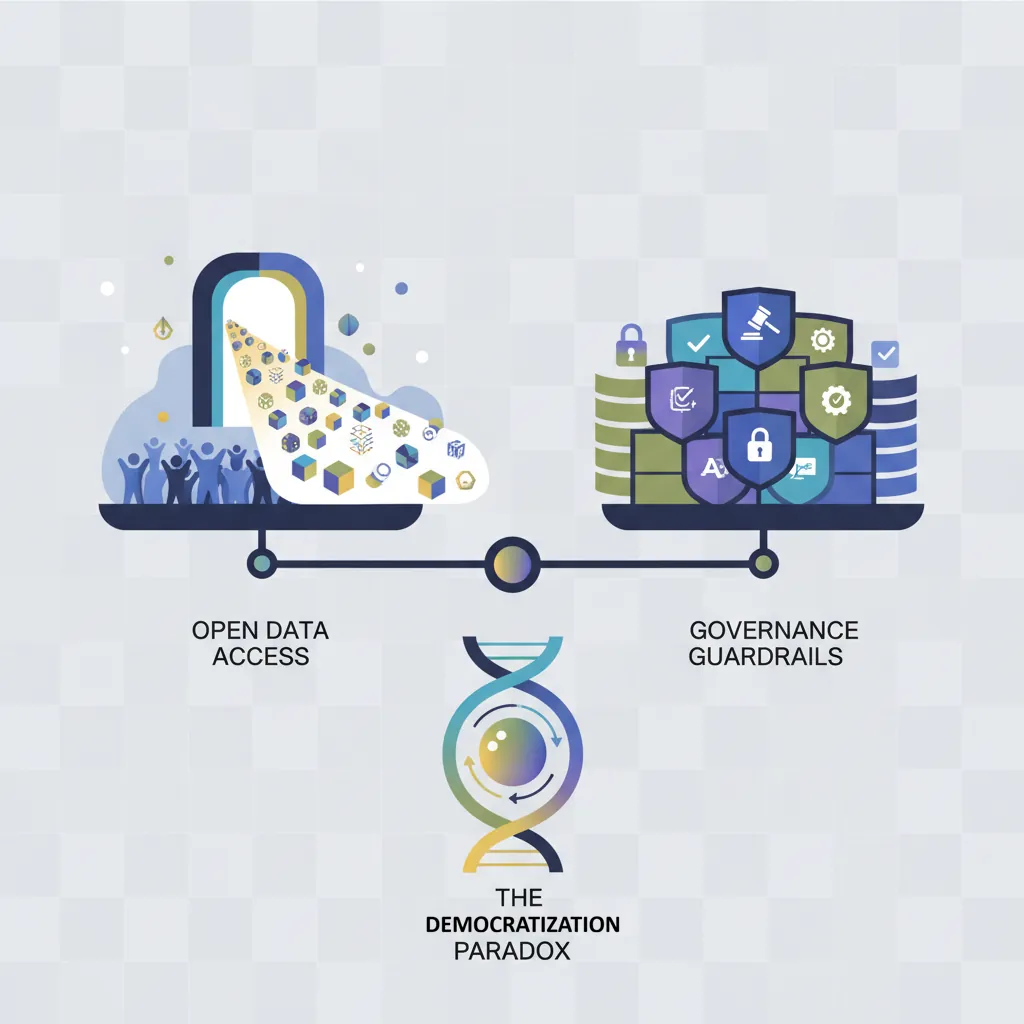
Governance Balance
The Democratization Paradox
Too little governance → data chaos, wrong decisions, security risks
Too much governance → bottlenecks, frustration, shadow IT
Solution: Tiered access, certified data sets, clear guidelines
5. Leadership Role
Culture change must be led from the top.
Executive Sponsorship
- Budget: Fund data infrastructure, tools, and training
- Visibility: Talk about data in all-hands, board meetings
- Accountability: Hold leaders accountable for data adoption
- Protection: Shield data teams from political pressure
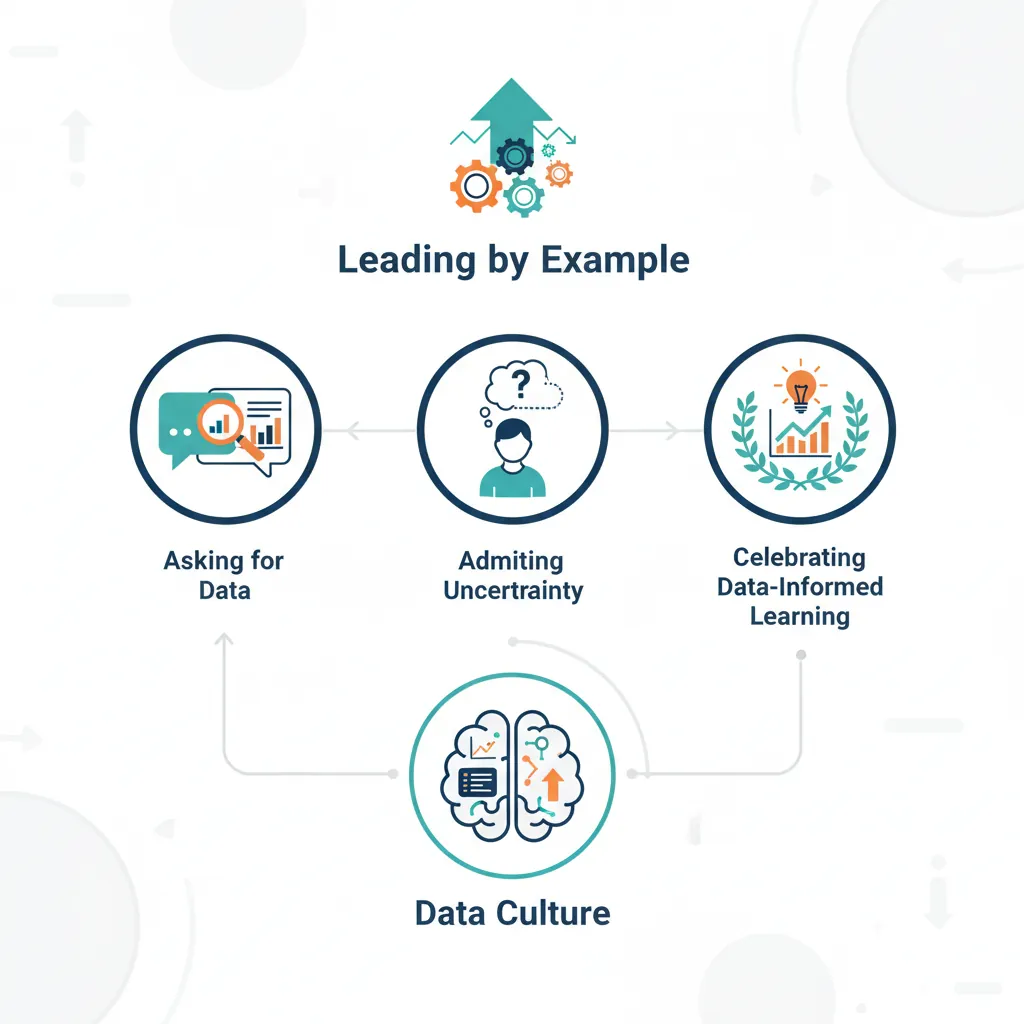
Leading by Example
- Ask for data: "What does the data say?" before decisions
- Admit uncertainty: "Let's test this hypothesis"
- Celebrate learning: Reward failed experiments that generated insights
- Use dashboards: Let people see leaders checking data
6. Measuring Adoption
What gets measured gets managed—including data culture itself.
Adoption Metrics
| Metric | What It Measures |
|---|---|
| Dashboard usage | % of employees using BI tools monthly |
| Query volume | Number of data requests/self-service queries |
| Training completion | % of target audience completing data literacy |
| Data-backed decisions | % of major decisions citing data (survey) |
| Experiment velocity | Number of A/B tests run per quarter |
Success Stories
Document and share wins to build momentum:
- Before/after: Decision made without data vs. with data
- ROI: Quantify the impact of data-driven changes
- Human stories: Profile individuals who embraced data
- Awards: Recognize data champions publicly
Assess your organization's data maturity across 5 pillars. Download your assessment as Word, Excel, PDF, or PowerPoint.
All data stays in your browser. Nothing is sent to or stored on any server.
7. Conclusion & Next Steps
You've now covered the key concepts in this section of data-driven decision making. Here's a summary of what you've learned:
Key Takeaways
- Culture eats strategy: Technology without culture change fails
- Data literacy is foundational: Train everyone, not just analysts
- Change requires leadership: Executives must model data-driven behavior
- Balance democratization and governance: Enable access with guardrails
- Measure adoption: Track and celebrate progress
In the next article, we'll cover Function-Specific Data Applications—how Marketing, Sales, Finance, Operations, HR, and Product each use data differently.