1. Introduction
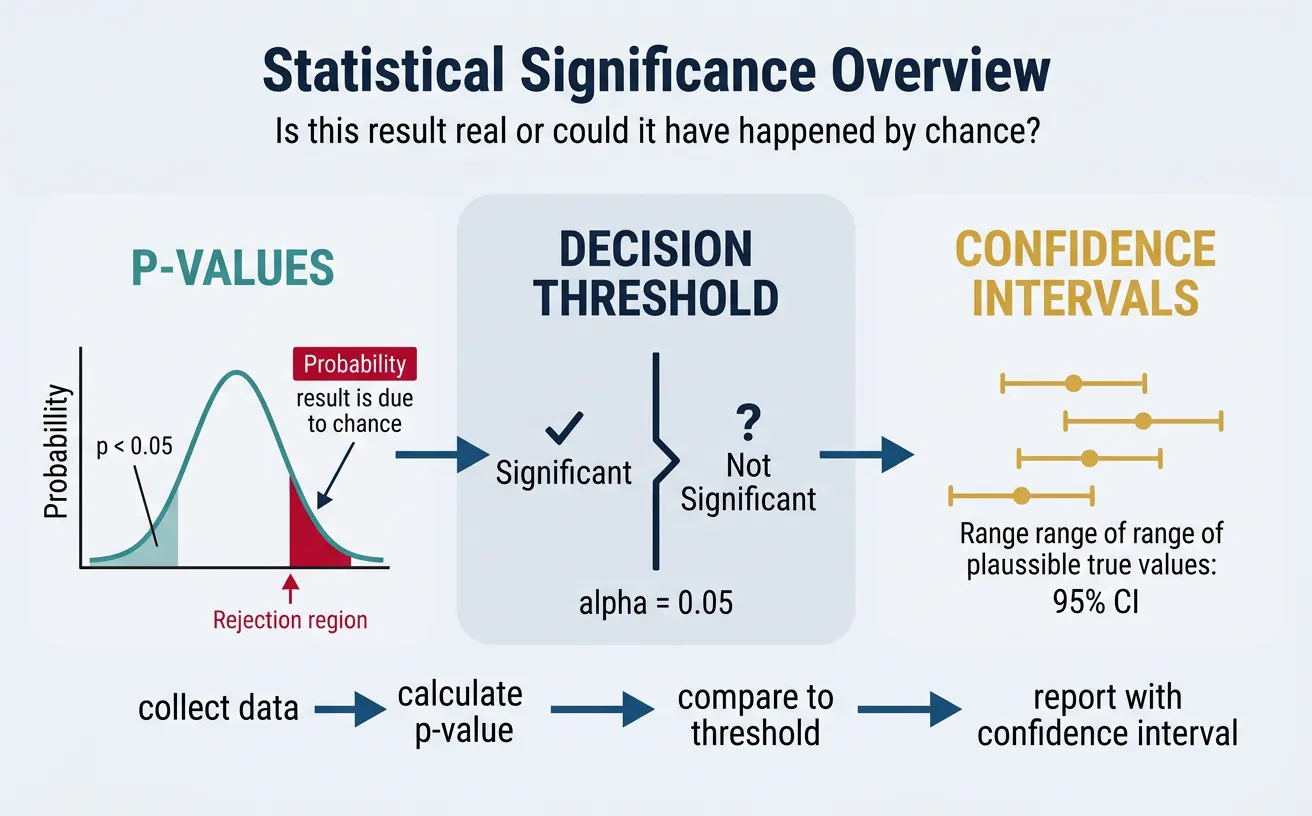
Statistical significance is the foundation of evidence-based decision making. When you run an A/B test or analyze a trend, you need to know: Is this result real, or could it have happened by chance? This guide demystifies the statistics behind business experiments.
Data-Driven Decisions
Introduction to Business Analytics & DDDM
Analytics maturity, data-driven culture, business valueDefining & Tracking KPIs
OKRs, leading/lagging indicators, scorecard designDashboard Design & BI Tools
Tableau, Power BI, dashboard best practices, data vizExperimentation & A/B Testing
Hypothesis testing, control groups, sample sizingStatistical Significance & Interpretation
P-values, confidence intervals, effect size, power analysisDecision Frameworks & Structured Decision Making
Decision matrices, Bayesian thinking, risk analysisData Collection & Quality Management
Surveys, ETL, data governance, cleaning pipelinesBusiness Storytelling & Visualization
Narrative structure, chart selection, audience designPredictive Analytics & Forecasting
Regression, time series, ML models, forecasting methodsData-Driven Culture & Organizational Adoption
Change management, data literacy, organizational buy-inFunction-Specific Data Applications
Marketing, finance, operations, HR analyticsCapstone Projects (Portfolio-Ready)
End-to-end analytics projects, portfolio buildingAdvanced Analytics & Automation
ML pipelines, AutoML, real-time analytics, AI integrationWhy Statistics Matter in Business
Every business decision involves uncertainty. Statistics provides tools to:
- Quantify uncertainty: Express how confident we are in a result
- Distinguish signal from noise: Determine if an observed effect is real
- Make defensible decisions: Support recommendations with evidence
- Avoid costly mistakes: Reduce the risk of acting on false positives
Common Misconceptions
Statistical Myths to Avoid
- Myth: "p < 0.05 means the result is true" → Reality: It means there's <5% chance of seeing this result if there's no real effect
- Myth: "A significant result is an important result" → Reality: Statistical significance ≠ practical significance
- Myth: "95% confidence interval means 95% probability the true value is in this range" → Reality: It means if we repeated the study many times, 95% of intervals would contain the true value
2. Hypothesis Testing Fundamentals
Hypothesis testing is the framework for making decisions under uncertainty. It's the backbone of A/B testing and experimental analysis.
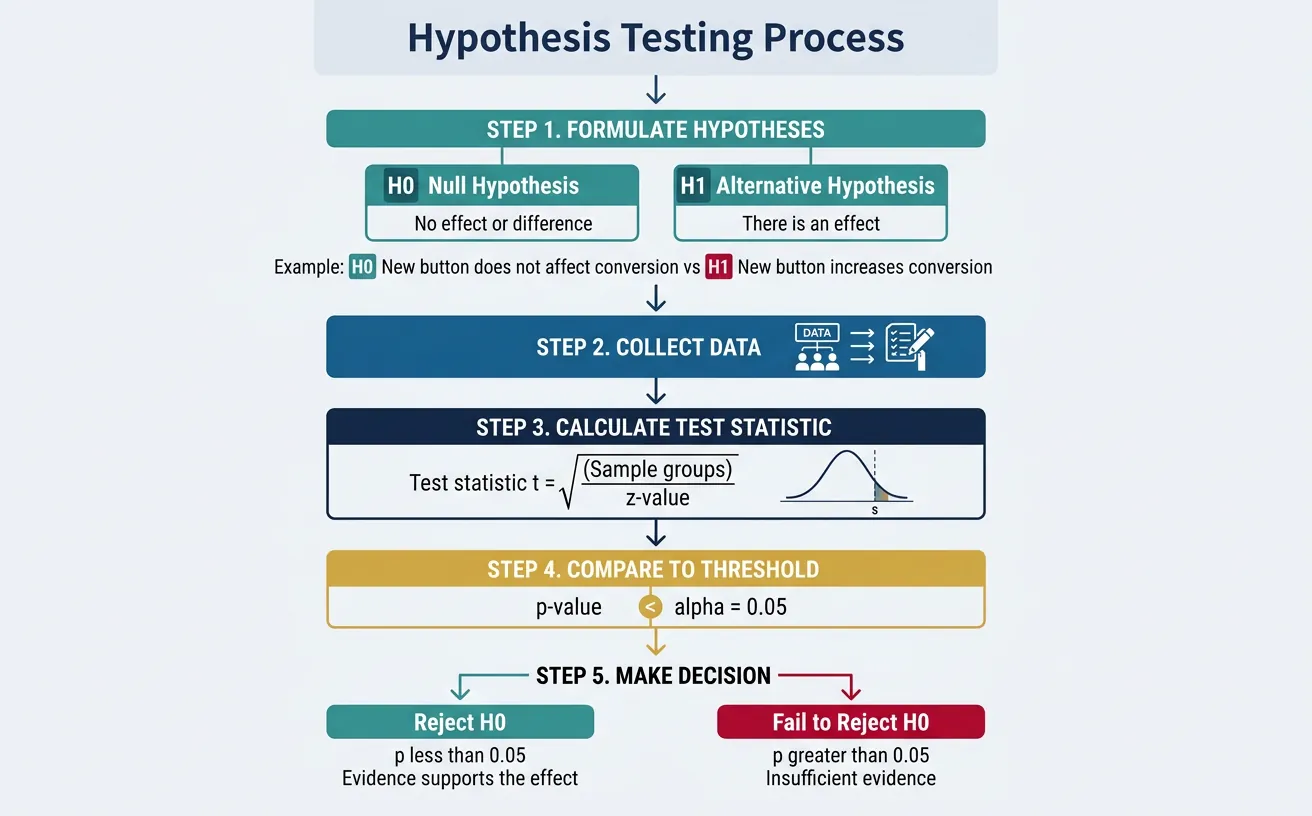
Null & Alternative Hypotheses
Every test starts with two competing hypotheses:
- Null Hypothesis (Hâ'€): There is no effect or difference. "The new button color does not affect conversion."
- Alternative Hypothesis (H₁ or Hₐ): There is an effect. "The new button color increases conversion."
| Scenario | Null Hypothesis (Hâ'€) | Alternative Hypothesis (H₁) |
|---|---|---|
| A/B test on pricing | New price has no effect on revenue | New price increases revenue |
| Email subject line test | Subject lines have equal open rates | Subject B has higher open rate |
| Product launch | New feature doesn't affect retention | New feature improves retention |
Test Statistics
A test statistic summarizes the data into a single number that can be compared to a known distribution:
- Z-test: For comparing proportions or means (large samples)
- T-test: For comparing means (small samples)
- Chi-square test: For comparing categorical distributions
Understanding P-Values
P-value: The probability of observing a result as extreme as (or more extreme than) what we observed, assuming the null hypothesis is true.
P-Value Interpretation
If p = 0.03, this means:
- If there really is no effect, there's only a 3% chance we'd see data this extreme
- This is strong evidence against the null hypothesis
- It does NOT mean there's a 3% chance the null is true
3. Significance Levels & Errors
Choosing Alpha (α)
Alpha (α) is the threshold for statistical significance—the probability of rejecting the null hypothesis when it's actually true (false positive rate).
| Alpha Level | When to Use | False Positive Risk |
|---|---|---|
| α = 0.10 | Exploratory analysis, early-stage experiments | 10% (1 in 10) |
| α = 0.05 | Standard business decisions (default) | 5% (1 in 20) |
| α = 0.01 | High-stakes decisions, regulatory | 1% (1 in 100) |
| α = 0.001 | Scientific discoveries, drug trials | 0.1% (1 in 1000) |
Type I & Type II Errors
Two types of mistakes can occur in hypothesis testing:
Error Types Matrix
                          REALITY
                    No Effect    Real Effect
                  ┌─────────────┬─────────────┐
    Don't        │ ✓ Correct   │ ✗ Type II   │
    Reject H₀    │ (True Neg)  │ (False Neg) │
DECISION         │             │ "Miss"      │
                 ├─────────────┼─────────────┤
    Reject       │ ✗ Type I    │ ✓ Correct   │
    H₀           │ (False Pos) │ (True Pos)  │
                 │ "False Alarm"│             │
                 └─────────────┴─────────────┘
- Type I Error (α): Rejecting H₀ when it's true. "Launching a feature that actually has no benefit."
- Type II Error (β): Failing to reject H₀ when it's false. "Missing a winning feature because the test was inconclusive."
Power Analysis
Statistical power = 1 - β = Probability of detecting a real effect when it exists.
- Standard target: 80% power (β = 0.20)
- Power depends on: sample size, effect size, and alpha level
- Larger sample → Higher power → Better chance of detecting real effects
4. Confidence Intervals
Confidence intervals provide more information than p-values alone—they show the range of plausible values for the true effect.
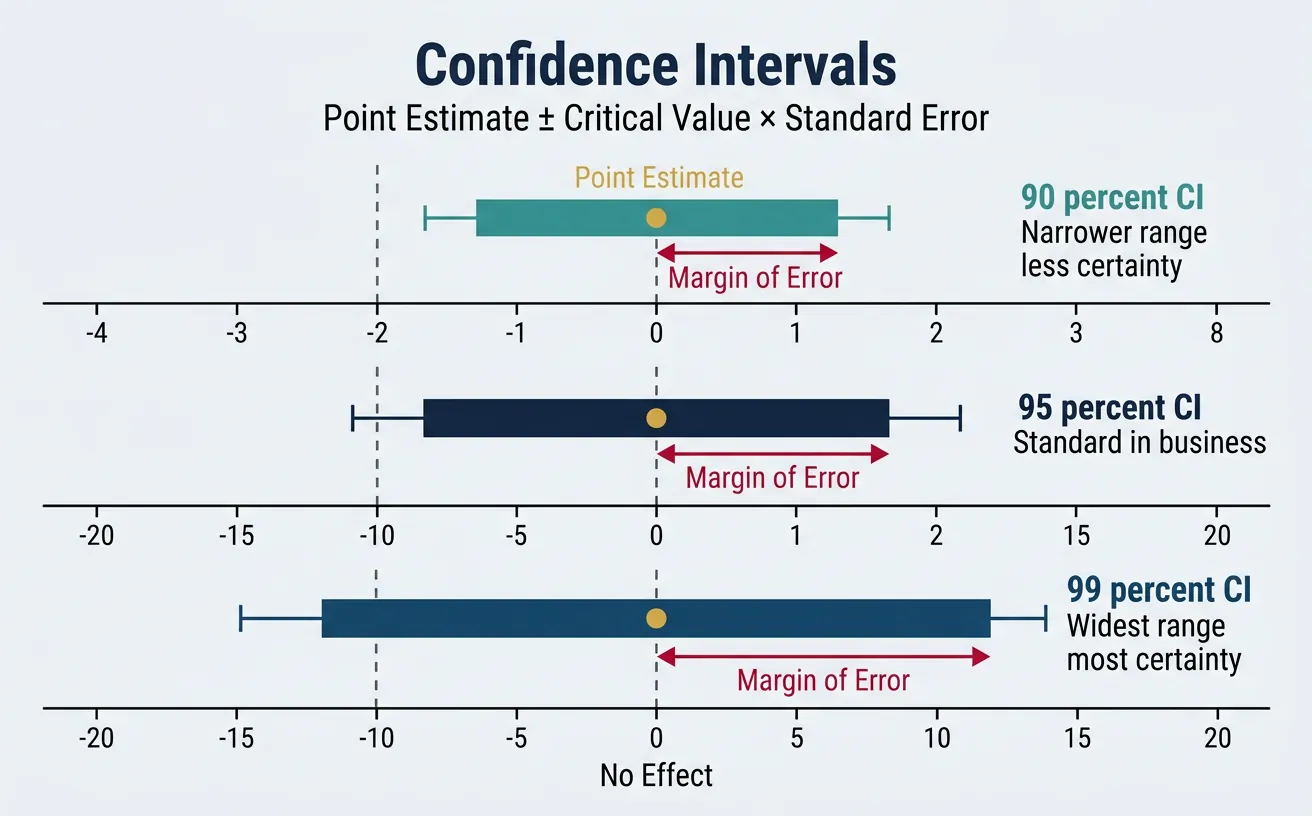
Constructing Confidence Intervals
A 95% confidence interval is calculated as:
Point Estimate ± (Critical Value × Standard Error)
For a mean: x̄ ± 1.96 × (s/√n)
Proper Interpretation
What a 95% CI Really Means
Correct: "If we repeated this experiment many times, 95% of the confidence intervals we construct would contain the true parameter."
Incorrect: "There's a 95% probability the true value is in this interval." (The true value is fixed—it either is or isn't in the interval.)
CIs vs. Significance Tests
Confidence intervals are often more informative than p-values:
- If the 95% CI excludes 0 (or the null value): Result is significant at α = 0.05
- CI width shows precision: Narrow = high precision; Wide = low precision
- CI shows effect size: You see the magnitude, not just "significant or not"
5. Sample Size Planning
Running underpowered tests wastes resources and risks missing real effects. Plan your sample size before starting.
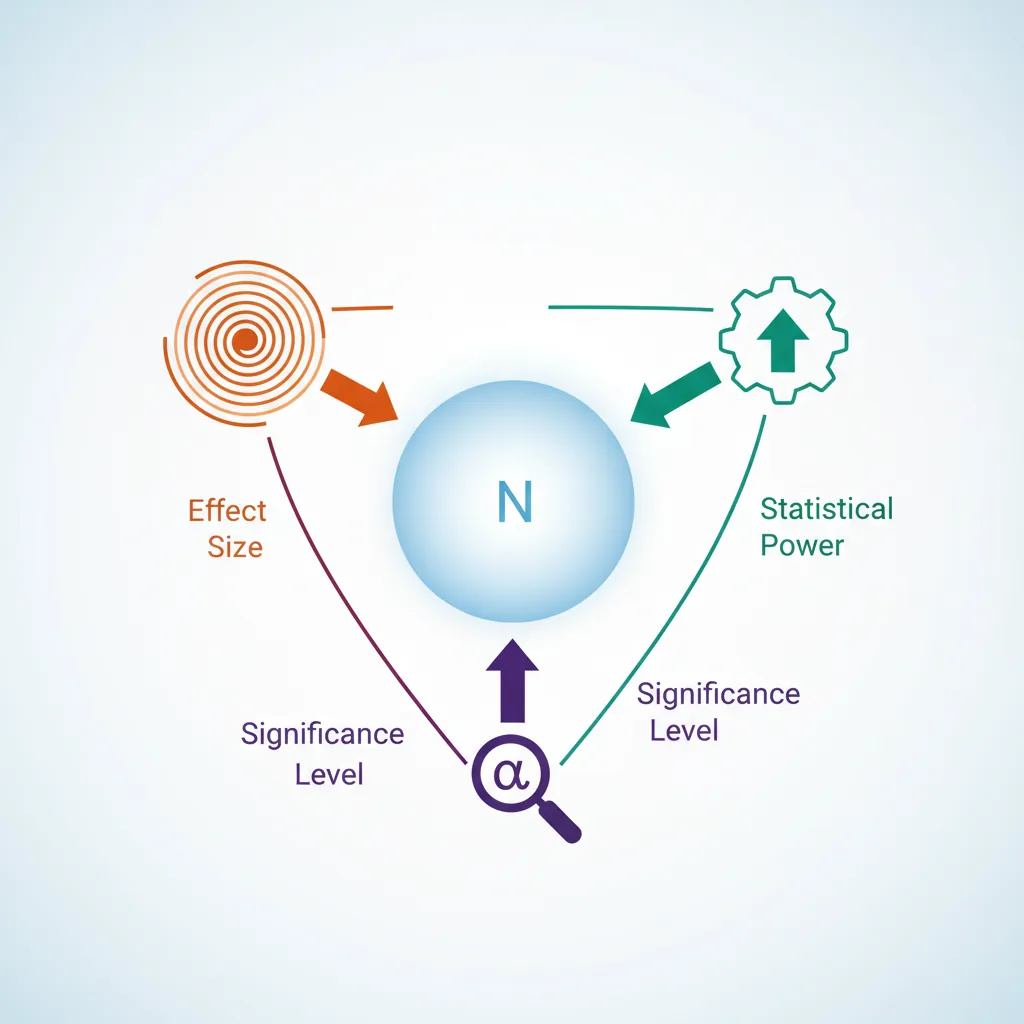
Minimum Detectable Effect (MDE)
MDE is the smallest effect size your experiment can reliably detect given your sample size, alpha, and power.
| Factor | Effect on Required Sample Size |
|---|---|
| Smaller MDE desired | Need larger sample |
| Higher power (80% → 90%) | Need larger sample |
| Lower alpha (0.05 → 0.01) | Need larger sample |
| Higher baseline variance | Need larger sample |
Sample Size Calculators
For a two-proportion test (A/B test on conversion), common inputs:
- Baseline conversion rate: Current performance (e.g., 5%)
- Minimum detectable effect: What lift matters? (e.g., 10% relative = 5.5%)
- Significance level: Usually 0.05
- Power: Usually 80%
Rule of Thumb for A/B Tests
To detect a 10% relative lift on a 5% baseline conversion with 80% power and α = 0.05:
You need approximately 30,000-35,000 users per variant.
Calculate required sample size for your A/B test. Enter baseline rate, minimum detectable effect, and significance level. Download as Excel or PDF.
All data stays in your browser. Nothing is sent to or stored on any server.
6. Practical vs. Statistical Significance
A result can be statistically significant but practically meaningless—especially with large samples.

Effect Sizes
Effect size measures the magnitude of a result, independent of sample size:
- Cohen's d: Standardized difference between means (small = 0.2, medium = 0.5, large = 0.8)
- Relative lift: (Treatment - Control) / Control (e.g., 5% lift)
- Absolute difference: Treatment - Control (e.g., 0.5 percentage points)
Business Impact Assessment
Always translate statistical results into business terms:
| Statistical Result | Business Translation |
|---|---|
| 2% conversion lift, p = 0.03 | At 100K monthly visitors, that's 2,000 additional conversions/month |
| $0.50 ARPU increase, p = 0.01 | With 50K customers, that's $25K/month additional revenue |
| 3 minute reduction in support time, p = 0.04 | At 10K tickets/month × $0.50/min labor = $15K savings |
7. Conclusion & Next Steps
You've now covered the key concepts in this section of data-driven decision making. Here's a summary of what you've learned:
Key Takeaways
- P-value: Probability of data given null is true—not probability null is true
- Type I (false positive) vs. Type II (false negative): Balance based on business costs
- Confidence intervals: Show range of plausible values—more informative than p-values alone
- Sample size: Plan ahead; underpowered tests waste resources
- Practical significance: Always translate to business impact
In the next article, we'll cover Decision Frameworks & Structured Decision Making—how to combine data with judgment to make better decisions under uncertainty.