1. Introduction to Decision Frameworks
A decision framework is a structured approach to making choices. Frameworks reduce cognitive load, ensure consistency, and help teams align on how decisions get made—especially when stakes are high or multiple stakeholders are involved.
flowchart LR
    R["R — Recommend\nProposes solution"] --> I["I — Input\nProvides expertise"]
    I --> A["A — Agree\nMust approve\n(veto power)"]
    A --> D["D — Decide\nMakes final call"]
    D --> P["P — Perform\nExecutes decision"]
Data-Driven Decisions
Introduction to Business Analytics & DDDM
Analytics maturity, data-driven culture, business valueDefining & Tracking KPIs
OKRs, leading/lagging indicators, scorecard designDashboard Design & BI Tools
Tableau, Power BI, dashboard best practices, data vizExperimentation & A/B Testing
Hypothesis testing, control groups, sample sizingStatistical Significance & Interpretation
P-values, confidence intervals, effect size, power analysisDecision Frameworks & Structured Decision Making
Decision matrices, Bayesian thinking, risk analysisData Collection & Quality Management
Surveys, ETL, data governance, cleaning pipelinesBusiness Storytelling & Visualization
Narrative structure, chart selection, audience designPredictive Analytics & Forecasting
Regression, time series, ML models, forecasting methodsData-Driven Culture & Organizational Adoption
Change management, data literacy, organizational buy-inFunction-Specific Data Applications
Marketing, finance, operations, HR analyticsCapstone Projects (Portfolio-Ready)
End-to-end analytics projects, portfolio buildingAdvanced Analytics & Automation
ML pipelines, AutoML, real-time analytics, AI integrationWhy Use Frameworks?
- Clarity: Everyone knows the process and their role
- Speed: Reduces debate about how to decide
- Accountability: Clear ownership of decisions
- Quality: Systematic consideration of factors
- Scalability: Works across teams and decision types
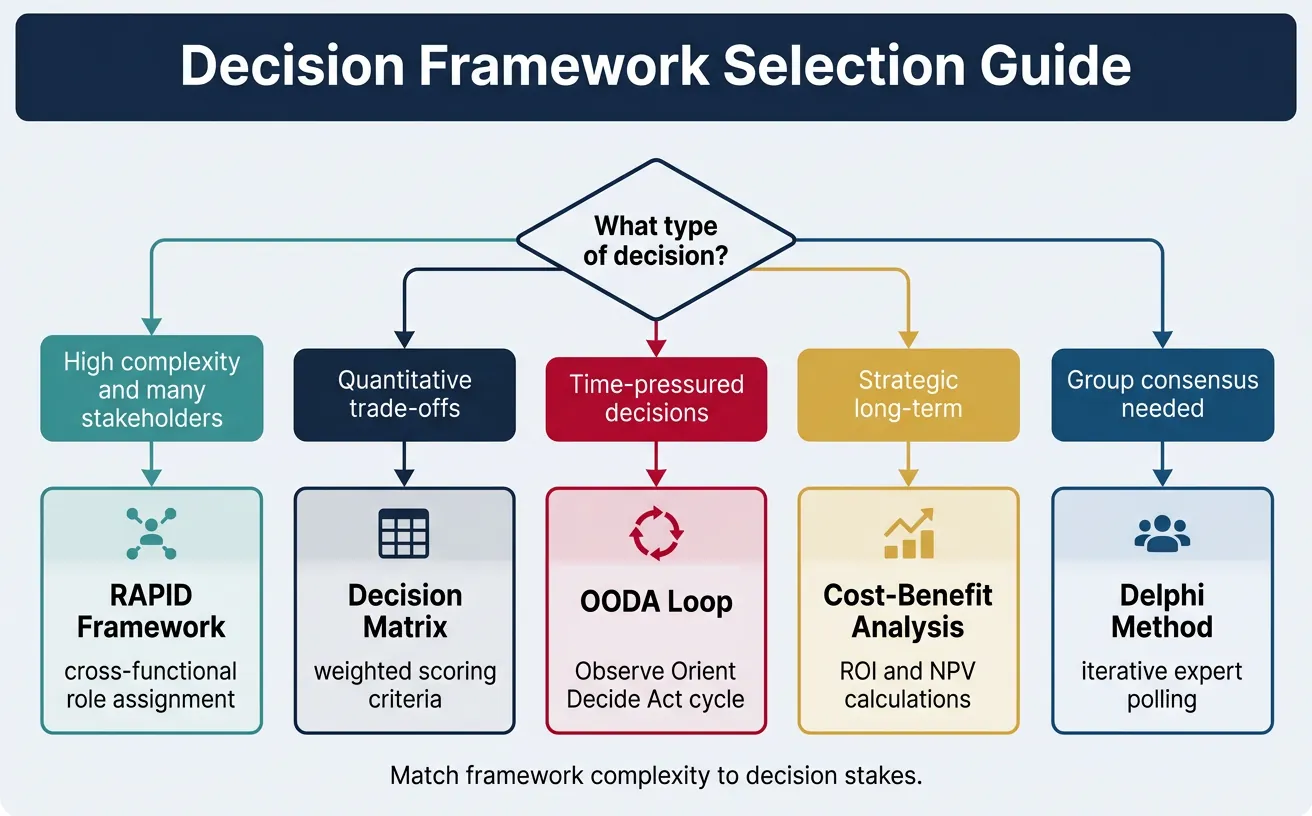
Choosing the Right Framework
| Decision Type | Recommended Framework | Example |
|---|---|---|
| Role clarity in projects | RACI Matrix | Who approves the budget? |
| Strategic decisions with stakeholders | RAPID Framework | Should we enter a new market? |
| Comparing options | Decision Matrix | Which vendor to select? |
| Sequential choices under uncertainty | Decision Tree | Launch now or delay? |
| Rapid iteration | OODA Loop | Real-time competitive response |
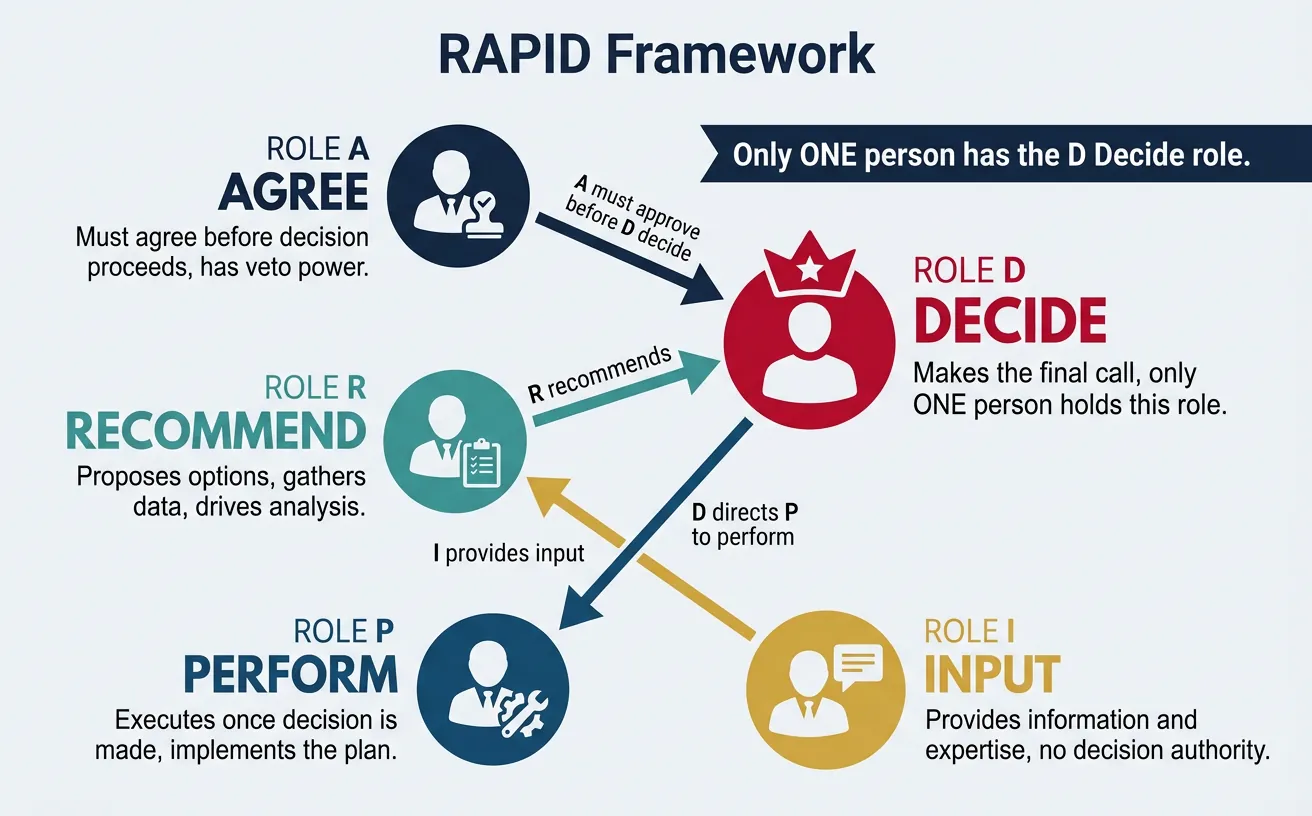
2. RAPID Framework
RAPID (by Bain & Company) clarifies who is involved in a decision and what role each person plays. It's especially useful for cross-functional decisions where accountability is unclear.
Understanding RAPID Roles
RAPID Roles Explained
R - RECOMMEND:   Proposes options, gathers data, drives analysis
A - AGREE:       Must agree before decision proceeds (veto power)
P - PERFORM:     Executes once decision is made
I - INPUT:       Provides info/expertise (no decision authority)
D - DECIDE:      Makes the final call (only ONE person)

Key Rule: Only ONE person has the "D" (Decide) role!
| Role | Responsibility | Example (New Product Launch) |
|---|---|---|
| R - Recommend | Gathers data, proposes options | Product Manager |
| A - Agree | Must agree; can veto | Legal, Finance |
| P - Perform | Executes the decision | Engineering, Marketing |
| I - Input | Provides expertise | Customer Research, Sales |
| D - Decide | Makes final call | VP of Product |
Implementation Guide
- Define the decision clearly and specifically
- Identify stakeholders who need to be involved
- Assign exactly one D (the most common mistake is multiple Ds)
- Minimize A roles (veto power should be rare)
- Communicate the framework to all parties
- Document the decision and rationale
3. RACI Matrix
RACI is similar to RAPID but focused on project/task responsibility rather than single decisions.
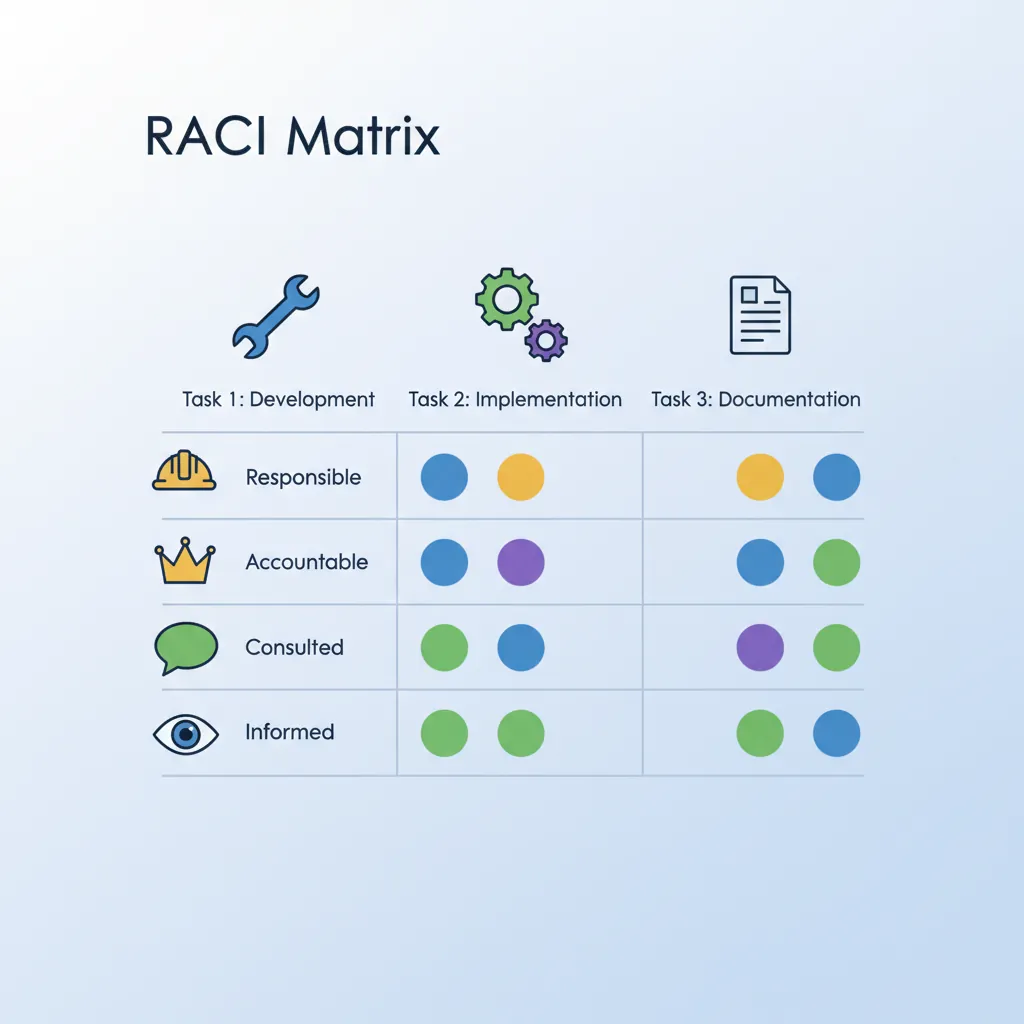
RACI Components
- R - Responsible: Does the work
- A - Accountable: Ultimately answerable (only one per task)
- C - Consulted: Provides input (two-way communication)
- I - Informed: Kept in the loop (one-way communication)
RACI Matrix Example: Dashboard Project
| Task | PM | Analyst | Engineer | Director |
|---|---|---|---|---|
| Define requirements | A | R | C | I |
| Build data pipeline | I | C | R, A | I |
| Design dashboard | C | R, A | C | I |
| Approve launch | R | C | I | A |
RACI vs. RAPID
| Aspect | RACI | RAPID |
|---|---|---|
| Focus | Tasks/deliverables | Decisions |
| Best for | Project management | Strategic decisions |
| Veto power | Not explicit | Yes (A = Agree) |
| Execution | R = Does work | P = Performs after D |
Define roles and responsibilities for up to 5 tasks. R=Responsible, A=Accountable, C=Consulted, I=Informed. Download as Word, Excel, or PDF.
All data stays in your browser. Nothing is sent to or stored on any server.
4. Decision Matrices
Decision matrices help compare options across multiple criteria systematically.
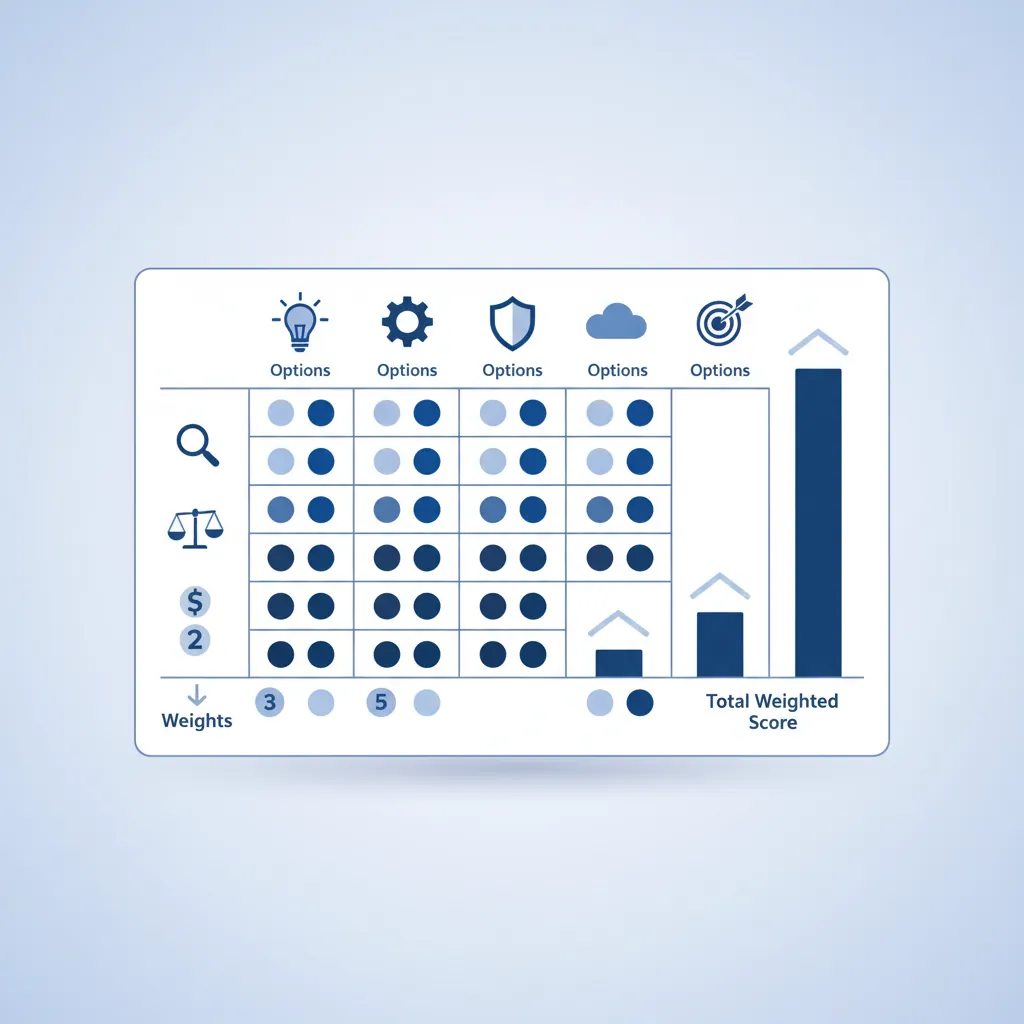
Weighted Scoring Models
Steps:
- List your options (rows)
- Define criteria (columns)
- Assign weights to criteria (must sum to 100%)
- Score each option (e.g., 1-5 scale)
- Calculate weighted scores
Weighted Decision Matrix: Vendor Selection
| Vendor | Cost (30%) | Features (25%) | Support (25%) | Integration (20%) | Total |
|---|---|---|---|---|---|
| Vendor A | 4 × 0.30 = 1.2 | 5 × 0.25 = 1.25 | 3 × 0.25 = 0.75 | 4 × 0.20 = 0.80 | 4.00 |
| Vendor B | 5 × 0.30 = 1.5 | 3 × 0.25 = 0.75 | 4 × 0.25 = 1.00 | 3 × 0.20 = 0.60 | 3.85 |
| Vendor C | 3 × 0.30 = 0.9 | 4 × 0.25 = 1.00 | 5 × 0.25 = 1.25 | 5 × 0.20 = 1.00 | 4.15 ✓ |
Result: Vendor C scores highest overall.
Pugh Matrix
Compares alternatives against a baseline using +, -, or S (same):
- Select a baseline option (often the current state or leading option)
- Compare each alternative to baseline on each criterion
- Count pluses and minuses
Advantage: Simpler than weighted scoring; good for early screening.
Compare up to 5 options with pros, cons, and weighted scores. Download as Excel or PDF.
All data stays in your browser. Nothing is sent to or stored on any server.
5. Decision Trees
Decision trees map sequential decisions and their outcomes, incorporating uncertainty.
Tree Construction
Decision Tree Example: Product Launch
□ = Decision Node    ○ = Chance Node    ▢ = Outcome

□ Launch Now?
├─ YES
│   ○ Market Response
│   ├─ Strong (60%) → ▢ +$5M profit
│   └─ Weak (40%)   → ▢ -$1M loss
│
└─ NO (Delay 6 months)
    ○ Competitor Moves
    ├─ No entry (70%) → ▢ +$3M profit
    └─ Entry (30%)    → ▢ +$1M profit
graph TD
    D{"Decision:\nLaunch Product?"} -->|"Launch"| C1{"Market\nResponse"}
    D -->|"Don't Launch"| ZERO["$0\n(Status Quo)"]

    C1 -->|"Success (60%)"| WIN["Revenue: $5M\nProfit: $3M"]
    C1 -->|"Moderate (25%)"| MED["Revenue: $2M\nProfit: $500K"]
    C1 -->|"Failure (15%)"| LOSE["Revenue: $500K\nLoss: -$1M"]

    WIN -.-> EV["EMV = (0.6 × $3M)\n+ (0.25 × $500K)\n+ (0.15 × -$1M)\n= $1.775M"]
Expected Value Analysis
Calculate expected value (EV) for each path:
- Launch Now: (0.60 × $5M) + (0.40 × -$1M) = $3M - $0.4M = $2.6M
- Delay: (0.70 × $3M) + (0.30 × $1M) = $2.1M + $0.3M = $2.4M
Decision: Launch now has higher expected value ($2.6M vs $2.4M).
Important: EV ≠ Guaranteed Outcome
Expected value is an average over many decisions. For one-time decisions, also consider:
- Risk tolerance: Can you absorb the worst-case scenario?
- Reversibility: Can you change course if wrong?
- Information value: Would waiting provide valuable info?
6. Cognitive Biases in Decision Making
Even with frameworks, human judgment is susceptible to systematic biases.
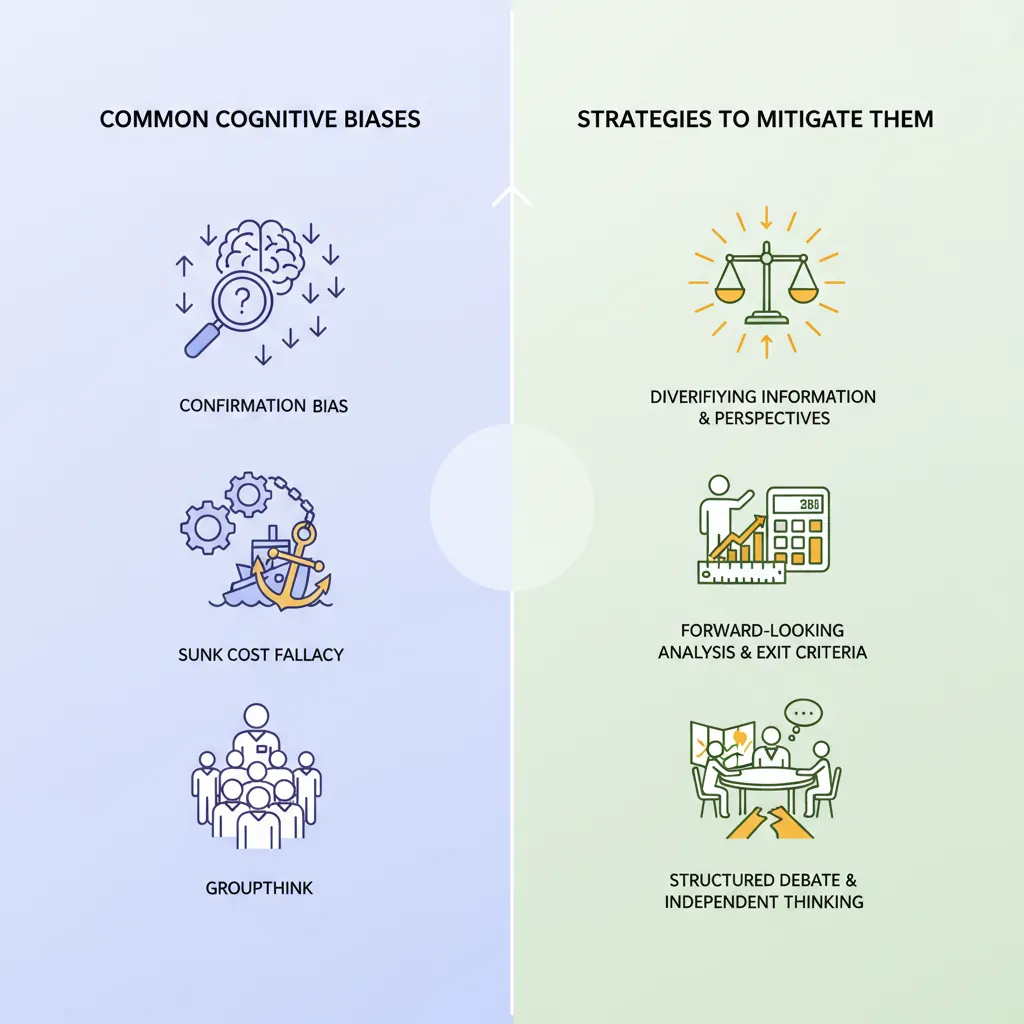
Common Decision Biases
| Bias | Description | Business Example |
|---|---|---|
| Confirmation bias | Seeking info that confirms existing beliefs | Only reading positive customer reviews |
| Anchoring | Over-relying on first piece of info | First budget estimate dominates discussions |
| Sunk cost fallacy | Continuing due to past investment | "We've spent $2M, we can't stop now" |
| Availability bias | Overweighting recent/memorable events | Overreacting to one viral complaint |
| Groupthink | Conforming to group opinion | No one challenges the CEO's idea |
| Overconfidence | Overestimating accuracy of predictions | "We'll definitely hit 30% growth" |
Debiasing Strategies
- Pre-mortem: "Assume this failed—what went wrong?" Surfaces risks
- Devil's advocate: Assign someone to argue against the decision
- Outside view: Ask "What happens to similar projects?" (base rates)
- Red team/Blue team: Separate teams argue for and against
- Blind analysis: Remove identifying info when evaluating options
- Decision journals: Record predictions and revisit to calibrate
7. Conclusion & Next Steps
You've now covered the key concepts in this section of data-driven decision making. Here's a summary of what you've learned:
Key Takeaways
- Use RAPID for cross-functional decisions with one clear "D"
- Use RACI for project task assignment and accountability
- Use decision matrices when comparing multiple options on criteria
- Use decision trees for sequential decisions under uncertainty
- Actively debias with pre-mortems, devil's advocates, and outside views
- Document decisions for learning and accountability
In the next article, we'll cover Data Collection & Quality Management—the foundation for all reliable analytics and decision-making.