1. Introduction
KPIs (Key Performance Indicators) are quantifiable measures that evaluate how effectively an organization, team, or individual is achieving business objectives. Without clear KPIs, organizations fly blind—unable to determine whether their actions are driving results or wasting resources.
What Gets Measured Gets Managed
This classic management maxim captures the essence of KPIs: you cannot improve what you do not track. But beware—poorly chosen metrics can distort behavior. The goal is not just measurement, but meaningful measurement.
Data-Driven Decisions
Introduction to Business Analytics & DDDM
Analytics maturity, data-driven culture, business valueDefining & Tracking KPIs
OKRs, leading/lagging indicators, scorecard designDashboard Design & BI Tools
Tableau, Power BI, dashboard best practices, data vizExperimentation & A/B Testing
Hypothesis testing, control groups, sample sizingStatistical Significance & Interpretation
P-values, confidence intervals, effect size, power analysisDecision Frameworks & Structured Decision Making
Decision matrices, Bayesian thinking, risk analysisData Collection & Quality Management
Surveys, ETL, data governance, cleaning pipelinesBusiness Storytelling & Visualization
Narrative structure, chart selection, audience designPredictive Analytics & Forecasting
Regression, time series, ML models, forecasting methodsData-Driven Culture & Organizational Adoption
Change management, data literacy, organizational buy-inFunction-Specific Data Applications
Marketing, finance, operations, HR analyticsCapstone Projects (Portfolio-Ready)
End-to-end analytics projects, portfolio buildingAdvanced Analytics & Automation
ML pipelines, AutoML, real-time analytics, AI integration2. Characteristics of Effective KPIs
Not all metrics are KPIs. A KPI must be key—directly tied to strategic objectives and critical for decision-making. Use the SMART framework as a starting point, then go deeper.

Measurable & Specific
A KPI must have a clear definition that everyone agrees on:
- Bad: "Improve customer satisfaction"
- Good: "Increase NPS from 42 to 55 by Q4 2026"
Quantifiable means you can assign a number. Specific means no ambiguity about what counts.
| Vague Metric | Specific KPI Definition |
|---|---|
| Revenue growth | MRR (Monthly Recurring Revenue) excluding one-time fees |
| Customer engagement | DAU/MAU ratio (Daily Active Users ÷ Monthly Active Users) |
| Team productivity | Story points completed per sprint per engineer |
Actionable
You must be able to influence the metric through actions:
- Actionable: Cart abandonment rate (you can optimize checkout flow)
- Not actionable: Weather impact on sales (you can't control the weather)
Beware Vanity Metrics
Vanity metrics look impressive but don't inform decisions. Examples:
- Total registered users (includes inactive/churned)
- Page views without context (high bounce = bad traffic)
- Social media followers (don't convert to revenue)
Instead, focus on actionable metrics tied to business outcomes.
Aligned & Time-Bound
Aligned: KPIs should cascade from company strategy → department → team → individual. Misaligned KPIs create local optimization at the expense of global goals.
Time-bound: Every KPI needs a reporting cadence (daily, weekly, monthly, quarterly) and a target date.
Define up to 4 KPIs with targets, data sources, and measurement frequency. Download as Word, Excel, or PDF.
All data stays in your browser. Nothing is sent to or stored on any server.
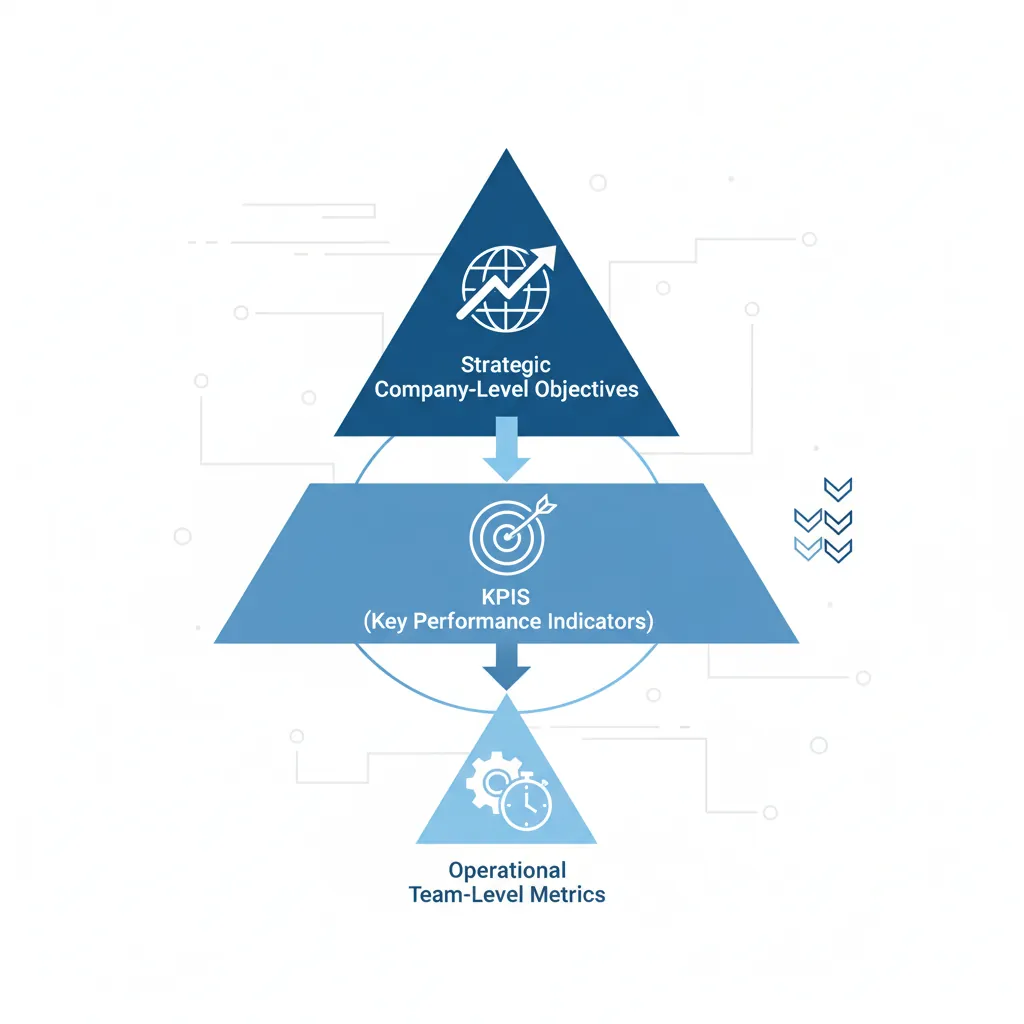
3. KPI Hierarchies
Not all metrics are equal. Organize them in a hierarchy from strategic (long-term, company-wide) to operational (short-term, team-specific).

North Star Metrics
A North Star Metric is the single most important measure of success for your company. It captures core value delivered to customers.
| Company | North Star Metric | Why It Works |
|---|---|---|
| Airbnb | Nights Booked | Captures value for both hosts and guests |
| Spotify | Time Spent Listening | Reflects user engagement and satisfaction |
| Slack | Messages Sent per User | Shows team adoption and stickiness |
| Uber | Rides per Week | Captures frequency and market penetration |
Supporting Metrics
Supporting metrics are inputs that drive the North Star. If your North Star is "Monthly Active Users," supporting metrics might include:
- Acquisition: New signups per week
- Activation: % completing onboarding
- Retention: 30-day return rate
- Resurrection: Dormant users reactivated
Operational Metrics
Day-to-day metrics that teams monitor to ensure smooth operations:
- Engineering: Deployment frequency, incident count, MTTR
- Support: Ticket volume, first response time, resolution rate
- Sales: Pipeline value, meetings booked, demo-to-trial conversion
KPI Hierarchy Example
NORTH STAR: Monthly Recurring Revenue (MRR)
    │
    ├── SUPPORTING: New MRR
    │   ├── Operational: Leads generated
    │   ├── Operational: Lead → Demo conversion
    │   └── Operational: Demo → Closed Won rate
    │
    ├── SUPPORTING: Expansion MRR
    │   ├── Operational: Upsell opportunities identified
    │   └── Operational: Cross-sell conversion rate
    │
    └── SUPPORTING: Churned MRR
        ├── Operational: At-risk accounts flagged
        ├── Operational: Save rate (% at-risk retained)
        └── Operational: Days to first value
4. KPI Frameworks
Structured frameworks help ensure comprehensive coverage and alignment across the organization.
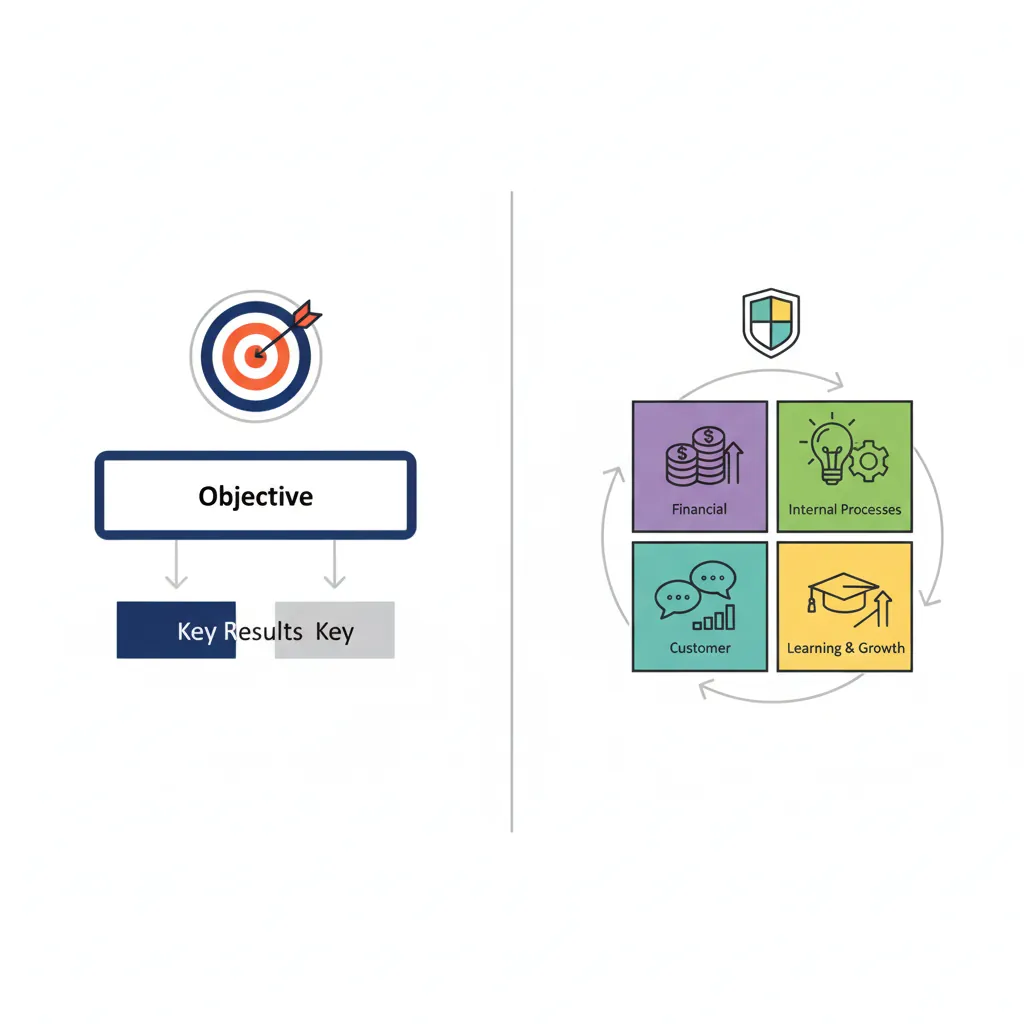
OKRs (Objectives & Key Results)
Popularized by Intel and Google, OKRs link ambitious Objectives (qualitative goals) with measurable Key Results (quantitative outcomes).
| Component | Definition | Example |
|---|---|---|
| Objective | Qualitative, inspiring goal | "Become the market leader in customer satisfaction" |
| Key Result 1 | Measurable outcome | Increase NPS from 45 to 65 |
| Key Result 2 | Measurable outcome | Reduce average support response time from 4h to 1h |
| Key Result 3 | Measurable outcome | Achieve 90% first-contact resolution rate |
OKR Best Practices
- 3-5 Objectives per quarter (focus beats breadth)
- 3-5 Key Results per Objective (measurable, not tasks)
- 70% achievement is target (if you hit 100%, you aimed too low)
- Transparent: Everyone sees everyone's OKRs
Balanced Scorecard
Developed by Kaplan & Norton, the Balanced Scorecard ensures you measure performance across four perspectives:
| Perspective | Question Answered | Example KPIs |
|---|---|---|
| Financial | How do we look to shareholders? | Revenue growth, ROI, profit margin |
| Customer | How do customers see us? | NPS, retention rate, market share |
| Internal Process | What must we excel at? | Cycle time, defect rate, throughput |
| Learning & Growth | Can we continue to improve? | Employee engagement, training hours, innovation rate |
Driver Trees
A driver tree (or metric tree) decomposes a top-level KPI into its component drivers. This is powerful for identifying levers to pull.
Revenue Driver Tree
REVENUE
├── Number of Customers × Average Revenue per Customer
│
├── Number of Customers
│   ├── New Customers Acquired
│   │   ├── Leads × Conversion Rate
│   │   └── Leads = Website Visitors × Lead Capture Rate
│   └── Existing Customers Retained
│       └── (Previous Customers - Churned Customers)
│
└── Average Revenue per Customer
    ├── Base Plan Revenue
    ├── + Upsell Revenue
    └── + Cross-sell Revenue
Build a Balanced Scorecard across Financial, Customer, Internal Process, and Learning & Growth perspectives. Download as Word, Excel, or PDF.
All data stays in your browser. Nothing is sent to or stored on any server.
5. Function-Specific KPIs
Different functions have different metrics that matter. Here are the essential KPIs by domain.
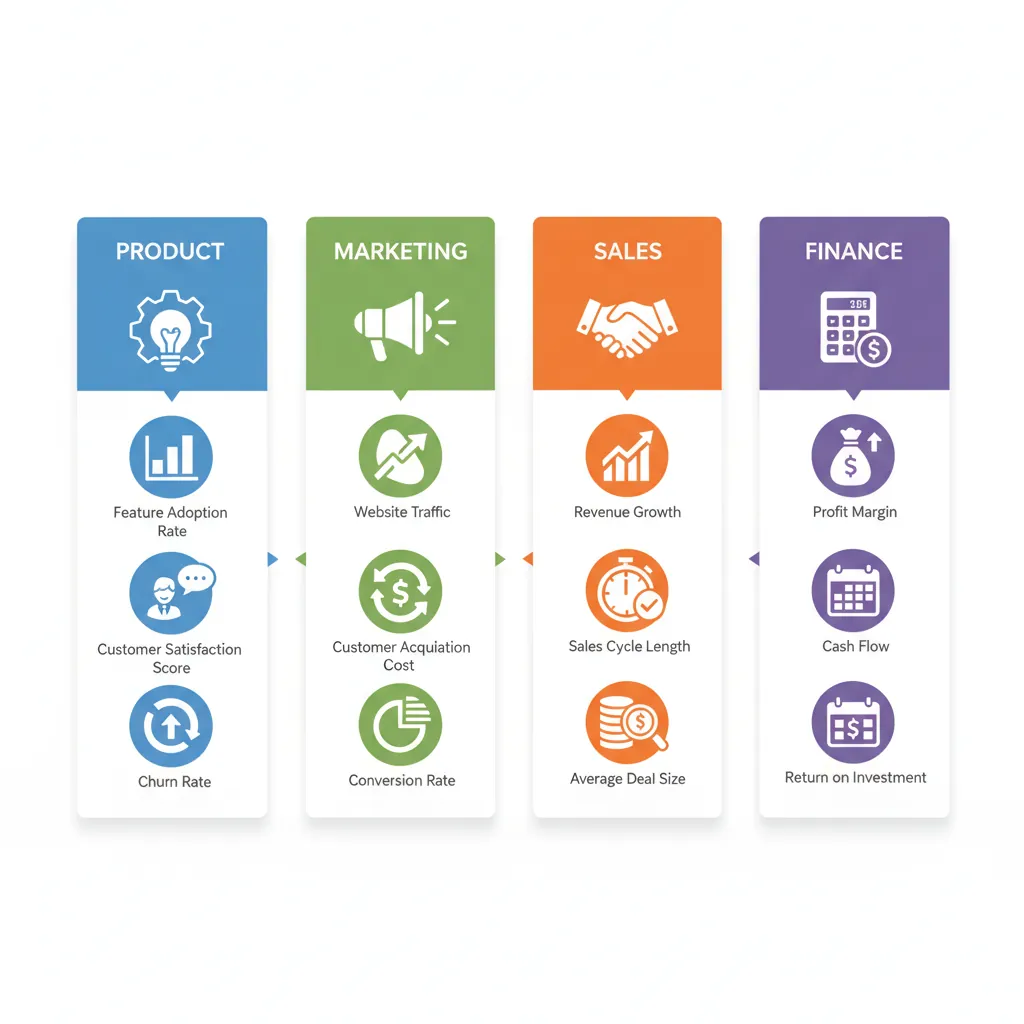
Product KPIs
| KPI | Definition | Target Benchmark |
|---|---|---|
| DAU/MAU | Daily Active Users ÷ Monthly Active Users | >25% (social), >50% (productivity) |
| Feature Adoption | % users using a specific feature | Varies by feature importance |
| Time to Value | Time from signup to first value moment | <5 minutes for freemium |
| Net Retention | (Start MRR + Expansion - Churn) ÷ Start MRR | >100% (best-in-class >120%) |
Marketing KPIs
| KPI | Definition | Why It Matters |
|---|---|---|
| CAC | Customer Acquisition Cost = Total Marketing Spend ÷ New Customers | Efficiency of acquisition spend |
| LTV | Lifetime Value = Avg Revenue × Avg Lifespan | Total value of a customer relationship |
| LTV:CAC Ratio | LTV ÷ CAC | >3:1 is healthy; <1:1 is unsustainable |
| ROAS | Return on Ad Spend = Revenue from Ads ÷ Ad Spend | Effectiveness of paid campaigns |
Finance KPIs
| KPI | Definition | What It Reveals |
|---|---|---|
| Gross Margin | (Revenue - COGS) ÷ Revenue | Profitability of core business |
| EBITDA Margin | EBITDA ÷ Revenue | Operating efficiency |
| Burn Rate | Monthly cash outflow | Runway before funding needed |
| Rule of 40 | Revenue Growth % + Profit Margin % | >40% = healthy SaaS business |
Consulting/Strategy KPIs
| KPI | Definition | Benchmark |
|---|---|---|
| Utilization Rate | Billable Hours ÷ Total Available Hours | 75-85% target |
| Realization Rate | Actual Revenue ÷ Billed Amount | >95% healthy |
| Client Retention | % clients with repeat engagements | >70% excellent |
| Revenue per Employee | Total Revenue ÷ Headcount | $200-500K typical |
6. Metric Governance
Without governance, metrics proliferate, definitions diverge, and trust erodes. Establish clear ownership and standards.
Metric Governance Framework
- Metric Dictionary: Single source of truth for all KPI definitions
- Ownership: Every metric has an accountable owner
- Calculation Logic: Document the exact formula and data sources
- Refresh Cadence: How often is data updated?
- Access Control: Who can view, who can modify?
- Change Management: Process for proposing metric changes
Common pitfalls to avoid:
- Metric sprawl: Too many KPIs dilute focus
- Definition drift: Same metric calculated differently across teams
- Stale metrics: KPIs that no longer align with strategy
- Gaming: Incentives that encourage metric manipulation
7. Conclusion & Next Steps
Key Takeaways
- KPIs must be SMART: Specific, Measurable, Actionable, Relevant, Time-bound
- Hierarchy matters: North Star → Supporting → Operational metrics
- Frameworks provide structure: OKRs, Balanced Scorecard, Driver Trees
- Different functions, different metrics: Customize KPIs to the domain
- Governance prevents chaos: Own, document, and maintain your metrics
In the next article, we'll cover Dashboard Design & BI Tools—how to visualize your KPIs effectively and select the right tools for your organization.