1. Introduction
A great product without a viable business model is just a hobby. This guide covers the frameworks and metrics you need to design a sustainable, scalable business.
Complete Startup Journey
Ideation & Opportunity Recognition
Problem discovery, market gaps, idea generation frameworksIdea Validation & MVP Prototyping
Customer discovery, landing pages, prototype testingBusiness Models & Canvas
BMC, lean canvas, revenue models, value propositionsLean Startup Methodology
Build-measure-learn, pivoting, validated learningFundraising & Financial Modeling
VC, angels, SAFE notes, cap tables, financial projectionsBuilding Your Founding Team
Co-founder selection, equity splits, team dynamicsHiring & Company Culture
Recruiting, culture building, OKRs, team scalingScaling Operations & Growth Hacking
Growth loops, viral mechanics, operational scalingMarketing Campaigns & Digital Growth
CAC/LTV, digital marketing, positioning, channelsLegal, Financial & Risk Foundations
Entity structure, IP, compliance, burn rate managementData-Driven Decision Making
SaaS metrics, NPS, analytics dashboards, A/B testingExit Strategies & Investor Pitches
Valuations, pitch decks, M&A, IPO preparationStartup Ecosystem & Networking
Accelerators, mentors, communities, ecosystem mappingInnovation, Technology & Future Trends
Emerging tech, AI/ML, deep tech, future marketsCapstone Projects & Portfolio
Comprehensive startup plan, portfolio presentation2. Business Model Canvas
The Business Model Canvas (BMC), created by Alexander Osterwalder, is a strategic management template for developing new or documenting existing business models. It's a visual chart with elements describing a company's value proposition, infrastructure, customers, and finances.
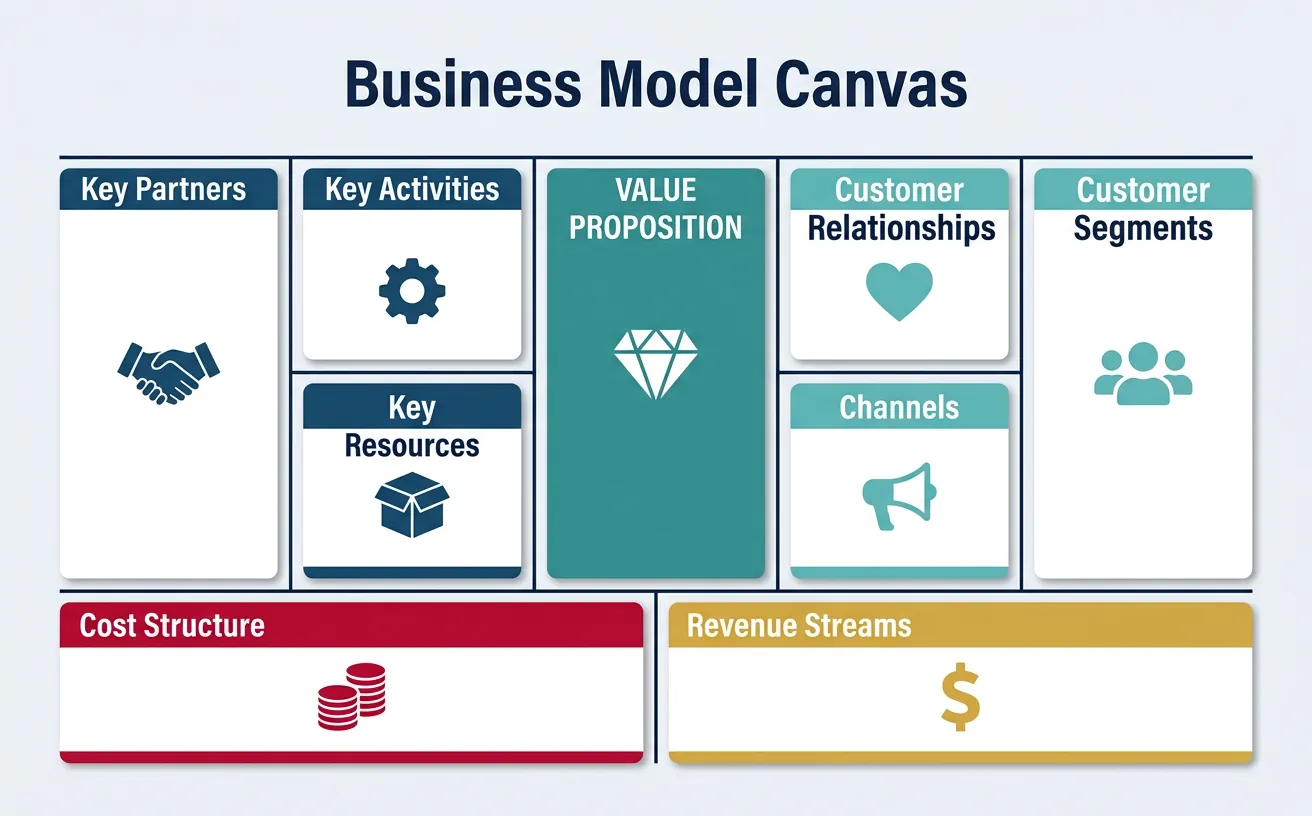
The 9 Building Blocks
┌─────────────────────────────────────────────────────────────────────────────┐
│                         BUSINESS MODEL CANVAS                                │
├──────────────┬──────────────┬──────────────┬──────────────┬─────────────────┤
│              │              │              │              │                 │
│  KEY         │  KEY         │  VALUE       │  CUSTOMER    │  CUSTOMER       │
│  PARTNERS    │  ACTIVITIES  │  PROPOSITION │  RELATION-   │  SEGMENTS       │
│              │              │              │  SHIPS       │                 │
│  Who helps   │  What we do  │  Why         │  How we      │  Who we serve   │
│  us deliver  │  to deliver  │  customers   │  interact    │                 │
│  value?      │  value       │  choose us   │  with        │                 │
│              ├──────────────┤              │  customers   │                 │
│              │              │              │              │                 │
│              │  KEY         │              ├──────────────┤                 │
│              │  RESOURCES   │              │              │                 │
│              │              │              │  CHANNELS    │                 │
│              │  What we     │              │              │                 │
│              │  need to     │              │  How we      │                 │
│              │  deliver     │              │  reach       │                 │
│              │  value       │              │  customers   │                 │
│              │              │              │              │                 │
├──────────────┴──────────────┴──────────────┴──────────────┴─────────────────┤
│                                                                             │
│  COST STRUCTURE                             REVENUE STREAMS                 │
│  What does it cost to operate?              How do we make money?           │
│                                                                             │
└─────────────────────────────────────────────────────────────────────────────┘
Value Proposition
The Value Proposition is the core of your business model—the reason customers choose you over alternatives.
We help [customer segment] to [job to be done] by [how we're different] unlike [alternatives].
Value Drivers
| Value Type | Description | Example |
|---|---|---|
| Newness | First-to-market solution | Tesla (first desirable electric car) |
| Performance | Better outcomes/speed | AWS (faster server deployment) |
| Customization | Tailored to individual needs | Nike By You (custom shoes) |
| Design | Superior aesthetics/UX | Apple (premium design) |
| Price | Lower cost for similar value | IKEA (affordable furniture) |
| Convenience | Easier to access/use | Uber (tap and ride) |
| Risk Reduction | Lower uncertainty | Certified pre-owned cars |
| Cost Reduction | Helps customers save money | Salesforce (no hardware investment) |
Customer Segments
Different groups of people or organizations you aim to reach and serve. Segments may have different needs, behaviors, or willingness to pay.
Segment Types
- Mass Market: One value proposition for broad market (Coca-Cola)
- Niche Market: Specialized segment with specific needs (Rolls-Royce)
- Segmented: Different but related segments (banks: retail vs. private banking)
- Diversified: Two unrelated segments (Amazon: consumers + AWS developers)
- Multi-sided Platform: Two or more interdependent segments (Uber: riders + drivers)
Channels
How you communicate with and reach your customer segments to deliver value.
CHANNEL PHASES:

Awareness → Evaluation → Purchase → Delivery → After-Sales
    │           │           │          │           │
    ▼           ▼           ▼          ▼           ▼
  Ads/PR    Free trial    Checkout   Shipping   Support
  Content   Demo/Sales    Payment    Download   Upsell
  Social    Reviews       Contract   Onboard    Referral
Channel Types
- Direct: Sales force, web sales, company stores
- Indirect: Partner stores, wholesalers, resellers
- Owned: Your website, app, physical locations
- Earned: Word-of-mouth, PR, organic search
- Paid: Advertising, affiliate programs
Revenue Streams
The cash a company generates from each customer segment. Revenue streams represent the ways you capture value from customers.
| Revenue Type | Description | Example |
|---|---|---|
| Asset Sale | Selling ownership of a product | Retail products, cars |
| Usage Fee | Charging per use/unit | Cloud computing (per GB) |
| Subscription | Recurring fee for access | Netflix, SaaS products |
| Lending/Licensing | Temporary access rights | Car rentals, software licenses |
| Brokerage | Commission on transactions | Real estate agents, stock brokers |
| Advertising | Charging for attention | Google, Facebook, media |
Cost Structure
All costs incurred to operate your business model. Understanding your cost structure is essential for profitability.
Cost Types
- Fixed Costs: Don't change with volume (rent, salaries, insurance)
- Variable Costs: Scale with volume (raw materials, commissions, cloud hosting)
- Economies of Scale: Cost per unit decreases as volume increases
- Economies of Scope: Cost decreases when offering multiple products
Business Model Focus
Cost-Driven                         Value-Driven
(Minimize costs)                    (Premium experience)
     │                                    │
     ▼                                    ▼
Low-price value proposition         Premium value proposition
Automation, outsourcing             High-touch service
Lean operations                     Quality over cost
Example: Ryanair, IKEA Example: Apple, Four SeasonsFill in the 9 building blocks and download your canvas as Word, Excel, or PDF.
All data stays in your browser. Nothing is sent to or stored on any server.
3. Lean Canvas
The Lean Canvas, created by Ash Maurya, adapts the Business Model Canvas specifically for startups. It replaces some blocks with more startup-relevant elements.
Lean Canvas vs Business Model Canvas
| Business Model Canvas | Lean Canvas | Why the Change |
|---|---|---|
| Key Partners | Problem | Startups need to nail the problem first |
| Key Activities | Solution | Focus on how you solve the problem |
| Key Resources | Key Metrics | What numbers matter for validation? |
| Customer Relationships | Unfair Advantage | What's defensible? Can't be copied. |
Lean Canvas Template
┌─────────────┬─────────────┬─────────────┬─────────────┬─────────────┐
│   PROBLEM   │  SOLUTION   │  UNIQUE     │  UNFAIR     │  CUSTOMER   │
│             │             │  VALUE      │  ADVANTAGE  │  SEGMENTS   │
│ Top 3       │ Top 3       │ PROPOSITION │             │             │
│ problems    │ features    │             │ Something   │ Target      │
│             │             │ Single,     │ that can't  │ customers   │
│ Existing    │             │ clear,      │ be easily   │             │
│ alternatives│             │ compelling  │ copied or   │ Early       │
│             │             │ message     │ bought      │ adopters    │
├─────────────┼─────────────┼─────────────┼─────────────┼─────────────┤
│             │  KEY        │             │  CHANNELS   │             │
│             │  METRICS    │             │             │             │
│             │             │             │ Path to     │             │
│             │ Numbers     │             │ customers   │             │
│             │ that matter │             │             │             │
├─────────────┴─────────────┴─────────────┴─────────────┴─────────────┤
│  COST STRUCTURE                          REVENUE STREAMS            │
│  Customer acquisition costs              Revenue model              │
│  Distribution costs                      Lifetime value             │
│  Hosting/People                          Pricing                    │
└─────────────────────────────────────────────────────────────────────┘
Exercise: Complete Your Lean Canvas
Fill this out in one sitting (20 minutes max). It should feel uncomfortable—that discomfort reveals what you don't know yet.
- Start with Customer Segments: Who has the problem?
- Move to Problem: What are their top 3 pains?
- Then Unique Value Proposition: Why you?
- Add Solution: How you solve each problem
- Identify Channels: How you reach customers
- Estimate Revenue Streams and Cost Structure
- Define Key Metrics: What numbers prove you're winning?
- Consider Unfair Advantage: What's defensible? (Often blank at first!)
Capture your startup idea in the Lean Canvas format. Download as Word, Excel, or PDF.
All data stays in your browser. Nothing is sent to or stored on any server.
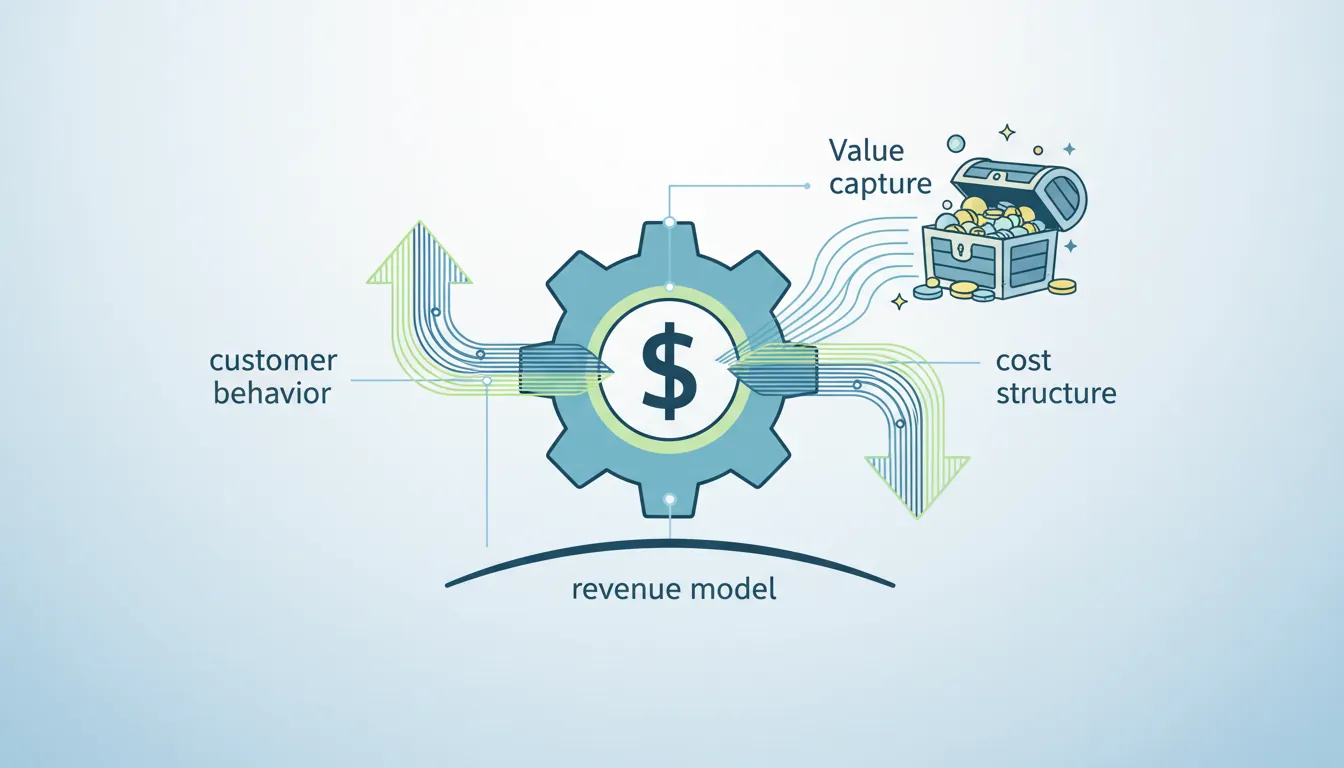
4. Revenue Model Design
Your revenue model defines how you capture value. The right model aligns with customer behavior, competitive dynamics, and your cost structure.
Subscription Model
Customers pay recurring fees (monthly/annually) for ongoing access to a product or service.
Predictable revenue, higher lifetime value, ongoing customer relationships, and easier to forecast/plan. Investors love recurring revenue!
Subscription Metrics
- MRR (Monthly Recurring Revenue): Monthly subscription revenue
- ARR (Annual Recurring Revenue): MRR × 12
- Churn Rate: % of customers who cancel per period
- Net Revenue Retention: Revenue from existing customers (including upsells - churn)
Freemium Model
Basic product is free; advanced features require payment. The free tier serves as customer acquisition.
Freemium Success Factors
| Factor | What Works | What Doesn't |
|---|---|---|
| Free Tier | Enough value to hook users | So limited it's unusable |
| Conversion Trigger | Natural usage limits (storage, users) | Arbitrary restrictions |
| Premium Features | Clear value for power users | Nice-to-haves nobody needs |
| Conversion Rate | 2-5% typical; 10%+ excellent | <1% = broken model |
Examples: Spotify (ads → premium), Dropbox (storage limits), Slack (message history), Zoom (40-min limit)
Marketplace Model
Connect buyers and sellers, taking a commission on transactions. The challenge is solving the "chicken and egg" problem.
Marketplace Dynamics
                    MORE SELLERS
                         │
                         ▼
┌─────────────────────────────────────────┐
│                                         │
│   ┌───────────┐         ┌───────────┐  │
│   │  BUYERS   │ ◄─────► │  SELLERS  │  │
│   │           │         │           │  │
│   │ More      │         │ More      │  │
│   │ selection │         │ customers │  │
│   │ = more    │         │ = more    │  │
│   │ value     │         │ sales     │  │
│   └───────────┘         └───────────┘  │
│                                         │
└─────────────────────────────────────────┘
                         │
                         ▼
                    MORE BUYERS

          = NETWORK EFFECTS (Moat!)
Revenue Models
- Take Rate: % of each transaction (Uber ~25%, Airbnb ~14%)
- Listing Fee: Charge sellers to list (eBay)
- Featured Placement: Promoted listings (Amazon, Etsy)
- Subscription: Seller membership (Amazon FBA)
SaaS (Software as a Service)
Cloud-hosted software accessed via subscription. The dominant model for B2B software.
SaaS Metrics That Matter
┌─────────────────────────────────────────────────────┐
│                    SaaS METRICS                      │
├──────────────┬──────────────────────────────────────┤
│ GROWTH       │ MRR, ARR, Customer Growth Rate       │
├──────────────┼──────────────────────────────────────┤
│ RETENTION    │ Logo Churn, Revenue Churn, NRR       │
├──────────────┼──────────────────────────────────────┤
│ EFFICIENCY   │ CAC, LTV, LTV:CAC Ratio, Payback     │
├──────────────┼──────────────────────────────────────┤
│ ENGAGEMENT   │ DAU/MAU, Feature Adoption, NPS       │
└──────────────┴──────────────────────────────────────┘

Rule of 40: Growth Rate + Profit Margin ≥ 40% = Healthy SaaS
5. B2C, B2B & B2P Business Models
Understanding who you sell to fundamentally changes everything—your product design, marketing strategy, sales process, and organizational structure. Let's break down the three major business model types and help you choose the right approach for your venture.
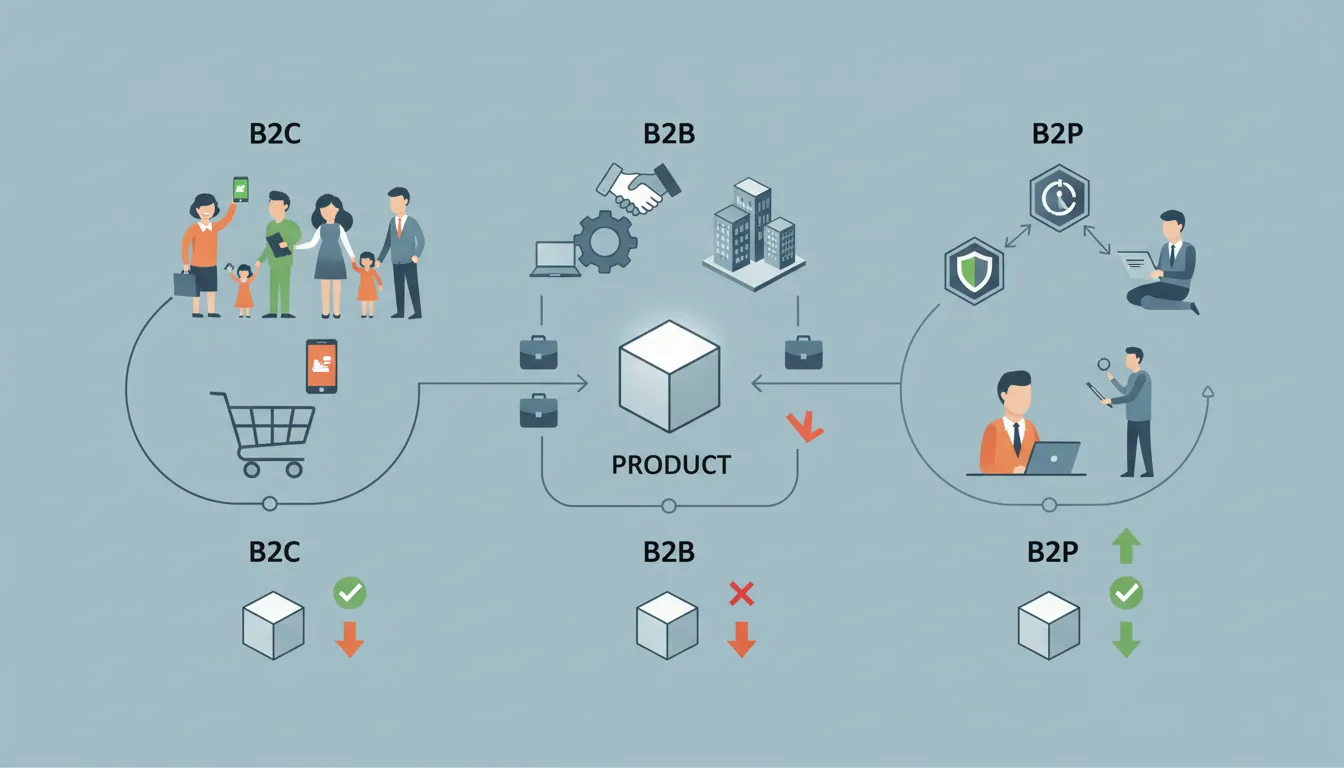
Think of these models as different "languages" of business. B2C speaks to emotions and convenience. B2B speaks to ROI and efficiency. B2P speaks to ecosystem value and partnership. The same product might succeed with one approach and fail with another.
B2C (Business-to-Consumer)
B2C means selling products or services directly to individual consumers for personal use. You're competing for attention, convenience, and emotional connection.
B2C Characteristics
B2C BUSINESS MODEL OVERVIEW:

TARGET:           Individual consumers
DECISION MAKER:   Single person (or household)
SALES CYCLE:      Minutes to days
DEAL SIZE:        $1 - $500 typical (can be higher for luxury)
VOLUME:           High volume, lower margin per sale
EMOTION FACTOR:   High (brand, design, convenience matter)

EXAMPLES:
├── Amazon (e-commerce)
├── Netflix (streaming)
├── Spotify (music)
├── Nike (apparel)
├── Uber (transportation)
└── Duolingo (education)
B2C Success Factors
| Factor | Why It Matters | Example |
|---|---|---|
| Brand & Trust | Consumers buy from brands they recognize | Apple's brand commands premium pricing |
| User Experience | Friction kills conversions | Amazon's 1-click checkout |
| Emotional Appeal | Decisions driven by feelings | Nike's "Just Do It" inspiration |
| Price Sensitivity | Consumers compare prices easily | Price comparison sites, Amazon reviews |
| Viral Potential | Word-of-mouth scales quickly | TikTok, Instagram shareability |
B2C Marketing Strategies
- Social Media Marketing: Instagram, TikTok, YouTube for brand awareness
- Influencer Partnerships: Leverage trusted voices in your niche
- Content Marketing: Blog posts, videos, tutorials that attract organic traffic
- Paid Advertising: Facebook/Instagram ads, Google Shopping, display ads
- Referral Programs: Turn happy customers into advocates (Dropbox, Uber)
- Email Marketing: Nurture relationships with personalized campaigns
B2C Key Metrics
ESSENTIAL B2C METRICS:

ACQUISITION:
├── Customer Acquisition Cost (CAC)
├── Conversion Rate (visitors → customers)
├── Cost Per Click (CPC) / Cost Per Mille (CPM)
└── Organic vs. Paid Traffic Ratio

ENGAGEMENT:
├── Daily/Monthly Active Users (DAU/MAU)
├── Session Duration & Pages per Visit
├── Cart Abandonment Rate
└── Net Promoter Score (NPS)

RETENTION:
├── Customer Retention Rate
├── Churn Rate (monthly/annual)
├── Repeat Purchase Rate
└── Customer Lifetime Value (LTV)

REVENUE:
├── Average Order Value (AOV)
├── Revenue per User (ARPU)
├── Gross Margin
└── LTV:CAC Ratio (target: 3:1+)
B2C Case Study: Warby Parker
The Problem: Glasses were expensive ($300+) and buying them was a terrible experience.
B2C Innovation:
- Direct-to-consumer model: Cut out middlemen, $95 frames
- Home Try-On: 5 frames shipped free, try for 5 days
- Social proof: Customers share photos wearing frames
- Buy-one-give-one: Social mission creates emotional connection
Result: $3B+ valuation, disrupted the eyewear industry
B2B (Business-to-Business)
B2B means selling products or services to other businesses. You're solving business problems—saving money, increasing revenue, reducing risk, or improving efficiency.
B2B Characteristics
B2B BUSINESS MODEL OVERVIEW:

TARGET:           Companies and organizations
DECISION MAKER:   Multiple stakeholders (buyer, user, influencer, executive)
SALES CYCLE:      Weeks to months (or years for enterprise)
DEAL SIZE:        $1,000 - $1,000,000+/year
VOLUME:           Lower volume, higher margin per deal
EMOTION FACTOR:   Lower (ROI, efficiency, risk reduction matter)

EXAMPLES:
├── Salesforce (CRM)
├── Slack (collaboration)
├── AWS (cloud infrastructure)
├── HubSpot (marketing)
├── Zoom (video conferencing)
└── Stripe (payments)
B2B Sales Motion Types
| Motion | Deal Size | Sales Cycle | Example |
|---|---|---|---|
| Self-Serve | $0-$500/mo | Same day | Slack free tier, Notion, Canva |
| Inside Sales | $500-$10K/mo | 1-4 weeks | HubSpot, Zendesk |
| Field Sales | $10K-$100K/mo | 1-6 months | Salesforce, Workday |
| Enterprise | $100K+/mo | 6-18 months | SAP, Oracle, large AWS deals |
B2B Success Factors
- Quantifiable ROI: Can you prove you save/make money for customers?
- Integration & Compatibility: Does it work with existing tools?
- Security & Compliance: Enterprise buyers need SOC 2, GDPR, HIPAA
- Customer Success: B2B relationships require ongoing support
- Champions Inside: You need internal advocates to push deals forward
- Multi-stakeholder Buy-in: IT, Finance, Legal, and users all have a say
B2B Marketing Strategies
- Content Marketing: Whitepapers, case studies, webinars (thought leadership)
- SEO & Inbound: Capture demand when buyers are researching solutions
- Account-Based Marketing (ABM): Target specific high-value accounts
- Events & Conferences: Industry presence builds credibility
- LinkedIn: Primary social platform for B2B reach
- Partner Channels: Resellers, consultants, integrators
B2B Key Metrics
ESSENTIAL B2B METRICS:

PIPELINE:
├── Marketing Qualified Leads (MQLs)
├── Sales Qualified Leads (SQLs)
├── Pipeline Value ($)
└── Win Rate (%)

SALES:
├── Average Contract Value (ACV)
├── Annual Recurring Revenue (ARR)
├── Sales Cycle Length (days)
└── Quota Attainment (%)

RETENTION:
├── Net Revenue Retention (NRR) - target: 100%+
├── Gross Revenue Retention
├── Logo Churn Rate
└── Expansion Revenue (upsells, cross-sells)

EFFICIENCY:
├── CAC Payback Period (months)
├── LTV:CAC Ratio (target: 3:1+)
├── Magic Number (ARR growth efficiency)
└── Rule of 40 (growth + margin)
B2B Case Study: Slack
The Strategy: Product-Led Growth (PLG) with enterprise upsell
B2B Innovation:
- Freemium model: Teams start free, hit limits, upgrade
- Viral within companies: One user invites team, team invites org
- Bottom-up adoption: Users love it, then IT buys enterprise
- Integrations: 2,400+ apps make Slack the "hub"
Result: Acquired by Salesforce for $27.7B. 750K+ paying organizations.
B2P (Business-to-Platform/Partner)
B2P describes businesses that create value by enabling other businesses to build on or integrate with their platform. You're not just selling a product—you're creating an ecosystem.
B2P (also called Platform Business or Ecosystem Business) is when your primary customers are other businesses who use your platform to serve their customers. Think APIs, marketplaces, developer platforms, and white-label solutions.
B2P Characteristics
B2P BUSINESS MODEL OVERVIEW:

TARGET:           Businesses, developers, partners
VALUE CREATED:    Enable others to build/innovate on your platform
NETWORK EFFECTS:  Strong (more partners = more value = more partners)
REVENUE MODEL:    Transaction fees, API usage, revenue share, licensing
COMPLEXITY:       High (multi-sided relationships)

EXAMPLES:
├── Stripe (payment infrastructure for apps)
├── Shopify (e-commerce platform for merchants)
├── Twilio (communication APIs for developers)
├── AWS (cloud infrastructure for companies)
├── Salesforce AppExchange (ecosystem for apps)
└── Apple App Store (distribution for developers)
Types of B2P Models
| Type | Description | Revenue Model | Example |
|---|---|---|---|
| API Platform | Provide infrastructure via APIs | Usage-based, tiered pricing | Stripe, Twilio, Plaid |
| Marketplace | Connect buyers and sellers | Transaction fees (10-30%) | Airbnb, Uber, Etsy |
| App Store | Distribution for third-party apps | Revenue share (15-30%) | Apple, Google Play, Salesforce |
| White-Label | Product resold under partner's brand | Licensing, revenue share | Plaid, Marqeta, banking-as-a-service |
| Developer Platform | Tools for developers to build | Freemium + usage | AWS, Firebase, Vercel |
B2P Success Factors
- Developer Experience (DX): Easy integration, great documentation, fast time-to-value
- Reliability & Uptime: Partners depend on you; downtime = their revenue loss
- Fair Economics: Partners must profit for the ecosystem to thrive
- Network Effects: More partners = more value for everyone
- Partner Support: Dedicated resources for top partners
- Governance: Clear rules, fair treatment, conflict resolution
B2P Key Metrics
ESSENTIAL B2P METRICS:

ECOSYSTEM:
├── Number of Active Partners/Developers
├── Partner Revenue/GMV (Gross Merchandise Value)
├── Average Revenue per Partner
└── Partner Net Promoter Score (NPS)

PLATFORM:
├── API Call Volume
├── Uptime/Reliability (99.9%+ SLA)
├── Time to First API Call
└── Integration Completion Rate

GROWTH:
├── New Partner Sign-ups
├── Partner Activation Rate
├── Partner Churn Rate
└── Network Effect Score

ECONOMICS:
├── Take Rate (your % of transactions)
├── Platform Revenue
├── Partner Lifetime Value
└── Platform CAC (cost to acquire partners)
B2P Case Study: Stripe
The Strategy: Make payments infrastructure so good that developers choose Stripe by default.
B2P Innovation:
- Developer-first: 7 lines of code to accept payments
- World-class documentation: Developers can self-serve
- Platform economics: Stripe Connect lets platforms onboard sellers
- Expanding ecosystem: Billing, Atlas, Terminal, Treasury
Result: $95B+ valuation. Powers payments for millions of businesses including Shopify, Lyft, and Amazon.
Choosing Your Model: B2C vs B2B vs B2P
Here's how to think about which model is right for your startup:
| Dimension | B2C | B2B | B2P |
|---|---|---|---|
| Deal Size | $1-$500/year | $1K-$1M+/year | Variable (% of partner revenue) |
| Sales Cycle | Minutes to days | Weeks to months | Weeks to months (plus integration) |
| Decision Maker | Individual | Multiple stakeholders | Technical + business teams |
| Key Success Factor | Brand, UX, virality | ROI, relationships, trust | DX, reliability, ecosystem value |
| Marketing | Ads, influencers, viral | Content, events, ABM | Developer marketing, partnerships |
| Customer Acquisition | High volume, low touch | Low volume, high touch | Medium volume, technical touch |
| Retention Power | Variable (easy to churn) | High (contracts, switching costs) | Very high (deep integrations) |
| Funding Appeal | Scale story, viral metrics | ARR, retention metrics | Network effects, GMV growth |
Decision Framework: Which Model is Right for You?
ASK YOURSELF:

1. WHO HAS THE PROBLEM YOU'RE SOLVING?
   ├── Individuals → Consider B2C
   ├── Companies → Consider B2B
   └── Other businesses serving customers → Consider B2P

2. HOW COMPLEX IS YOUR SOLUTION?
   ├── Simple (consumer can self-serve) → B2C
   ├── Complex (needs explanation/support) → B2B
   └── Technical (requires integration) → B2P

3. WHAT'S YOUR DISTRIBUTION ADVANTAGE?
   ├── Viral potential, brand appeal → B2C
   ├── Industry expertise, relationships → B2B
   └── Technical moat, ecosystem effects → B2P

4. WHAT ARE YOUR FOUNDERS' STRENGTHS?
   ├── Marketing, brand, consumer insight → B2C
   ├── Sales, industry knowledge → B2B
   └── Technical, API/platform experience → B2P

HYBRID MODELS:
Many successful companies combine models:
• Shopify: B2B (merchants) + B2P (developers/partners)
• Slack: B2C-like adoption + B2B enterprise sales
• Amazon: B2C (retail) + B2B (AWS) + B2P (marketplace)Don't try to be everything at once. Start with ONE model, master it, then expand. Slack started as B2C-like adoption, then added B2B enterprise sales. Shopify started B2B (merchants), then added B2P (developer platform).
6. Unit Economics
Unit economics measure the direct revenues and costs associated with a single customer or unit. This is how you know if your business model actually works.
Customer Acquisition Cost (CAC)
The total cost to acquire one new customer.
CAC = Total Sales & Marketing Costs / Number of New Customers

Example:
  Marketing spend:        $50,000
  Sales salaries:         $30,000
  Software/tools:         $5,000
  ─────────────────────────────────
  Total S&M:              $85,000
  New customers:          100
  ─────────────────────────────────
  CAC = $85,000 / 100 = $850 per customer
CAC by Channel
Break down CAC by acquisition channel to identify what's working:
- Google Ads: $120 CAC (but lower LTV customers)
- Content/SEO: $40 CAC (but takes time to build)
- Referrals: $25 CAC (best quality, hardest to scale)
- Sales team: $500 CAC (but highest LTV customers)
Lifetime Value (LTV)
The total revenue you expect from a customer over their entire relationship with you.
Simple LTV = Average Revenue Per User × Customer Lifetime

LTV (with churn) = ARPU / Churn Rate

Example:
  Monthly subscription:   $50
  Monthly churn rate:     3%
  ─────────────────────────────────
  LTV = $50 / 0.03 = $1,667
The LTV:CAC Ratio
LTV:CAC Ratio = Lifetime Value / Customer Acquisition Cost

Benchmarks:
  < 1:1    = Losing money on every customer (fix immediately!)
  1:1      = Breaking even (not sustainable)
  3:1      = Healthy (industry standard target)
  5:1+     = Excellent (consider investing more in growth)
> 5:1 = Potentially under-investing in marketingA 3:1 ratio sounds great, but if your CAC is $1,000 and LTV is $3,000 over 3 years, you're waiting 3 years to see profit. Cash flow matters!
Gross Margins
Gross margin measures how much profit you make on each dollar of revenue after direct costs.
Gross Margin = (Revenue - Cost of Goods Sold) / Revenue × 100%

Example (SaaS company):
  Revenue:                $100,000
  COGS:
    - Hosting:            $8,000
    - Support:            $12,000
    - Payment fees:       $3,000
  ─────────────────────────────────
  Total COGS:             $23,000
  Gross Profit:           $77,000
  Gross Margin:           77%

Typical Gross Margins by Business Type:
  SaaS:           70-85%
  Marketplace:    60-80%
  E-commerce:     30-50%
  Hardware:       25-40%
  Services:       50-70%
Payback Period
How long until you recover your CAC from a customer's gross profit.
CAC Payback Period = CAC / (ARPU × Gross Margin)

Example:
  CAC:                    $850
  Monthly ARPU:           $100
  Gross Margin:           75%
  ─────────────────────────────────
  Monthly Gross Profit:   $75
  Payback Period:         $850 / $75 = 11.3 months

Benchmarks:
  < 12 months:   Excellent (can grow aggressively)
  12-18 months:  Good (sustainable growth)
  18-24 months:  Concerning (watch cash carefully)
  > 24 months:   Problem (fix unit economics first)
Unit Economics Calculator
Calculate your per-customer profitability: LTV, CAC, payback period, and LTV:CAC ratio.
All data stays in your browser. Nothing is sent to or stored on any server.
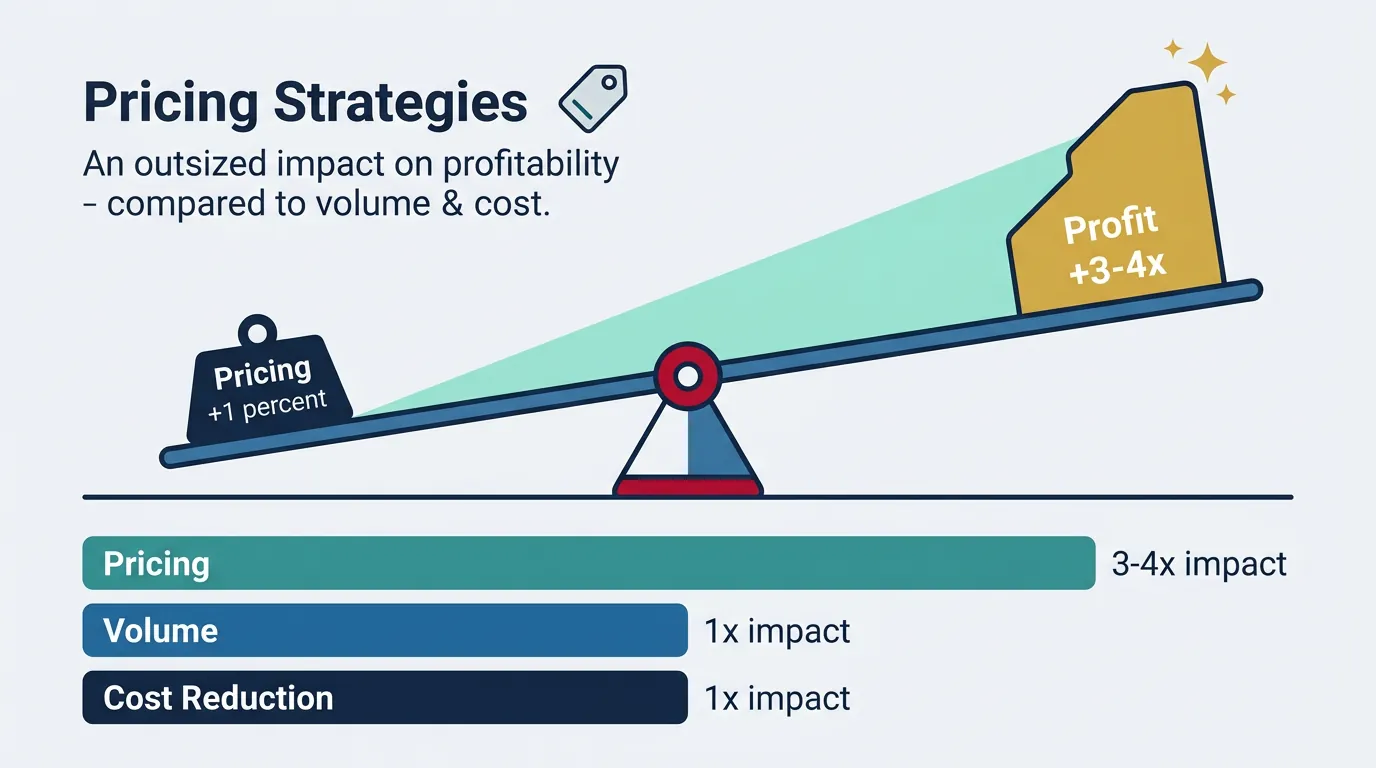
7. Pricing Strategies
Pricing is one of the most powerful levers in business. A 1% improvement in pricing typically has 3-4x the impact on profit compared to 1% improvements in volume or cost.
Value-Based Pricing
Price based on the value delivered to customers, not your costs. The gold standard for B2B and premium products.
Value-Based Pricing Framework
Step 1: Quantify Customer Value
  "Our software saves 10 hours/week per employee"
  10 hrs × $50/hr × 52 weeks = $26,000/year value

Step 2: Capture Portion of Value
  Typical capture rate: 10-30% of value delivered
  Price: $2,600 - $7,800/year

Step 3: Validate with Customers
  "Would you pay $5,000/year to save $26,000?"
  (Most say yes if they believe the value claim)
Penetration Pricing
Start with low prices to gain market share quickly, then raise prices over time.
- Best for: Network effects, winner-take-all markets, commoditized products
- Risk: May attract price-sensitive customers who churn when prices rise
- Example: Uber (subsidized rides to build network), Netflix (low initial pricing)
Price Skimming
Start with high prices targeting early adopters, then lower prices over time to reach broader market.
- Best for: Innovative products, strong brand, limited competition
- Risk: May attract competitors, early customers may feel cheated
- Example: iPhone launches (premium at launch, older models discounted)
Pricing Psychology
| Tactic | How It Works | Example |
|---|---|---|
| Anchoring | Show higher price first | "Was $199, now $99" |
| Charm Pricing | End in 9 or 7 | $9.99 feels cheaper than $10 |
| Decoy Effect | Add inferior option to push to target | Small $3, Medium $6.50, Large $7 |
| Price Tiering | Good/Better/Best options | Basic $9, Pro $29, Enterprise $99 |
| Bundling | Combine products at discount | Microsoft 365 (Word + Excel + etc.) |
Exercise: Price Your Product
- Calculate your costs: What's your floor price?
- Research competitors: What's the market range?
- Quantify your value: What's the customer ROI?
- Design 3 tiers: Create Good/Better/Best options
- Test with customers: Share pricing and gauge reactions
- Iterate: Pricing is never final—optimize over time
8. Conclusion & Next Steps
With your business model defined, you're ready to implement Lean Startup methodology to rapidly test and iterate on your assumptions.