We use cookies to enhance your browsing experience, serve personalized content, and analyze our traffic.
By clicking "Accept All", you consent to our use of cookies. See our
Privacy Policy
for more information.
Behavioral & Consumer Economics: 13 Laws for Demand Creation
January 24, 2026Wasil Zafar60 min read
Master how psychology, information asymmetry, and cognitive biases drive real-world consumer decisions—unlocking pricing power, adoption barriers, and demand creation strategies. Part 5 of our 8-part Economics for Business Strategy series.
Traditional economics assumes rational actors with perfect information making optimal choices. But in reality, consumers are irrational, information is asymmetric, and decisions are driven by biases, heuristics, and emotions. This is the domain of behavioral economics—where psychology meets market forces to explain how people actually behave.
These 13 laws explain why Amazon's $79 Prime membership feels like a bargain despite costing more than Netflix, how Apple creates switching costs that lock in customers, why Uber's surge pricing triggers outrage while airline dynamic pricing doesn't, and how Netflix exploits habit formation to reduce churn. From information asymmetry in used car markets to anchoring in SaaS pricing to loss aversion in subscription cancellations—understanding behavioral economics is essential for pricing strategy, product adoption, and demand creation.
Information Economics: How asymmetry creates market failures and what signals overcome trust barriers
Cognitive Biases: Leveraging anchoring, loss aversion, and bounded rationality in pricing and positioning
Consumer Lock-In: Building switching costs, habit formation, and reference prices to reduce churn
Demand Creation: Using substitution effects and long tail economics to expand addressable markets
Behavioral Pricing: How to frame prices, bundle offerings, and structure trials to maximize conversion
Let's begin with the foundational problem that plagues every market: information asymmetry.
39. Information Asymmetry: When One Party Knows More
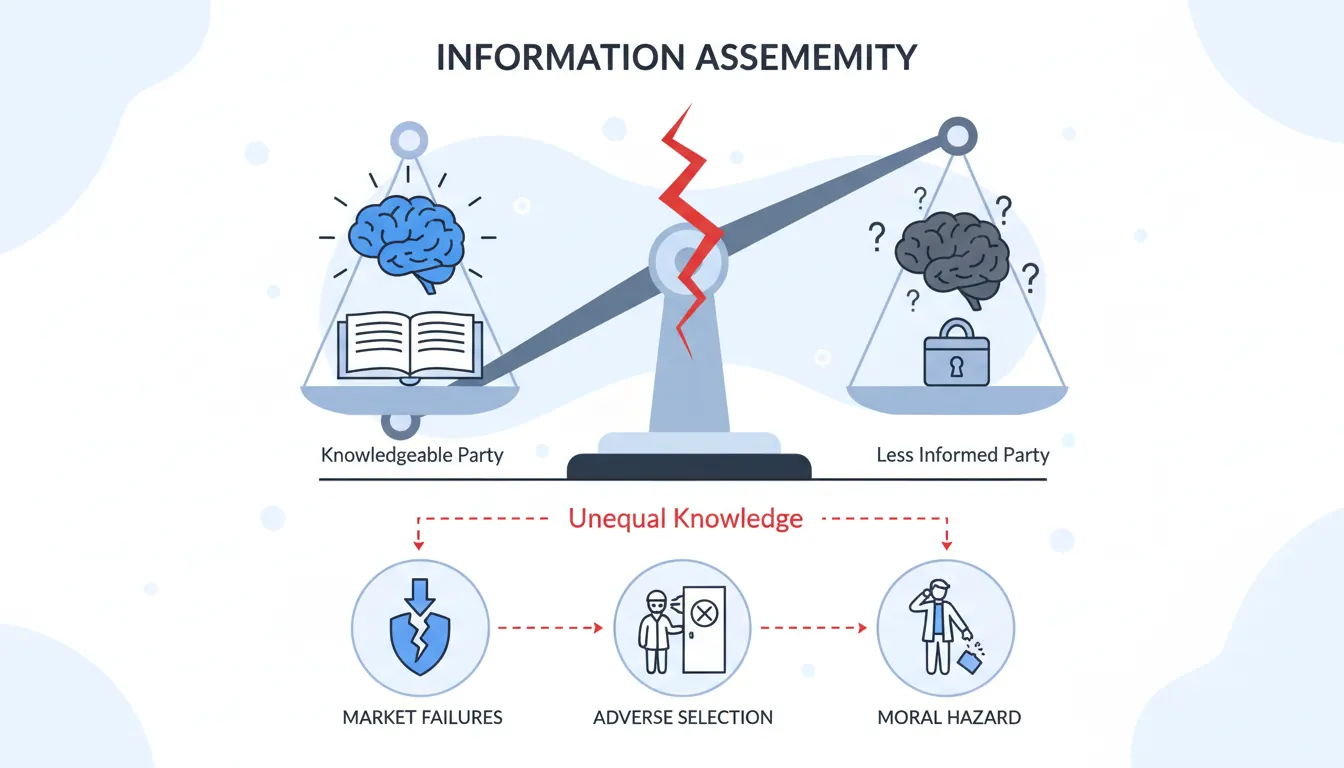
Core Principle: Information asymmetry occurs when one party in a transaction has more or better information than the other. Creates market failures—buyers/sellers can't accurately price goods/services, leading to adverse selection, moral hazard, and market breakdown. Solution: signaling, screening, warranties, reputation systems.
Figure: Information asymmetry diagram showing how unequal knowledge between parties creates market failures, adverse selection, and moral hazard.
Real-World Application: Used Car Market ("Market for Lemons")
Asymmetric Information
Why Used Car Market Has Quality Problems
Setup: Seller knows car's true quality ("lemon" vs. "peach"). Buyer can't observe quality before purchase—asymmetric information.
Result: Buyers assume average quality, offer average price ($10,000).
Adverse selection: Sellers with "peaches" (worth $15,000) refuse to sell at $10,000—only "lemons" (worth $5,000) enter market.
Buyer updates: Realizes only lemons sell, lowers offer to $6,000. Cycle repeats until only worst lemons trade.
Market Solutions:
Warranties: Sellers signal quality by offering money-back guarantees (costly for lemon-sellers)
Third-party inspections: Carfax reports reduce information asymmetry
Reputation platforms: eBay, Carvana ratings help buyers identify trustworthy sellers
Information AsymmetryMarket Failure
Business Applications
For Product Teams: Reduce information asymmetry to improve conversion. Free trials (SaaS), money-back guarantees (e-commerce), transparent pricing (eliminate hidden fees), detailed specs/demos. The more buyers know, the less they discount for risk—raises willingness to pay.
For Hiring Teams: Candidates know more about their abilities than employers (information asymmetry). Solution: screening (technical tests, work samples), signaling (degrees from top schools, work history at reputable firms), probation periods (observe performance before full commitment). Google's multi-round interviews reduce asymmetry—test coding, system design, cultural fit.
Reducing Information Asymmetry Signaling: High-quality party sends costly, observable signal (warranty, certification) Screening: Less-informed party gathers information (tests, inspections, references) Reputation systems: Past behavior predicts future quality (reviews, ratings, credentials) Disclosure requirements: Regulations force information sharing (financial statements, ingredient lists)
40. Adverse Selection: When Bad Risks Drive Out Good Ones
Core Principle: Adverse selection occurs before a transaction when information asymmetry causes one party to systematically choose against the other's interest. In insurance/lending, high-risk customers more eager to buy (they know their risk), while low-risk customers opt out—leading to market collapse as pool worsens.
Real-World Application: Health Insurance Markets
Insurance Market Failure
Why Individual Health Insurance Markets Collapse
Asymmetry: Individuals know their health better than insurers
Year 1: Insurer prices policy at $500/month based on average risk
Adverse selection: Healthy people skip insurance (low expected value), sick people buy (high expected value)
Year 2: Pool is sicker than expected ? insurer raises price to $700/month
Death spiral: Higher price ? more healthy people drop out ? even sicker pool ? higher prices ? repeat until market collapses
Solutions:
Mandatory coverage: ACA individual mandate forced healthy people into pool
Employer pools: Group coverage dilutes adverse selection
Underwriting: Medical exams reveal information (but creates access problems)
Adverse SelectionRisk Pooling
Business Applications
For Subscription Businesses: Prevent adverse selection through screening. Gym memberships work because overconfident people sign up but rarely go—if only serious athletes signed up, economics wouldn't work. SaaS free trials: conversion rates matter more than usage during trial.
For Lending Platforms: Combat adverse selection with data. High-risk borrowers most eager for loans. Solution: credit scoring, alternative data (Affirm, Klarna use transaction history), behavioral signals to identify good risks.
Mitigating Adverse Selection Screening mechanisms: Tests, requirements, data analysis to reveal risk Risk-based pricing: Charge high-risk customers more (if you can identify them) Mandatory participation: Force low-risk into pool (employer insurance, car insurance mandates) Reputation systems: Past behavior predicts future risk (credit scores, reviews)
41. Moral Hazard: When Protection Encourages Risky Behavior
Core Principle: Moral hazard occurs after a transaction when one party takes more risks because another party bears the cost. Insurance changes incentives—protected parties behave more recklessly because they don't face full consequences.
Real-World Application: 2008 Financial Crisis
Systemic Risk
"Too Big to Fail" = Moral Hazard at Scale
Moral Hazard Dynamic:
Banks' belief: Government will bail us out if we fail (implicit guarantee)
Changed incentives: Take extreme risks with leverage (40:1 debt-to-equity ratios)
Why rational: Heads I win (bonuses from profits), tails taxpayers lose (bailout if fails)
Result: $700B TARP bailout proved banks right—reinforced moral hazard
Solutions Implemented:
Dodd-Frank: Higher capital requirements reduce leverage
Living wills: Banks must plan for orderly bankruptcy (make failure possible)
Clawback provisions: Executives must return bonuses if risks materialize
Moral HazardIncentive Alignment
Business Applications
For HR Teams: Design incentives to minimize moral hazard. Stock options with vesting cliffs prevent employees from taking extreme short-term risks then quitting. Performance reviews based on sustainable metrics (customer retention) not just revenue.
For Procurement: Fixed-price contracts reduce moral hazard vs. cost-plus. Cost-plus incentivizes vendor to inflate hours/expenses (you pay regardless). Fixed-price aligns incentives—vendor eats cost overruns.
Controlling Moral Hazard Monitoring: Audits, oversight, inspections to detect risky behavior Deductibles/copays: Protected party shares some risk (insurance deductibles) Performance bonds: Post collateral that's forfeited if misbehavior occurs Reputation effects: Future business depends on good behavior today
42. Signaling Theory: Costly Actions Reveal Private Information
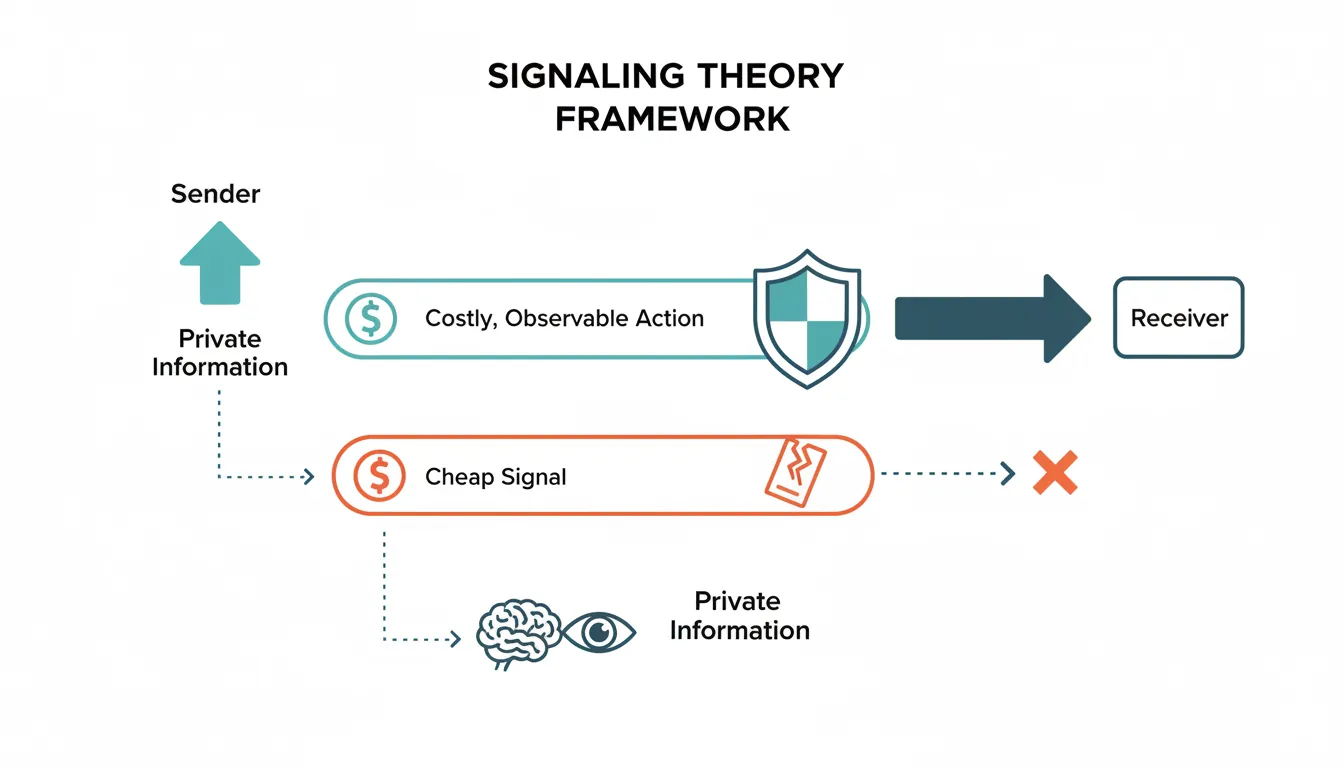
Core Principle: Signaling uses costly, observable actions to credibly communicate private information. Cheap signals are ignored (cheap talk). Expensive signals are believable because only those with true quality can afford them.
Figure: Signaling theory framework illustrating how costly, observable actions credibly communicate private information — cheap signals are ignored while expensive signals are believable.
Real-World Application: College Degrees as Signals
Labor Market Signaling
Why Employers Pay Harvard Grads More
Signaling Value of Elite Degrees:
Cost: 4 years, $300K+ tuition, opportunity cost of working
What it signals: Intelligence (got admitted), conscientiousness (graduated), conformity (completed requirements)
Why costly matters: Only capable students can complete degree ? degree credibly signals capability
Paradox: Skills learned may be less valuable than the signal itself (much of knowledge not used on job)
Signaling Theory Critique of Education:
If education purely signaling (not skill-building), society wastes resources on credential arms race
Reality: likely mix of signaling + human capital development
SignalingCredentials
Business Applications
For Marketing Teams: Use costly signals to prove quality. Money-back guarantees (costly if product is bad), free trials (expensive for low-quality products), celebrity endorsements (expensive)—all signal confidence in quality.
For Fundraising: Lead investors signal quality to followers. When a16z leads Series A, it signals to other VCs that startup was rigorously vetted. Cost to a16z: reputation at stake if investment fails. Signal is credible because cost is high.
Effective Signaling Requirements Observable: Others must see the signal (public action, credential) Costly: Must be expensive for low-quality types to fake Correlated with quality: Signal must be easier for high-quality types to send Examples: Warranties, certifications, brand advertising, lead investor participation
43. Anchoring Effect: First Number Sets the Baseline
Core Principle: The first number mentioned in a negotiation or pricing discussion heavily influences final outcome, even if that number is arbitrary. People insufficiently adjust from initial anchors. "Is this painting worth $10,000?" vs. "Is it worth $1,000?" leads to radically different valuations.
Real-World Application: SaaS Pricing Pages
Pricing Psychology
How High Anchors Boost Revenue
Strategy: Show Enterprise Tier First (Decoy Pricing)
Enterprise tier: $500/user/month (anchor)
Pro tier: $50/user/month (looks cheap compared to $500)
Starter tier: $10/user/month
Psychological Effect:
Without anchor: $50 seems expensive ? customers choose $10 tier
With $500 anchor: $50 seems reasonable ? customers choose Pro tier (5x revenue)
Evidence: A/B tests show 30-40% revenue increase from high anchor display
AnchoringPricing Psychology
Business Applications
For Sales Teams: Set high anchors in negotiations. Start with ambitious ask, let counterparty negotiate down. Final price will be higher than if you started with reasonable offer. Real estate: sellers overprice deliberately, knowing anchoring will pull final price up.
For Product Teams: Display pricing high-to-low on pricing pages. Shows expensive options first, makes mid-tier seem affordable. Restaurants list expensive wines first—makes $50 bottle seem reasonable after seeing $200 options.
Setup: September 2017 iPhone X launch: $999 starting price (first iPhone >$1000). Previous flagship iPhone 7 Plus: $769. Simultaneously launched iPhone 8 ($699) and 8 Plus ($799). Strategic anchoring: $999 iPhone X makes $799 iPhone 8 Plus seem "reasonable," even though 8 Plus costs $30 more than previous year's flagship.
Anchoring Mechanism: (1) High anchor ($999) resets consumer expectations—"flagship iPhones cost $1000 now." (2) iPhone 8 positioned as "value" option despite being most expensive iPhone 8-series ever. (3) Media coverage focused on $999 price, not $699 baseline. (4) Face ID, OLED screen, new design justified premium—but psychological anchor did heavy lifting.
Result: iPhone ASP (Average Selling Price): $695 (FY2017, pre-iPhone X) ? $796 (FY2018) ? $809 (FY2019) = 16% increase despite flat unit sales. Revenue impact: iPhone revenue $141B (FY2017) ? $166B (FY2018) ? $142B (FY2019, unit sales declined but ASP held). Total incremental revenue from anchoring-driven ASP increases: ~$30B+ over 3 years. Customer behavior: iPhone X became best-selling model (outsold iPhone 8/8 Plus combined)—consumers chose "premium" option, anchored by $999 price.
Long-Term Impact: $999 anchor normalized high iPhone pricing. iPhone 11 Pro Max (2019): $1,099. iPhone 14 Pro Max (2022): $1,099. iPhone 15 Pro Max (2023): $1,199. Consumers no longer shocked by $1000+ iPhones—anchored expectations. Android competitors followed: Samsung Galaxy S22 Ultra $1,199, Google Pixel 7 Pro $899. iPhone X's $999 anchor reset entire smartphone industry pricing. Key lesson: strategic anchor creates new pricing paradigm—customers judge future prices relative to anchor, not absolute value.
Using Anchoring Ethically First offer advantage: Set anchor in your favor before negotiation begins Reference prices: Show "original price" crossed out next to sale price Extreme alternatives: Include very expensive option to make target price seem moderate Warning: Absurdly high anchors backfire—must be within plausibility range
44. Loss Aversion: Losses Hurt Twice as Much as Gains Feel Good
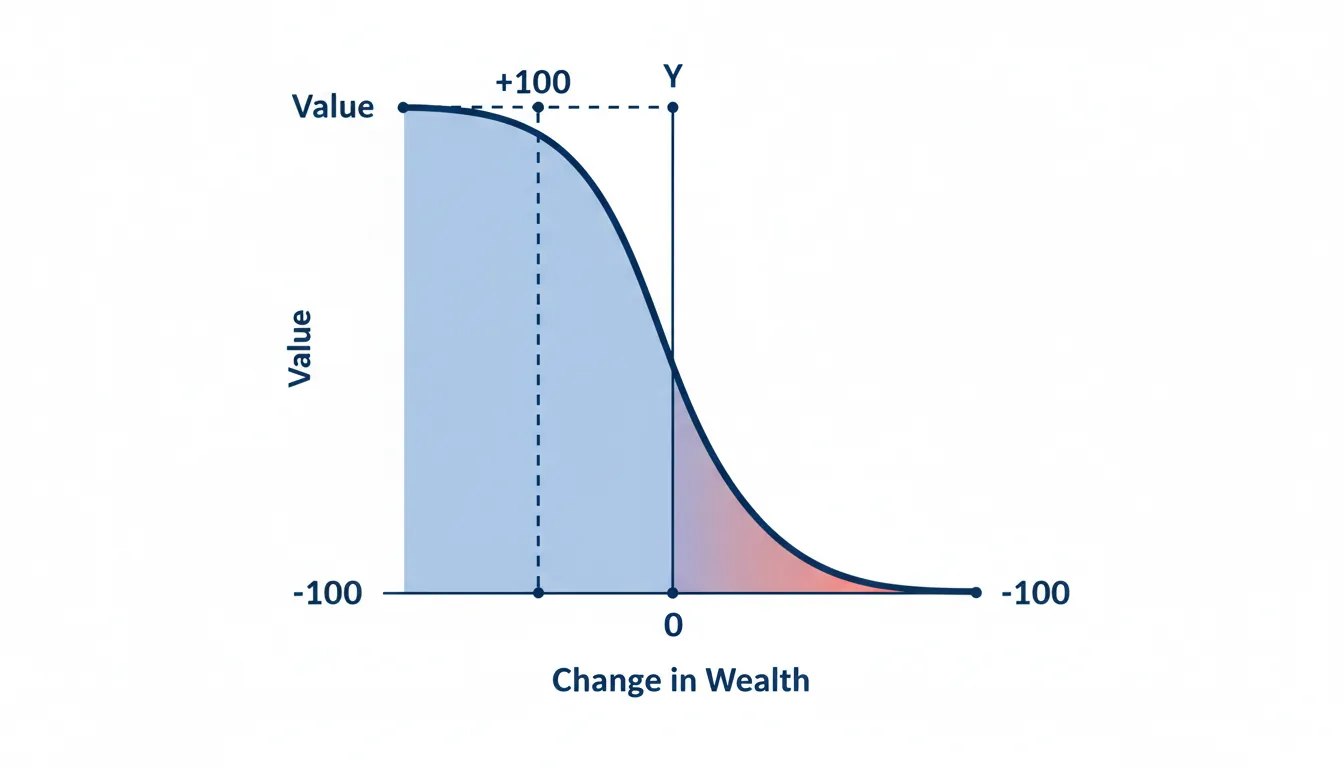
Core Principle: People feel pain of losing $100 about twice as intensely as pleasure of gaining $100. Asymmetric value function drives risk-averse behavior and status quo bias. "Don't take away what I have" is more powerful than "Give me something new."
Figure: Kahneman and Tversky's value function showing the asymmetric response to gains and losses — the pain of losing $100 is roughly twice the pleasure of gaining $100.
Real-World Application: Freemium to Paid Conversion
Conversion Strategy
Why Free Trials Outperform Free Tiers
Free Trial Strategy (Loss Aversion):
Give full access for 14 days: User gets premium features, forms habits
At day 15: Features disappear unless user pays
Psychological frame: User experiences LOSS of features they already used
Conversion rate: 25-40% (high because losing features hurts)
Freemium Strategy (Gain Frame):
Limited free tier forever: User has basic features permanently
To upgrade: User must see value in GAINING premium features
Psychological frame: User contemplates potential gains, not losses
Conversion rate: 2-5% (low because gains are less motivating than avoiding losses)
Loss AversionBehavioral Economics
Business Applications
For Product Teams: Frame features as preventing losses. Cybersecurity software: don't sell "protect your data" (gain frame)—sell "don't lose your data to hackers" (loss frame). Same product, 2x conversion rate.
For Marketing Teams: Emphasize what customers stand to lose. "Don't miss out" outperforms "Get this deal." Email subject lines with loss framing (last chance, expiring soon) have 20-30% higher open rates.
Leveraging Loss Aversion Endowment effect: Once people own something, they value it more—give free trials to create ownership feeling Status quo bias: Default options stick because switching feels like loss—make desired choice the default Framing: Emphasize what's at risk, not what could be gained Ethical use: Don't manufacture fake losses or create anxiety—use to highlight genuine risks
45. Bounded Rationality: Humans Are "Satisficers," Not Optimizers
Core Principle: People have limited cognitive resources and information-processing capacity. Rather than finding optimal solutions, we "satisfice"—choose first acceptable option that meets minimum criteria. Good enough beats perfect.
Rational Decision: Compare all shipping options, calculate value of faster delivery vs. cost
Options: Standard (free, 5-7 days), Expedited ($7.99, 2-3 days), Prime ($14.99/month for 2-day on all orders)
Optimal choice: Depends on order frequency, urgency, value of time—complex calculation
Bounded Rationality Behavior:
Cognitive load: Shoppers don't calculate expected value—too much effort
Satisficing: Choose default option or first acceptable choice (Prime)
Amazon's advantage: Makes Prime the default—most users don't optimize, just click "Proceed"
Result: 200M+ Prime members, many paying for service they underutilize (satisficing, not optimizing)
Bounded RationalityChoice Architecture
Business Applications
For Product Teams: Reduce decision complexity. Offer 3 tiers (good/better/best), not 10. Paradox of choice: more options = lower conversion because cognitive load overwhelms customers. Apple's product line simplicity vs. Samsung's complexity.
For UX Designers: Design for satisficing, not optimization. Progressive disclosure (show advanced options only when needed), smart defaults (pre-select most common choices), guided flows (decision tree, not overwhelming form).
For Pricing Teams: Exploit bounded rationality with anchoring and defaults. Most customers won't calculate ROI—they'll pick middle tier (seems safe), trust your recommendation (default), or match competitors. Price accordingly.
Designing for Bounded Rationality Simplify choices: 3 options max for most decisions Smart defaults: Pre-select best choice for most users Progressive disclosure: Hide complexity until needed Decision aids: Filters, comparisons, recommendations reduce cognitive load Recognition over recall: Show options rather than requiring users to remember/calculate
Law of Substitution: When Customers Switch
Core Principle: Consumers substitute to alternatives when relative prices or perceived value changes. High substitutability = intense price competition. Low substitutability = pricing power.
Real-World Application: Streaming Services vs. Cable TV
Setup: 2015-2025, US pay TV market. Cable cost $100/month for 200 channels (90% unwatched). Netflix launched at $7.99/month for on-demand content.
Result: 50 million US households "cut the cord" 2015-2025. Cable subscriptions fell from 100M (2015) to 65M (2025) as streaming became perfect substitute at 1/10 the price.
Key Insight: Substitution accelerates when: (1) substitute offers better value, (2) switching costs are low (no contract cancellation fees after 2020), (3) network effects favor new platform (original content, social buzz). Netflix didn't just compete—it made cable obsolete for most users.
Business Applications
For Product Teams: Reduce substitutability through differentiation. Unique features, proprietary data, integrations, brand equity—anything that makes "close enough" alternatives unacceptable. Salesforce's ecosystem (AppExchange, Trailhead, community) makes switching to competitors painful despite similar core CRM features.
For Pricing Teams: Monitor substitutes' pricing obsessively. If you're 20% more expensive than close substitutes without clear differentiation, you'll lose share fast. Either justify premium with value or match pricing. Tesla matched luxury SUV pricing (BMW X5, Audi Q7) while offering superior tech—positioned as substitute for luxury, not economy cars.
For Strategy Teams: Map substitution threat matrix: direct substitutes (Coke vs. Pepsi), indirect substitutes (soda vs. energy drinks vs. coffee), and potential future substitutes (soda vs. personalized nutrition drinks). Allocate R&D to create barriers before substitutes mature.
Defending Against Substitution High switching costs: Data lock-in, integrations, training investment Network effects: Value increases with users (can't replicate by switching) Brand loyalty: Emotional attachment overrides rational price comparison Unique capabilities: Patents, proprietary algorithms, exclusive content Ecosystem lock-in: Platform with complementary products (Apple ecosystem)
Consumer BehaviorCompetitive DynamicsPricing Power
Law of Habit Formation: Stickiness Through Repetition
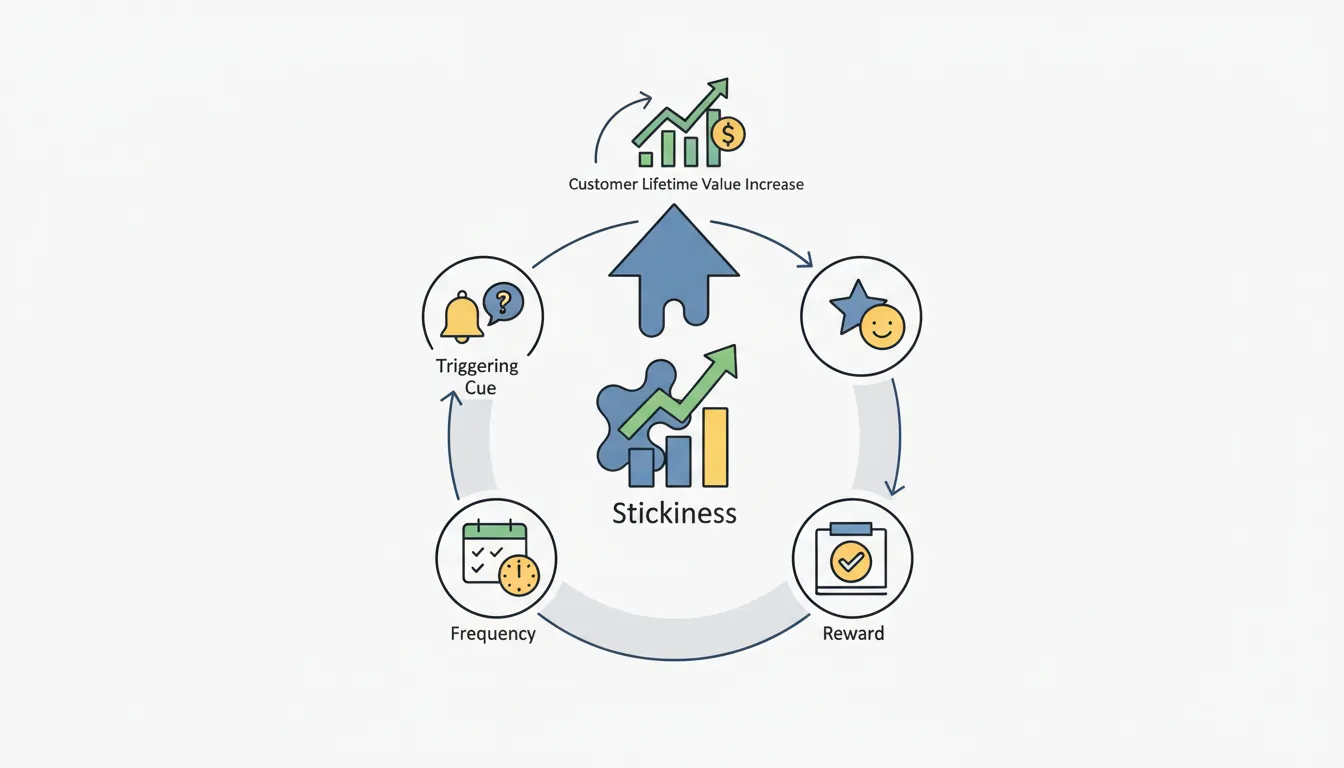
Core Principle: Repeated use creates habits that increase customer lifetime value and reduce churn. Habit strength = Frequency × Reward × Triggering cue. Once habitual, product becomes automatic (low conscious consideration).
Figure: Habit formation cycle showing how repeated use creates stickiness through frequency, reward, and triggering cues that increase customer lifetime value.
Real-World Application: Daily Active Use Drives Retention
Setup: Early Facebook (2008-2010) analyzed user retention cohorts. Found: users who added 7+ friends within 10 days had 90%+ retention at 1 year. Users with <3 friends had 50% 30-day retention.
Result: Facebook redesigned onboarding to drive friend connections. "People You May Know" recommendations, import contacts, suggested groups. Result: 70% of new users hit "7 in 10" threshold (up from 40%), driving monthly active users from 100M (2008) to 2.9B (2024).
Key Insight: Habit loop = Trigger (notification) ? Action (open app, see friend update) ? Reward (dopamine from social validation). 7 friends = 7 potential triggers daily. Daily use ? habit ? retention. Most retention problems are actually habit formation problems.
Business Applications
For Product Teams: Design for daily use, not monthly. Slack's threading reduces email habit; Duolingo's streaks gamify daily practice; Spotify's Daily Mix personalizes discovery. Identify your product's natural usage frequency and optimize for it. B2B SaaS: daily login > weekly report > monthly review.
For Growth Teams: Define your "aha moment" metric (Facebook's "7 friends"). Measure time-to-value: how quickly do new users experience core benefit? LinkedIn found users who added profile photo + 3 connections in first week had 80% higher retention. Optimize onboarding to hit this milestone fast.
For Retention Teams: Combat churn through re-engagement campaigns targeting lapsing users. Spotify: "Your 2024 Wrapped" brings back inactive users. Duolingo: "Your 47-day streak is about to break!" notification. Trigger-action-reward loops pull users back before they fully churn.
Building Product Habits (Nir Eyal's Hook Model) Trigger: External (notification, email) or internal (boredom, loneliness) Action: Simplest behavior done in anticipation of reward (open app, scroll feed) Variable Reward: Unpredictable payoff (sometimes great post, sometimes mediocre—keeps you coming back) Investment: User adds value (post content, add friends, curate preferences) ? increases future triggers
RetentionProduct DesignBehavioral Psychology
Reference Price Effect: Customers Compare to Anchors
Core Principle: Customers evaluate price fairness relative to reference points (past prices, competitors, "original" price). Perceived value = Actual price vs. Reference price. Retailers manipulate reference points to influence purchase decisions.
Setup: Same flight NYC-LAX. Business traveler books 2 days before departure: $800. Leisure traveler books 3 months ahead: $200. Identical seat, 4× price difference.
Mechanism: Business traveler's reference price = "cost of missing meeting" ($5,000+ in lost deals, reputation damage). $800 feels cheap. Leisure traveler's reference price = "road trip cost" ($300 gas + hotels). $200 feels like deal, $800 unacceptable. Same product, different reference points, different willingness to pay.
Result: Airlines capture maximum consumer surplus through price discrimination. Leisure travelers (elastic demand, low reference price) see low prices. Business travelers (inelastic demand, high reference price) see high prices. Total revenue maximized.
Business Applications
For Pricing Teams: Anchor high, discount strategically. Display "list price" $1,000 crossed out, "sale price" $700. Customer's reference point = $1,000 (feels like 30% savings). Never show just $700 (no anchor = no perceived deal). Kohl's, Macy's built business models on perpetual "sales" against inflated MSRPs.
For E-commerce Teams: Show "X people viewing this now" and "Only 3 left!" to create urgency (reference point = future unavailability). Amazon: "Typical price $49.99, today $34.99." Dynamic pricing adjusts based on demand, but always shows reference to make current price seem favorable.
For SaaS Teams: Price relative to value created, not cost. Enterprise software: reference price = "cost of manual process" (20 employees × $50K salary = $1M). Charging $100K/year feels like 90% discount. Never say "our costs are $10K, so we charge $100K." Anchor to customer's alternative (manual process, competitor's price, ROI from time savings).
Setting Effective Reference Prices Past prices: "Was $X, now $Y" (discount framing) Competitor prices: "Others charge $X, we charge $Y" (value framing) Decoy pricing: Add expensive option to make target option seem reasonable Bundle unbundling: Show itemized value ($500 consulting + $300 software = $800 bundle, "saves $200") Temporal anchors: "Introductory price" implies future increase
Core Principle: Costs incurred when switching from one product to another create customer lock-in. Higher switching costs = lower churn = higher customer lifetime value. Switching costs can be financial (contract penalties), procedural (data migration), relational (lost integrations), or psychological (learning new interface).
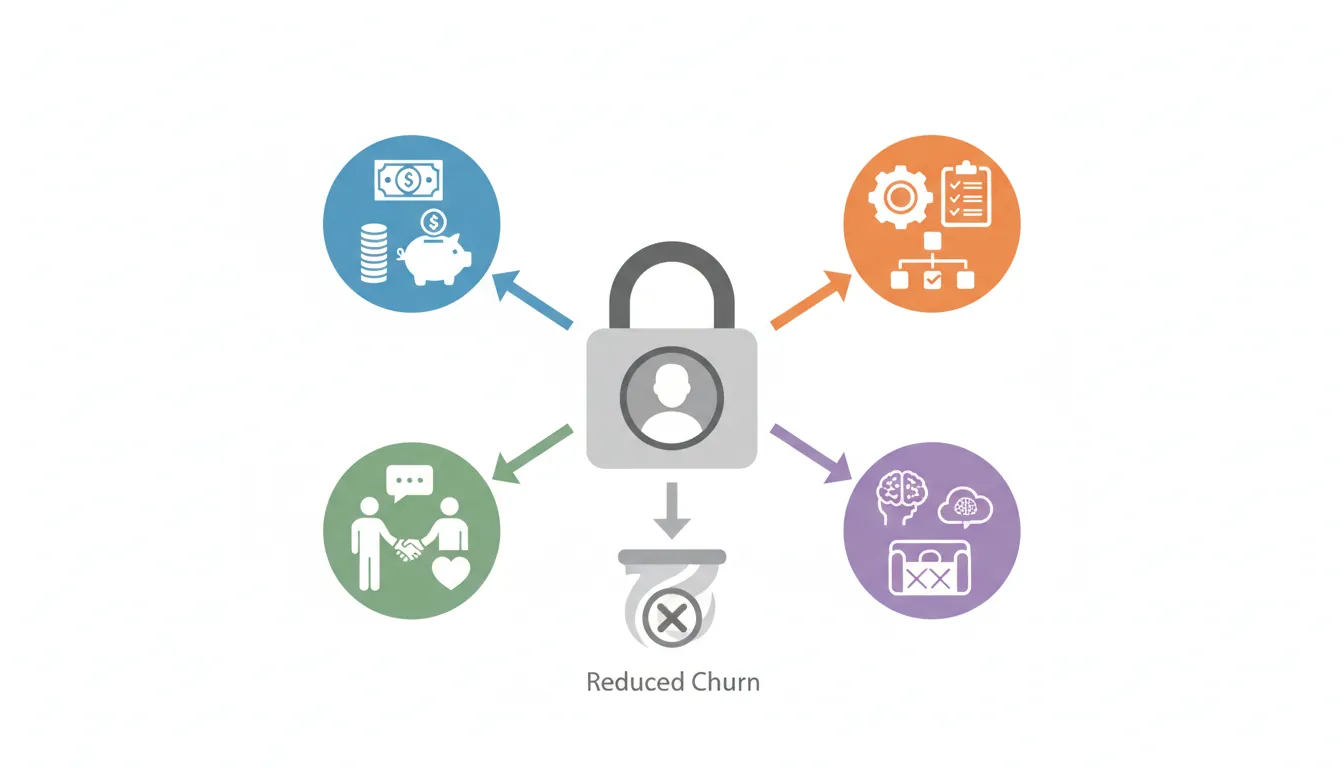
Figure: Four types of switching costs — financial, procedural, relational, and psychological — that create customer lock-in and reduce churn.
Setup: Large bank using Oracle Database for 15 years. Stores 10TB transactional data, integrated with 50+ internal systems, hundreds of stored procedures written in PL/SQL (Oracle's proprietary SQL dialect).
Switching Cost Analysis: (1) Data migration: 6-12 months, $5M consulting fees. (2) Code rewrite: 200+ stored procedures need translation to new syntax. (3) Integration testing: Every system integration must be verified. (4) Risk: Database outage = millions in lost transactions. (5) Training: 50 DBAs trained on Oracle, not PostgreSQL.
Result: Despite PostgreSQL being free (vs. $500K/year Oracle licenses), bank stays with Oracle. Switching cost ($10M+ over 2 years) exceeds 20 years of license fees. Oracle raises prices 10% annually—bank grumbles but pays. Classic lock-in: initial "free" trial became 15-year commitment.
Business Applications
For Product Teams: Build switching costs strategically. (1) Data gravity: Store customer data in proprietary formats or make export difficult. (2) Integrations: Connect to 10+ third-party tools customers also use. (3) Customization: Allow deep configuration—migration would lose all settings. (4) Training investment: Complex products require months of learning (Adobe Creative Suite, AutoCAD). Salesforce's platform strategy: customers build custom objects, workflows, apps on top of CRM ? locked in.
For Customer Success Teams: Increase switching costs through value delivery. (1) Regular business reviews showing ROI (reminds customer of value). (2) Co-create roadmap (customer invested in future features). (3) Executive relationships (firing vendor = admitting mistake to board). (4) Success milestones (celebrate wins tied to your product). HubSpot: assigns dedicated customer success manager, quarterly strategy calls, certification programs. Switching would mean starting over with new vendor.
For Pricing Teams: Price based on switching costs, not just value. High switching costs = pricing power. Can raise prices 10-20% annually without churn (customers won't leave for price if switching cost is high). But beware: excessive price increases trigger "enough is enough" moments. Oracle lost customers to AWS Aurora when prices exceeded pain threshold.
Setup: 2013 Adobe shifts from perpetual licenses ($1,299 one-time for Photoshop CS6) to Creative Cloud subscription ($52.99/month for full suite). Creates multiple switching cost layers: (1) File format lock-in (.PSD, .AI files only fully compatible with Adobe apps), (2) Workflow integration (Photoshop ? Illustrator ? InDesign pipelines), (3) Learning investment (10,000+ hours mastering Adobe tools for professional designers), (4) Plugin ecosystem (third-party plugins only work with Adobe apps).
Switching Cost Impact: 2013: 4M Creative Suite subscribers. 2024: 32M Creative Cloud subscribers (8× growth). Alternatives emerged: Affinity Photo/Designer ($50 one-time, 90% feature parity), GIMP/Inkscape (free, open-source). Yet Adobe market share stable at 85%+ among professionals. Why? Switching costs prohibitive: (1) Retraining entire team ($100K+ for agency with 20 designers), (2) File format conversion (client files, archives all in Adobe formats), (3) Workflow disruption (project timelines can't absorb transition period).
Pricing Power Result: Adobe raised Creative Cloud prices 50% (2013-2024): $49.99 ? $74.99/month for Photography plan. Churn rate remains below 5% annually (extremely low for B2C subscription). Switching costs = pricing power. Revenue: $7.1B (2013) ? $19.4B (2024), 65% margins. Subscription model + switching costs created $280B market cap (2024). Key lesson: high switching costs let you raise prices without losing customers—but must maintain product quality or resentment builds (Adobe invests heavily in new features, AI integration to justify price increases).
Types of Switching Costs Financial: Contract penalties, upfront migration costs, lost discounts/credits Procedural: Data migration, integration reconfiguration, testing, deployment Relational: Lost integrations, broken workflows, partner ecosystem disruption Learning: Time to learn new product, retrain team, adapt workflows Risk: Downtime during migration, data loss, business disruption Sunk cost fallacy: "We've invested so much already, can't abandon now"
Retention StrategyCustomer Lock-InChurn Reduction
Long-Tail Law: Many Small Niches Add Up
Core Principle: In digital marketplaces, aggregate demand for niche products can exceed demand for hits. The "long tail" of low-volume items collectively outsells the "head" of high-volume items. Enabled by zero marginal cost of storage/distribution (physical retail can't stock niches due to shelf space constraints).
Setup: Barnes & Noble bookstore (physical): 200,000 book titles in stock. Top 1,000 bestsellers = 70% of sales. Remaining 199,000 titles = 30% of sales. Shelf space limited ? must stock predictable hits. Amazon (digital): 3.3M book titles available. Top 100,000 = 50% of sales. Remaining 3.2M titles = 50% of sales.
Key Insight: Physical retailer: stock top 20% of titles (80/20 rule). Digital retailer: stock everything (zero marginal cost of listing). Amazon's revenue from obscure books ($1B+ annually) exceeds most publishers' total revenue. Long tail profitable because: (1) no shelf space constraint, (2) search algorithms connect niche buyers to niche products, (3) reviews/ratings reduce discovery risk.
Result: Amazon marketplace sellers list 350M products (2024). Most sell <10 units/month individually, but collectively generate $200B GMV. Long tail is Amazon's competitive moat—no physical retailer can match selection breadth.
Business Applications
For Marketplace Teams: Optimize for long-tail supply. Reduce listing friction (Etsy: 5-minute shop setup), improve discovery (search, recommendations, SEO), provide seller tools (analytics, inventory management). Shopify: enables 4M+ merchants selling niche products. Each small, but aggregated = $200B GMV (2023). Platform's value = long tail breadth × discovery quality.
For Content Platforms: Archive everything, surface algorithmically. YouTube: 500 hours uploaded per minute. 99% get <1,000 views, but collective watch time from niche videos exceeds trending videos. Recommendation algorithm connects niche audiences to niche creators. Netflix: keeps obscure shows forever (zero storage cost), some find audience years later through recommendations.
For Product Teams: Enable customization and niche variants. Nike By You (custom sneakers), Dell's configure-to-order PCs, Salesforce's AppExchange (10,000+ niche add-ons). Let customers/developers create long tail—platform provides infrastructure. Each niche variant serves tiny market, but collectively covers massive TAM.
Long-Tail Economics (Chris Anderson's Framework) Hits (Head): Top 20% of products = 50% of revenue (physical retail focus) Niches (Tail): Bottom 80% of products = 50% of revenue (digital opportunity) Enablers: (1) Zero marginal cost of inventory, (2) Powerful search/discovery, (3) User-generated reviews reduce risk Examples: Amazon (books), Netflix (movies), Spotify (songs), Shopify (merchants), YouTube (creators) Strategy: Aggregate demand across millions of niches through platform/marketplace model
Marketplace StrategyDigital EconomicsPlatform Business Model
Executive Framework: Behavioral Strategy Playbook
Behavioral economics reveals the systematic gaps between rational models and real consumer behavior. The 13 laws above explain why products fail despite superior features, why pricing strategies backfire, and why customer acquisition doesn't translate to retention. This framework synthesizes those laws into an actionable system for executives navigating consumer psychology, information asymmetry, and demand creation.
Framework Overview: 4-Layer Behavioral Strategy System Layer 1: Information Architecture (reduce asymmetry, build trust through signaling/screening) Layer 2: Cognitive Design (leverage anchoring, loss aversion, bounded rationality for conversion) Layer 3: Retention Engineering (switching costs, habit formation, reference pricing for LTV) Layer 4: Market Dynamics (substitution defense, long tail capture, network effects amplification)
Layer 1: Information Architecture Strategy
Problem: Markets fail when buyers can't assess quality (information asymmetry). Adverse selection drives out good products, moral hazard undermines trust. Result: low conversion, high customer acquisition cost, market collapse (\"lemons\" problem).
Solution Framework: Reduce information gaps through credible signals and systematic screening.
Executive Decision Rule: Before scaling customer acquisition, audit information architecture. If buyers can't assess quality pre-purchase, you'll attract adverse selection (high-churn customers) and struggle with pricing power. Invest in signaling/screening mechanisms—higher CAC upfront, but 2-3x LTV improvement.
Layer 2: Cognitive Design for Conversion
Problem: Customers aren't rational optimizers—they satisfice under cognitive constraints. Anchoring bias, loss aversion, and bounded rationality dominate purchase decisions. Logical product superiority doesn't translate to sales.
Solution Framework: Design pricing, positioning, and UX around cognitive biases (not rationality).
Bias
Strategic Implication
Tactical Implementation
Quantified Impact
Anchoring (Law 43)
First price shown sets baseline for all comparisons
Display Enterprise tier first ($500/user), makes Pro tier ($50) seem cheap. Apple iPhone X $999 anchor normalized $1000+ phones industry-wide
30-40% revenue increase from anchor optimization (A/B tested)
Loss Aversion (Law 44)
Losing $100 hurts 2x more than gaining $100 feels good
Free trials (users lose features at day 15) convert 25-40% vs. freemium 2-5%. Frame as \"don't lose data\" not \"protect data\"
5-10x conversion improvement (loss frame vs. gain frame)
Bounded Rationality (Law 45)
Customers satisfice (choose first acceptable option), don't optimize
Offer 3 tiers (good/better/best), not 10. Make desired tier the default. Amazon Prime exploits decision fatigue—most click \"Proceed\" without calculating value
Show \"list price\" $1000 crossed out, \"sale price\" $700. Never show just $700 (no perceived deal). Anchor to value created, not cost
15-25% willingness-to-pay increase from reference framing
Executive Decision Rule: Don't assume customers will calculate value rationally. Design choice architecture (defaults, tiers, framing) to guide satisficing behavior toward profitable outcomes. Test pricing page variations A/B—30%+ revenue swings from pure psychological tweaks (no product changes).
Layer 3: Retention Engineering Through Lock-In
Problem: Acquiring customers is expensive; losing them is fatal. Churn destroys LTV. But retention isn't just \"good product\"—it's strategic switching cost design and habit engineering.
Solution Framework: Build multi-dimensional lock-in before competitors do.
Lock-In Type
Mechanism
Implementation
Defensibility
Switching Costs
Make migration painful—data, integrations, training, risk
Oracle: proprietary PL/SQL locks in DBAs. Adobe: .PSD files only work in Photoshop. Salesforce: custom objects/workflows. $10M+ switching cost = 10-20% annual price increases tolerated
Facebook \"7 friends in 10 days\" ? 90% retention. Slack threading replaces email habit. Duolingo streaks gamify daily practice. Optimize for daily > weekly > monthly engagement frequency
Medium (habits breakable but sticky)
Network Effects
Product value = f(# users). Leaving means losing network access
WhatsApp: 1B users = can message anyone globally. LinkedIn: 900M professionals. Zoom: \"join meeting\" link requires download ? viral growth. Network density thresholds: FB 7 friends, LI 3 connections
Very High (winner-take-most dynamics)
Data Gravity
Accumulated data increases product value, hard to replicate elsewhere
Spotify: 10 years of listening ? perfect recommendations. Netflix: viewing history ? content curation. Google Photos: 15 years of memories. Export friction + ML personalization = lock-in
High (data uniqueness = moat depth)
Executive Decision Rule: Calculate switching cost index: migration cost ÷ annual product cost. Oracle ratio: 20:1 (10M switching cost ÷ 500K annual license). Target 10:1+ for pricing power. If <5:1, customers are vulnerable to competitor poaching. Invest in switching cost engineering before market matures—early movers get lock-in, late movers face commoditization.
Layer 4: Market Dynamics & Long-Tail Strategy
Problem: Perfect substitutes destroy pricing power. Mass-market focus leaves long-tail revenue uncaptured. Without network effects, growth is linear (not exponential).
Solution Framework: Differentiate to reduce substitutability, capture long tail through platforms, amplify network effects.
Strategic Pillar
Economic Principle
Execution Playbook
Substitution Defense
High substitutability = price competition. Low substitutability = pricing power (Law of Substitution)
Differentiation vectors: (1) Unique features (Salesforce AppExchange ecosystem), (2) Proprietary data (Google Search quality from scale), (3) Brand loyalty (Apple ecosystem lock-in), (4) Integration depth (10+ tool connections). Monitoring: Track competitor pricing weekly—if 20%+ cheaper with similar features, justify premium OR match price within 90 days to prevent share loss
Long Tail Capture
Digital: aggregate demand for niches exceeds hits. Physical: shelf space limits to top 20% (Long-Tail Law)
Viral mechanics: Dropbox \"invite for storage\" ? 60% signups. Zoom \"join meeting\" link ? download required. LinkedIn \"see profile viewers\" ? FOMO signup. Density thresholds: Facebook 7 friends, LinkedIn 3 connections, Slack 2000 messages—optimize onboarding to hit threshold fast (10× retention improvement). Monetization timing: Subsidize growth phase (free/low price), monetize after network established (raise prices 2-5x, churn minimal due to network lock-in)
Executive Decision Rule: Assess market structure: (1) Commodity markets (high substitutability, no network effects) ? compete on cost/distribution, low margins. (2) Differentiated markets (low substitutability, no network effects) ? compete on features/brand, moderate margins. (3) Platform markets (network effects, long tail) ? race to scale, winner-take-most, high margins post-dominance. Align strategy to structure—don't play differentiation game in commodity market, don't ignore network effects in platform market.
Integrated Case Study: Netflix's Behavioral Mastery
How Netflix Applied All 13 Laws to Dominate Streaming
Integrated StrategyMulti-Law Application
Layer 1 - Information Architecture:
Signaling (Law 42): Free trial signals confidence in content quality (costly if users don't convert). 30-day trial ? 40% conversion vs. 5% freemium industry average
Information Asymmetry (Law 39): Trailers, ratings, recommendations reduce uncertainty about content quality. Users can't assess show quality pre-watch ? metadata/reviews fill gap, raise conversion
Layer 2 - Cognitive Design:
Anchoring (Law 43): $19.99 \"Premium\" tier (4K, 4 screens) anchors perception. Makes $15.49 \"Standard\" seem reasonable, even though both profitable. Revenue per user optimized through anchor manipulation
Loss Aversion (Law 44): \"Your trial ends in 3 days\" emails frame as impending loss of access. 2x click-through vs. \"Subscribe now for great content\" (gain frame). Cancellation flow: \"You'll lose access to X shows you started\"—friction reduces churn 15-20%
Bounded Rationality (Law 45): 3 clear tiers (Basic/Standard/Premium), not 10 confusing options. Most users pick \"Standard\" (middle tier)—satisficing, not optimizing. Paradox of choice: simpler tiers = higher conversion
Layer 3 - Retention Engineering:
Habit Formation: Autoplay next episode removes friction (Trigger: episode ends ? Action: next episode starts ? Reward: cliffhanger resolution). Binge-watching = habit formation. Daily active use: Netflix users average 3.2 hours/day vs. 1.5 hours traditional TV
Switching Costs: Personalized recommendations based on years of viewing history (data gravity). Switching to Disney+ means starting from zero personalization. Watchlist, continue watching, profile settings = procedural switching costs. Shared family account = relational switching cost (\"I can't cancel, my spouse watches X show\")
Reference Pricing: Cable TV reference price = $100/month for 200 channels. Netflix $15/month for unlimited content = 85% \"discount\" perception. Even after 7 price increases (2011-2024: $7.99 ? $15.49), still feels cheap relative to cable anchor
Layer 4 - Market Dynamics:
Substitution Defense: Original content (Stranger Things, Crown, Squid Game) creates unique value. Can't substitute to Hulu—exclusive shows = low substitutability = pricing power. $17B/year content spend builds moat against commoditization
Long Tail: 15,000+ titles vs. Blockbuster's 5,000. Obscure documentaries, foreign films, niche genres collectively watched by millions. Algorithm surfaces long tail—80% of views from recommendations, not search. Long tail = differentiation vs. linear TV
Network Effects (indirect): More subscribers ? more revenue ? more content ? attracts more subscribers. Not traditional network effects (users don't interact), but scale economies in content create flywheel. 260M subscribers (2024) enables $17B content budget no competitor matches
Integrated Outcome: Netflix revenue: $1.2B (2007, DVD-by-mail) ? $33.7B (2024, streaming). Market cap: $3B (2007) ? $250B (2024). Behavioral strategy = competitive moat. Blockbuster had distribution network, brand recognition, first-mover advantage—but ignored behavioral economics (late fees = loss aversion violation, limited selection = no long tail, no habit formation). Netflix weaponized all 13 laws systematically ? market dominance.
Key Lesson for Executives: Laws compound when integrated. Anchoring + loss aversion ? 2x pricing power. Switching costs + habit formation ? 80%+ retention. Long tail + network effects ? winner-take-most. Don't apply laws in isolation—design holistic behavioral system.
5 Common Executive Mistakes in Behavioral Strategy
Mistake
Why It Fails
Correction
1. Assuming Rational Customers
Build superior product, assume customers will recognize value and pay premium. Reality: bounded rationality, satisficing, cognitive overload ? customers don't calculate ROI, pick cheapest acceptable option
Design choice architecture around biases. Anchor high, frame loss avoidance, simplify to 3 tiers, make desired choice default. Test psychological tweaks (pricing page layout, framing) as rigorously as product features—often bigger revenue impact
2. Ignoring Information Asymmetry
Launch in market with quality uncertainty (SaaS, professional services, complex B2B), expect customers to trust claims. Result: adverse selection (high-churn customers buy, low-churn wary), low conversion, pricing pressure
Invest in credible signals before scaling growth. Free trials (costly for bad products), certifications, case studies, lead customer logos, money-back guarantees. Higher CAC but 2-3x LTV improvement from better customer selection
3. Building Zero Switching Costs
Pride yourself on \"easy migration\"—export data with one click, no lock-in, customer-friendly. Noble but strategically naive. Result: commoditization, price-based competition, high churn, no pricing power
Switching costs aren't unethical—they're value delivery. Deep integrations, customization, workflow optimization, training investment, data-driven personalization all increase switching costs while genuinely improving product. Build lock-in through value creation, not artificial barriers. Target 10:1 switching cost to annual price ratio for defensibility
4. Mass Market Myopia (Ignoring Long Tail)
Focus 100% resources on top 20% of products/customers (80/20 rule from physical retail era). Digital platforms where tail is 50% of revenue ? leave billions on table (Amazon obscure books, YouTube niche creators, Shopify small merchants)
Invest in discovery infrastructure (search, recommendations, reviews), reduce listing friction (1-click seller onboarding), enable infinite SKUs (marketplace model). Long tail captured through algorithms, not manual curation. Revenue formula: head revenue + (tail breadth × discovery quality)
5. Conflating Acquisition with Retention
Spend heavily on marketing (CAC), assume good product = retention. Reality: habit formation, switching costs, loss aversion drive retention—not product quality alone. Result: leaky bucket (acquire fast, churn fast), negative unit economics
Separate retention strategy from acquisition. Measure \"aha moment\" (Facebook 7 friends, LinkedIn 3 connections)—optimize onboarding to hit threshold fast. Design trigger-action-reward loops for daily use (habit formation). Build switching costs proactively (integrations, customization, data accumulation). Retention engineering is distinct discipline from growth marketing
Final Executive Guidance: Behavioral economics isn't academic theory—it's operational reality. Your customers are loss-averse satisficers with bounded rationality, navigating information asymmetry, forming habits, facing switching costs, and influenced by anchors/reference prices. Design business systems around these truths, not idealized rational actors. Companies that master behavioral strategy (Amazon, Netflix, Apple, Salesforce) achieve 30-50%+ higher margins and 3-5x higher customer lifetime value than competitors selling similar products. The gap isn't product quality—it's behavioral system design.
Team Applications: Product, Marketing & Pricing
Behavioral economics principles translate differently across functions. Product teams optimize for habit formation and switching costs. Marketing leverages cognitive biases for conversion. Pricing exploits anchoring and reference points. Sales manages information asymmetry. This section provides function-specific playbooks for applying the 13 laws.
Product Team: Building Behavioral Moats
Core Mandate: Design products that create habits, raise switching costs, and reduce substitutability—not just deliver features. Retention is 80% product design, 20% customer success.
Framework: Nir Eyal's Hook Model applied to product roadmap
Hook Component
Product Features
Success Metrics
Trigger
Notifications (external), FOMO/boredom (internal). Examples: Slack mentions, Duolingo streak reminders, LinkedIn \"X people viewed your profile\"
Daily active users (DAU), notification click-through rate (target >15%)
Action
Simplest possible behavior. Instagram: scroll feed (1 swipe). Uber: request ride (2 taps). Reduce friction to <30 seconds from trigger to action
Time to first action, action completion rate (target >60%)
Variable Reward
Unpredictable payoff keeps users engaged. Twitter: sometimes viral tweet, sometimes crickets. Spotify Discover Weekly: hit-or-miss but anticipation builds habit
Session duration, return rate within 24 hours (target >40% for daily habits)
Investment
User adds value ? increases future triggers. LinkedIn: add connections ? more updates in feed. Spotify: save songs ? better recommendations. Each investment = switching cost increase
Tactical Application: Define your \"aha moment\" metric (Facebook: 7 friends in 10 days, Slack: 2000 messages sent, Dropbox: 1 file in 1 folder). Measure cohorts: users who hit threshold vs. those who don't. Typical delta: 5-10x retention. Optimize onboarding flow to maximize threshold achievement within first week. Remove every friction point—cognitive load (bounded rationality) kills habit formation.
Data Gravity: Accumulate user data that improves product over time. Spotify: 10 years of listening ? perfect recommendations. Netflix: viewing history ? content curation. Migration means losing personalization—procedural switching cost ($0) + psychological switching cost (\"starting over\"). Product roadmap: prioritize features that consume/generate user data (preferences, history, configurations).
Integration Depth: Connect to 10+ third-party tools customers already use. Salesforce: 10,000+ AppExchange integrations. Slack: 2,500+ app integrations. Zapier as integration layer. Each integration = relational switching cost—breaking one link acceptable, breaking 10 links = migration project (6+ months, $500K+ consulting). Product strategy: API-first architecture, partnership team for top integrations, self-serve integration marketplace for long tail.
Workflow Customization: Allow deep configuration—custom fields, automations, dashboards, reports. Salesforce: customers build entire business processes on platform. Migration would lose months of configuration work. But balance: too much customization = upgrade complexity (technical debt). Target: 80% standardization (easy upgrades), 20% customization (switching costs).
Learning Investment: Complex products require training—sunk cost fallacy keeps users locked in. Adobe Creative Suite: 10,000+ hours to master. AutoCAD: months of learning curve. But risk: complexity reduces adoption. Solution: progressive disclosure (simple by default, complexity on-demand), certification programs (LinkedIn Learning, HubSpot Academy—user invested in credentials), video tutorials (searchable, contextualized).
Product Decision Framework: Each feature should answer: \"Does this increase switching costs OR improve core value proposition?\" Features that do neither are waste. Target switching cost index: migration effort ÷ annual subscription cost = 10:1+ for defensibility. Example: $100K/year SaaS ? $1M migration cost = strong lock-in. Measure through customer interviews: \"How much would it cost (time, money, risk) to migrate to competitor?\" If <5x annual cost, vulnerable to poaching.
3. Substitution Defense Through Differentiation (Laws: Substitution, Long Tail, Network Effects)
Strategic Question: What makes your product non-substitutable? Price, speed, quality are table stakes—easily matched. Sustainable differentiation: unique data, network effects, ecosystem lock-in.
Differentiation Vector
Mechanism
Product Roadmap Implication
Proprietary Data
More users ? more data ? better product ? more users (data network effects)
Waze: user GPS data ? real-time traffic. Google Search: click data ? ranking quality. Priority: features that generate unique data (usage telemetry, user content, behavioral signals). Build ML models that improve with scale—competitors can't replicate without equivalent data
Direct Network Effects
Value increases with same-side users. Metcalfe's Law: network value = n²
Messaging (WhatsApp, iMessage), collaboration (Slack, Notion), marketplaces (Airbnb, Uber). Product strategy: viral mechanics (invite flows, referral bonuses), density thresholds (Facebook 7 friends), single-player mode (useful before network, but better with network—Zoom works for 1 person but valuable for teams)
Ecosystem Lock-In
Platform with complementary products/services. Switching one means switching all
Apple: iPhone + Mac + iPad + Watch + AirPods + iCloud. Each product alone substitutable, but ecosystem together creates 10× switching cost. Product roadmap: cross-device features (Handoff, Universal Clipboard), shared services (iCloud, Apple One bundle), hardware integration (seamless pairing)
Long-Tail Aggregation
Serve niches competitors ignore. Breadth = moat in digital markets
Amazon: 350M products vs. Walmart 120K in-store. Shopify: 4M merchants (most <$100K/year revenue). Product strategy: reduce listing friction (1-click seller onboarding), improve discovery (search, recommendations), enable customization (Nike By You, Dell configure-to-order). Long tail captured through algorithms, not manual curation
Tactical Checklist: Monitor substitution threat quarterly. Track competitor feature parity (are they catching up?), pricing gap (are we >20% more expensive without differentiation?), customer churn reasons (are they switching to specific competitor?). If substitutability increasing, invest in differentiation vectors above BEFORE pricing pressure forces margin compression.
Marketing Team: Cognitive Bias Optimization
Core Mandate: Leverage anchoring, loss aversion, bounded rationality, and reference pricing to maximize conversion—not just drive awareness. Marketing's ROI = conversion rate × average order value, both psychologically driven.
Anchor High, Discount Strategically: Always show highest-tier price first (left to right: Enterprise ? Pro ? Starter). Apple iPhone pricing pages: iPhone 15 Pro Max ($1,199) anchors perception, makes iPhone 15 ($799) seem \"affordable.\" Test: high-to-low vs. low-to-high ordering. Typical result: 25-35% revenue increase from high anchor (users choose mid-tier more often when anchored high).
Reference Price Display: Show \"list price\" crossed out next to \"sale price.\" But risk: permanent sales train customers to wait for discounts (Kohl's problem—customers never pay full price). Solution: time-limited sales (urgency) + membership pricing (Costco: members get discount, non-members pay full). Amazon: \"Typical price $49.99, Now $34.99\" (30% off perception, even if $34.99 is normal price). Test: with reference price vs. without. Typical impact: 15-25% conversion increase.
Competitor Anchoring: \"Others charge $X, we charge $Y\" comparison tables. But legal risk: must be accurate, verifiable. Safer: \"Save $Z vs. manual process\" (anchor to internal cost, not competitor). Enterprise SaaS: reference price = cost of hiring 3 FTEs ($300K/year salary + benefits). Charging $100K/year = 67% \"savings\" perception.
2. Loss Aversion Framing (Law: Loss Aversion)
Copy Framework: Emphasize what customer stands to lose (2x emotional impact vs. gains).
Situation
Gain Frame (Weak)
Loss Frame (Strong)
Measured Impact
Email Subject Lines
\"Get 20% off this week\"
\"Don't miss 20% off—ends tonight\"
30% higher open rate (loss framing)
Free Trial CTA
\"Start your free trial today\"
\"Try free for 14 days—no credit card, cancel anytime\" (framing potential loss of access)
Ethical Boundary: Don't manufacture fake losses or create anxiety (\"Your account will be deleted!\" when it won't be). Use loss framing to highlight genuine risks/costs (missed savings, wasted time, security vulnerabilities). Trust erosion from fake urgency exceeds short-term conversion gains.
Paradox of Choice Mitigation: More options = lower conversion (cognitive overload). Jam study (Sheena Iyengar): 24 jam varieties = 3% purchase rate. 6 varieties = 30% purchase rate (10x improvement from simplification).
Marketing Application: Limit product tiers to 3 (good/better/best). Highlight one \"recommended\" tier (default choice for satisficers—most customers). Use progressive disclosure: advanced options hidden until \"Show more features\" clicked. Landing page hierarchy: tier comparison table (3 columns) ? feature details (collapsed accordions) ? FAQ (separate page). Test: 3 tiers vs. 5 tiers. Typical result: 20-30% conversion increase from simplification.
Pricing Team: Strategic Revenue Optimization
Core Mandate: Set prices based on customer psychology (anchoring, reference points, loss aversion), not just cost-plus or competitor matching. Behavioral pricing unlocks 30-50% revenue gains from same customer base.
Anchor (makes Pro seem cheap). Rarely purchased but psychologically critical. Include features 95% don't need (white-glove support, custom SLA)
5% of customers
Pro
$50/user/month
Target tier (optimal revenue). Positioned as \"best value\" with 80% of Enterprise features at 10% of price. Most customers choose this (bounded rationality—middle tier feels safe)
70% of customers
Starter
$10/user/month
Acquisition tier (land-and-expand). Deliberately limited to drive upgrades. Loss aversion: users outgrow Starter, face losing workflows if don't upgrade
25% of customers
Revenue Math: Without Enterprise anchor: 80% choose Starter ($10), 20% choose Pro ($50) = $18 average. With Enterprise anchor: 25% Starter, 70% Pro, 5% Enterprise = $45 average (2.5x revenue increase from pure anchoring effect, zero product changes).
Segment-Based Pricing: Different willingness to pay across customer segments. Airlines: business travelers pay 4x leisure travelers for same seat. Segment by urgency (booking 2 days vs. 3 months ahead), feature needs (Pro features vs. basic), or user count (enterprise vs. SMB).
Implementation: Require customers to self-identify segment during purchase flow. \"How many employees?\" (1-10 = SMB pricing, 100+ = enterprise). \"When do you need this?\" (urgent = premium, flexible = discount). \"What's your use case?\" (commercial = full price, academic/non-profit = 50% discount). Legal note: price discrimination legal unless based on protected class (race, gender, etc.). Value-based discrimination (urgency, size, use case) is standard practice.
3. Subscription vs. Perpetual Licensing (Laws: Switching Costs, Loss Aversion, Moral Hazard)
Strategic Trade-offs:
Model
Customer Psychology
Business Impact
When to Use
Subscription
Loss aversion at every renewal (\"don't lose access\"). But lower upfront commitment reduces adoption friction. Status quo bias ? auto-renewal sticks (80%+ renewal typical)
Key Insight: Behavioral strategy isn't single-function responsibility. Product creates lock-in, Marketing converts through psychology, Pricing captures value, Sales manages information asymmetry. Integrated execution = 3-5x higher effectiveness than siloed efforts. Netflix's success: Product (habit-forming binge-watching), Marketing (loss aversion \"trial ends soon\"), Pricing (cable TV reference anchor), all coordinated around behavioral principles ? $250B market cap.
Conclusion & Next Steps
Behavioral economics explains the gap between rational theory and real-world consumer behavior. Understanding information asymmetry, cognitive biases, and switching costs allows you to design pricing strategies, reduce adoption barriers, and create sustainable demand. But even the best consumer insights need to be embedded in innovative products and platform ecosystems to create lasting value.
The next guide explores how technology disruption, platform dynamics, and digital innovation are reshaping competitive advantage.