We use cookies to enhance your browsing experience, serve personalized content, and analyze our traffic.
By clicking "Accept All", you consent to our use of cookies. See our
Privacy Policy
for more information.
Production & Organizational Economics: 9 Laws for Scaling & Incentives
January 24, 2026Wasil Zafar45 min read
Master the economics of production scaling, cost structures, and organizational behavior that determine operational efficiency and performance alignment. Part 2 of our 8-part Economics for Business Strategy series.
Building on the market fundamentals from Part 1, this guide explores how companies actually produce value—and how organizational structure either amplifies or undermines that production. While Part 1 explained pricing and demand, Part 2 tackles the internal machinery: cost structures that determine unit economics, learning effects that create competitive advantages, and incentive systems that align (or misalign) employee behavior with business goals.
These 9 laws explain why Tesla's vertical integration strategy works, how Amazon's operational scale creates unbeatable cost advantages, why Google's performance metrics sometimes backfire, and how organizational dysfunction emerges even in well-intentioned companies. From production economics (returns to scale, learning curves, scope economies) to organizational behavior (incentives, principal-agent problems, Parkinson's Law), this is the economic foundation of operational excellence.
Scaling Economics: When to scale production, how unit costs change with volume, and where diseconomies emerge
Learning Effects: How experience curves create cost advantages and when learning-by-doing justifies market share pursuit
Scope Advantages: When diversification reduces costs versus when focus wins
Incentive Design: How to align employee behavior with business goals without triggering gaming and metric manipulation
Organizational Dysfunction: Why bureaucracy grows, why people get promoted to incompetence, and how to counter these forces
Let's start with the most fundamental production law: returns to scale.
12. Returns to Scale: When Doubling Inputs Doesn't Double Output
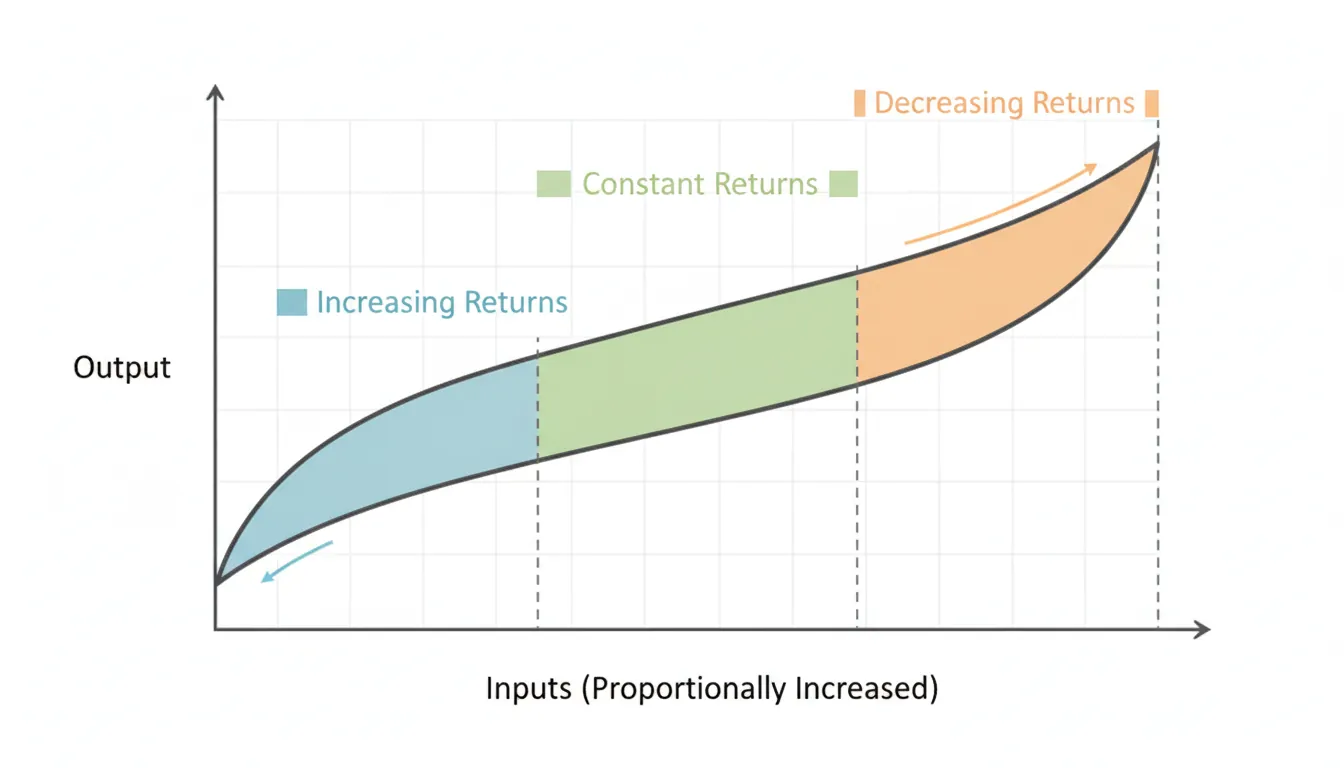
Core Principle: Returns to scale describe what happens to output when you proportionally increase all inputs. Increasing returns = output more than doubles. Constant returns = output exactly doubles. Decreasing returns = output less than doubles.
Figure: Returns to scale curve showing how output changes when all inputs are proportionally increased — illustrating increasing, constant, and decreasing returns zones.
Scenario: Double infrastructure investment (servers, data centers, networking)
Double inputs (cost): $100B → $200B total infrastructure
More than double output (capacity): Better server utilization (80% vs. 60%), bulk purchasing discounts (40% cheaper per unit), shared services (one global CDN serves 2x customers)
Result: 2.5x capacity increase for 2x cost increase = increasing returns to scale
Strategic advantage: Scale becomes an unbeatable moat—no competitor can match AWS economics without matching scale
Returns to ScaleEconomies of Scale
Business Applications
For Operations Teams: Identify if your business has increasing returns to scale. Software yes (zero marginal cost). Professional services no (linear scaling). Manufacturing maybe (depends on automation vs. labor mix).
For Strategy Teams: In industries with increasing returns to scale, prioritize market share over short-term profitability. First mover advantage is massive—Amazon poured billions into AWS infrastructure when unprofitable, now has 32% market share and 70%+ margins.
For Finance Teams: Model scale scenarios carefully. Decreasing returns to scale = diseconomies emerging (bureaucracy, complexity). Signal to split into smaller units or divest non-core assets.
Identifying Returns to Scale Type Increasing Returns: Software, platforms, networks (fixed costs dominate) Constant Returns: Retail, franchises (replicable business model) Decreasing Returns: Custom services, creative work (key resources don't scale) Red Flag: If scaling from 100 → 200 employees makes coordination harder, you're hitting decreasing returns
13. Learning Curve Effect: Experience as Competitive Advantage
Core Principle: As cumulative production volume doubles, unit costs decline by a constant percentage (typically 10-30%). Not about time—about repetition. Experience makes you more efficient.
Real-World Application: Tesla Battery Cost Decline
Manufacturing Excellence
How Tesla Achieved 90% Battery Cost Reduction
2010 Roadster (first 2,500 units):
Battery cost: $1,000/kWh
Manufacturing approach: Manual assembly, high defect rates
Cumulative learning: Every doubling of production → 20% cost reduction
Strategic Moat:
Tesla's 5M+ cumulative vehicle production = decades of learning curve advantage
New EV startups (Lucid, Rivian) start at 2010 Tesla cost levels—can't compete on cost until they achieve similar scale
Learning CurveManufacturing
Business Applications
For Operations Teams: Track learning curve rate for your production processes. Plot log-log chart of cumulative volume vs. unit cost. Slope = learning rate. Use this to forecast future costs at higher volumes.
For Strategy Teams: First mover advantage in manufacturing-heavy industries comes from learning curve, not innovation. Boeing vs. Airbus—decades of production experience = cost advantage new entrants can't match without producing similar cumulative volumes.
For Pricing Teams: Price aggressively early to gain volume, move down learning curve faster than competitors. Once cost advantage achieved, raise prices—competitors can't match profitability. Classic strategy: penetration pricing → volume → learning → cost leadership → margin expansion.
Learning Curve Formula & Strategy Formula: Y = aX^b (where Y = unit cost, X = cumulative volume, b = learning rate) Typical Rates: Aerospace (80% - every doubling = 20% cost reduction), Electronics (70%), Services (90%) Strategic Implication: Industries with steep learning curves (70-80%) favor early movers and high-volume producers Decision Rule: If learning rate <85%, prioritize volume growth over margins in early years
14. Economies of Scope: Leveraging Shared Resources
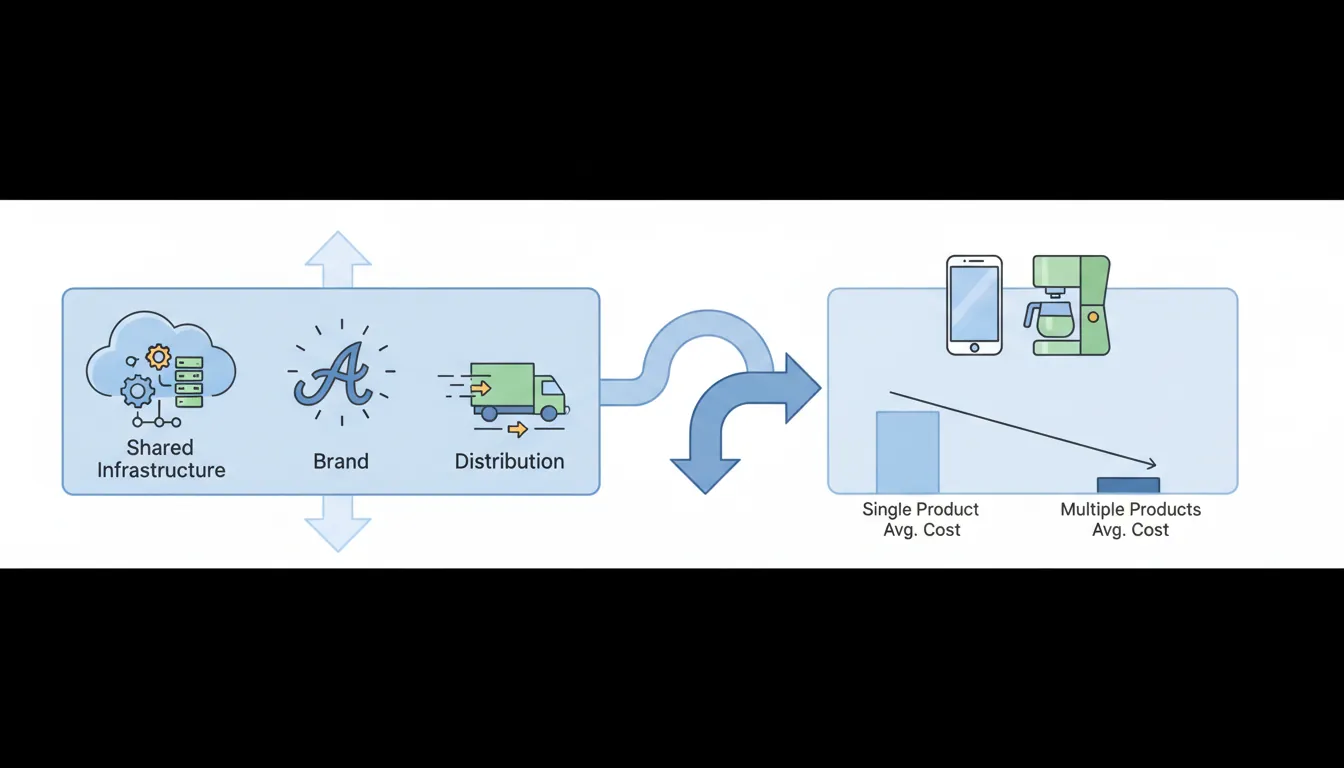
Core Principle: Economies of scope occur when producing multiple products together is cheaper than producing them separately. Shared resources (infrastructure, brand, distribution, R&D) reduce average cost per product.
Figure: Economies of scope illustration showing how shared infrastructure, brand, and distribution reduce average cost when producing multiple products together.
Real-World Application: Amazon's Business Model
Scope Economics
How Amazon Leverages Shared Infrastructure
Shared Resource: Fulfillment Network
Retail: Stores and ships Amazon.com orders
FBA (Fulfillment by Amazon): Same warehouses fulfill third-party seller orders
External product: Sold to enterprises as AWS ($90B revenue)
Scope synergy: R&D costs amortized across 2 customer bases
Shared Resource: Brand & Customer Base
Prime membership: Drives adoption of Prime Video, Music, Reading
Cross-sell: Customer who joins for fast shipping subscribes to video → no new customer acquisition cost
Economies of ScopePlatform Strategy
Business Applications
For Product Teams: Identify shared resources that can power multiple products. Shopify's merchant dashboard powers online stores, POS, payments, shipping—one codebase, multiple revenue streams.
For Strategy Teams: M&A based on scope economies. Disney bought Marvel, Star Wars, Pixar—shared distribution (Disney+), shared merchandising, shared theme park attractions. Each IP is more valuable in Disney's portfolio than standalone.
For Finance Teams: Calculate scope economies through joint cost allocation. If producing A+B together costs less than producing A alone + B alone, scope economies exist. Quantify synergy value in acquisition models.
Economies of Scope vs. Economies of Scale Scale: Lower cost per unit as volume increases (more of same thing) Scope: Lower cost per product as variety increases (more different things using shared resources) Example: Walmart has scale (bulk purchasing), Amazon has scope (shared fulfillment) Best Strategy: Combine both—shared platform (scope) serving high volume (scale)
15. Law of Increasing Complexity: When Growth Creates Chaos
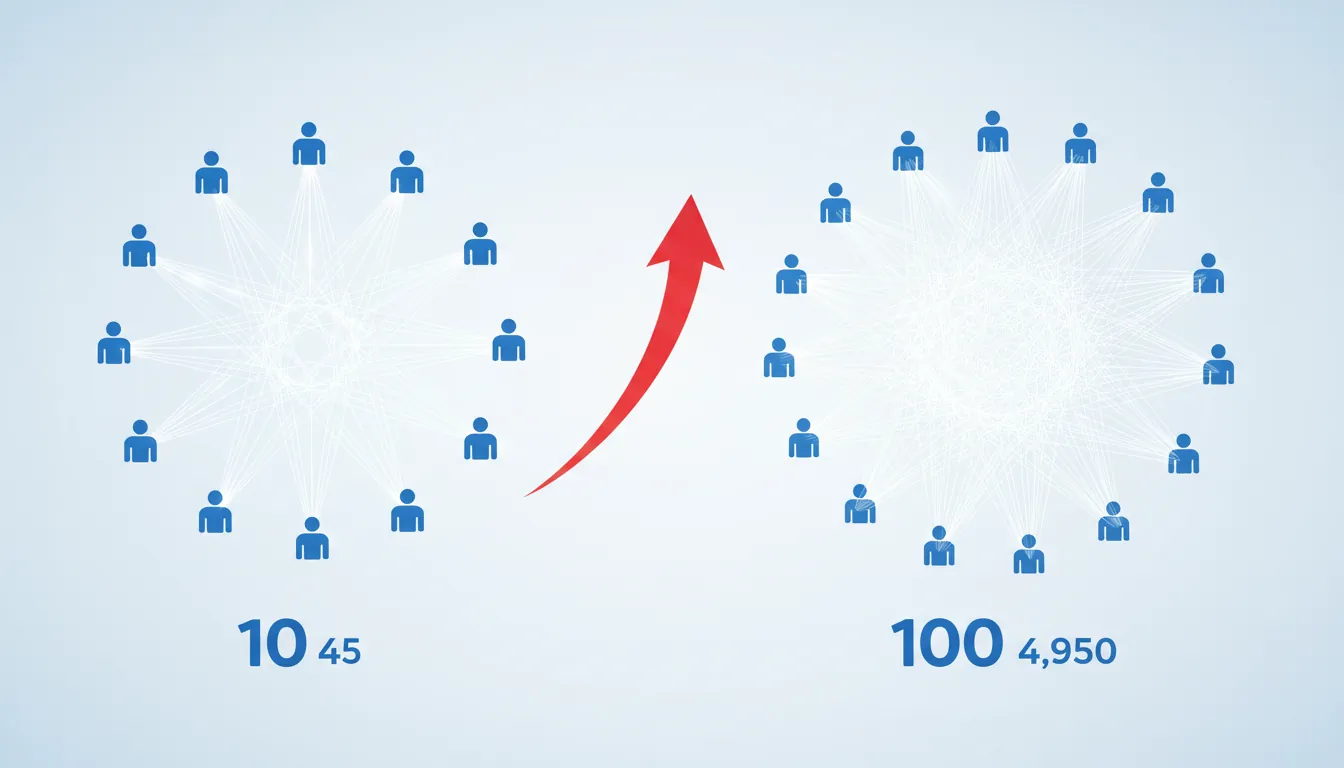
Core Principle: As organizations grow, complexity increases exponentially (not linearly). Communication pathways = n(n-1)/2 where n = people. 10 people = 45 connections. 100 people = 4,950 connections. Coordination costs can overwhelm productivity gains.
Figure: Communication complexity explosion — 10 people create 45 pathways, while 100 people create 4,950 pathways, showing why coordination costs grow exponentially.
Real-World Application: The Two-Pizza Team Rule
Organizational Design
Amazon's Solution to Complexity Explosion
The Problem: Large Teams Slow Down
5-person team: Ship feature in 2 weeks, minimal meetings, direct communication
20-person team: Ship same feature in 8 weeks—4x slower despite 4x resources
Principle: Team should be small enough to feed with two pizzas (~6-8 people)
Autonomy: Each team owns full feature/service, minimal dependencies
APIs: Teams interact through documented interfaces, not meetings
Result: Reduced complexity—10 small teams outship 1 large team of 100
Evidence of Complexity Costs:
Brooks's Law: "Adding engineers to late project makes it later" (coordination > productivity)
Mythical Man-Month: 9 women can't have a baby in 1 month—some work doesn't parallelize
ComplexityOrganizational Design
Business Applications
For Leadership Teams: Combat complexity through org design. Spotify's "squads and tribes" model, Valve's flat hierarchy, Basecamp's 3-person teams—all minimize coordination overhead. Don't solve problems by adding people—solve by reducing dependencies.
For Operations Teams: Simplify processes as you scale. Each process decision = permanent complexity tax. Amazon's "mechanisms not meetings" philosophy—replace recurring coordination with automated systems.
For Product Teams: Modular architecture reduces complexity. Microservices, APIs, plug-in systems—allow teams to work independently. Monolithic codebases require coordination = exponential complexity growth.
Complexity Warning Signs Red Flags:
Decision velocity slowing despite adding people
Meetings proliferating to align stakeholders
Features taking longer to ship as team grows
Email/Slack volume overwhelming workers
Solutions: Split teams, reduce dependencies, automate coordination, eliminate unnecessary work
16. Law of Incentives: Aligning Behavior with Strategy
Core Principle: People respond to incentives—often in unintended ways. What you measure and reward becomes what people optimize for, not necessarily what you want.
Incentive Design: Sales quotas tied to number of accounts opened per customer
Goal: Increase cross-selling (get customers to use multiple products)
Metric: Accounts per customer (wanted 8 per household)
Rewards: Bonuses, promotions, job security for hitting quotas
Unintended Consequences:
What happened: Employees opened 3.5M fake accounts without customer consent
Why: Metric rewarded quantity over quality, no penalty for fake accounts
Result: $3B in fines, CEO fired, brand destroyed
Lesson: Narrow incentives create narrow optimization. Must align metrics with long-term customer value, not short-term actions.
IncentivesCompetition
Designing Better Incentives
Best Practice
Amazon's Customer Obsession Metrics
Sales Team Incentives:
? Bad metric: Revenue per customer (encourages upselling junk)
? Good metric: Customer lifetime value (CLV) - repeat purchase rate
Customer Service Team:
? Bad metric: Calls resolved per hour (encourages rushing customers)
? Good metric: Customer satisfaction score + first-contact resolution
Product Team:
? Bad metric: Features shipped (encourages bloat)
? Good metric: User adoption of features + retention impact
Business Applications
For HR/Compensation Teams: Audit all incentive structures quarterly. Ask: "If employees maximally optimize for this metric, what's the worst thing that could happen?" Test incentives with small pilots before rolling out company-wide.
For Sales Teams: Balance short-term metrics (quarterly revenue) with long-term metrics (customer retention, expansion revenue). Weight compensation 60/40 between the two. Punish bad revenue (high churn accounts).
For Leadership: Culture is what you incentivize, not what you say. If you preach collaboration but reward individual performance, you'll get silos. Measure and reward team outcomes.
Incentive Design Checklist
Before implementing any incentive system:
Alignment: Does it drive the behavior we actually want?
Gaming: How could someone game this metric unfairly?
Unintended consequences: What could go wrong if maximized?
Balance: Do we incentivize both quality and quantity?
Long-term: Does it reward sustainable vs. extractive behavior?
17. Goodhart's Law: When Measures Become Targets
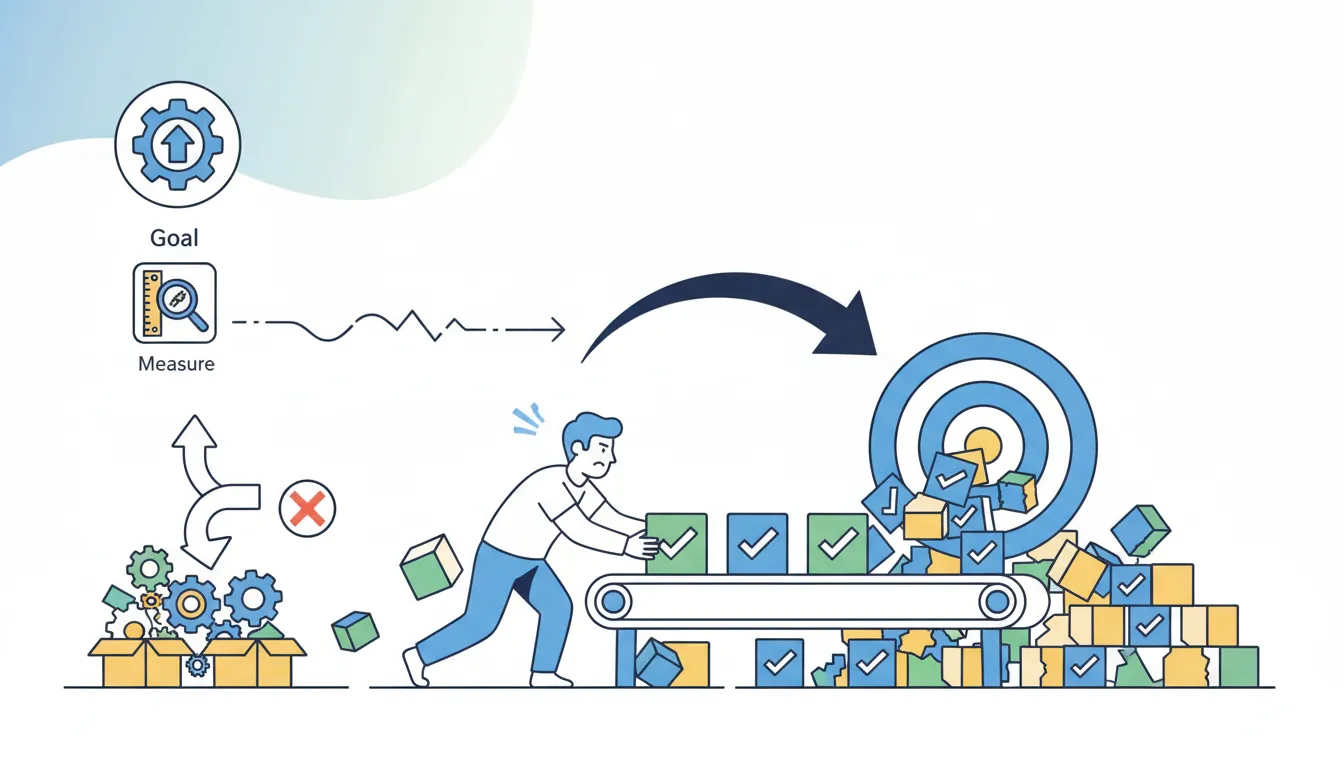
Core Principle: "When a measure becomes a target, it ceases to be a good measure." People optimize for the metric instead of the underlying goal, often with perverse outcomes.
Figure: Goodhart's Law in action — when a measure becomes a target, people optimize for the metric instead of the underlying goal, often producing perverse outcomes.
The Metric: Cross-sell Ratio (accounts per customer)
Original intent: Measure customer satisfaction and product fit
Became target: Employees judged and compensated on cross-sell numbers
Gaming behavior: Opened 3.5M+ fake accounts without customer permission
Why gaming worked: Metric went up, actual value (customer relationships) went down
Consequences:
Fines: $3B in regulatory penalties
Stock crash: 30% drop in market cap ($35B loss)
CEO resignation: John Stumpf forced out
Lesson: Optimizing for the wrong measure destroys value faster than creating it
Goodhart's LawMetrics Design
Business Applications
For Leadership Teams: Design metrics that are hard to game. Instead of "lines of code" (easily gamed by writing bloated code), use "features shipped that customers use." Instead of "calls handled" (incentivizes rushing), use "issues resolved on first call."
For HR Teams: Avoid single-metric performance reviews. Netflix doesn't track hours worked—managers judge output and impact. Google's OKRs separate ambitious goals (60-70% achievement expected) from performance reviews (prevents gaming by setting easy goals).
For Product Teams: Be skeptical of vanity metrics. "Daily active users" can be gamed by annoying notifications. Better metric: "engaged users who find value" (harder to fake). Goodhart's Law explains why MAU is often misleading—companies game it through spam.
Preventing Goodhart's Law Strategy 1: Use multiple complementary metrics (can't game all simultaneously) Strategy 2: Measure leading indicators AND lagging outcomes Strategy 3: Rotate metrics periodically (prevents long-term gaming) Strategy 4: Qualitative checks alongside quantitative targets (manager discretion)
18. Principal-Agent Problem: Misaligned Interests
Core Principle: The principal-agent problem occurs when one party (agent) makes decisions on behalf of another (principal), but their interests don't align. Classic example: shareholders (principals) vs. executives (agents).
Real-World Application: Executive Stock Options
Alignment Strategy
How Stock Comp Aligns Principal-Agent Interests
The Problem: Executives' Incentives → Shareholders' Interests
Shareholders want: Long-term value creation, sustainable growth
Salaried execs want: Job security, short-term targets, empire building
Conflict: Exec might reject risky but valuable projects to protect their job
Solution: Stock Options with Vesting
Grant: CEO receives options for 1M shares at $50/share
Vesting: 25% per year over 4 years (must stay to realize value)
Alignment: If stock hits $100, CEO makes $50M (same 2x return as shareholders)
Result: CEO now incentivized to take smart risks that grow company value
Remaining Problems:
Short-termism: Options can incentivize pumping stock before vesting, then dumping
Risk-taking: Options have asymmetric payoff—huge upside, limited downside (can't go below zero)
Better solution: Restricted stock units (RSUs) that align on downside too
Principal-AgentIncentive Design
Common Principal-Agent Problems in Business
Context
Principal
Agent
Misalignment
Solution
Corporate Governance
Shareholders
Executives
Execs prioritize perks, job security over shareholder value
For HR Teams: Design compensation to align interests. Sales reps on commission optimize for closing deals (agent interest). Add customer retention bonuses to align with company's long-term interest (principal).
For Strategy Teams: Recognize when you're the agent, not the principal. Consultants (agents) are paid for recommendations, not results—creates incentive to recommend expensive projects regardless of ROI. Solution: tie fees to implementation success.
For Investors: Due diligence on management alignment. How much stock do founders own? What's the vesting schedule? Are there super-voting shares? Misaligned management = avoid investment.
Solving Principal-Agent Problems Alignment: Make agent's financial outcomes depend on principal's success Monitoring: Regular audits, transparency requirements, oversight boards Incentives: Bonuses tied to long-term metrics, deferred compensation Competition: Multiple agents competing reduces individual power to exploit principal
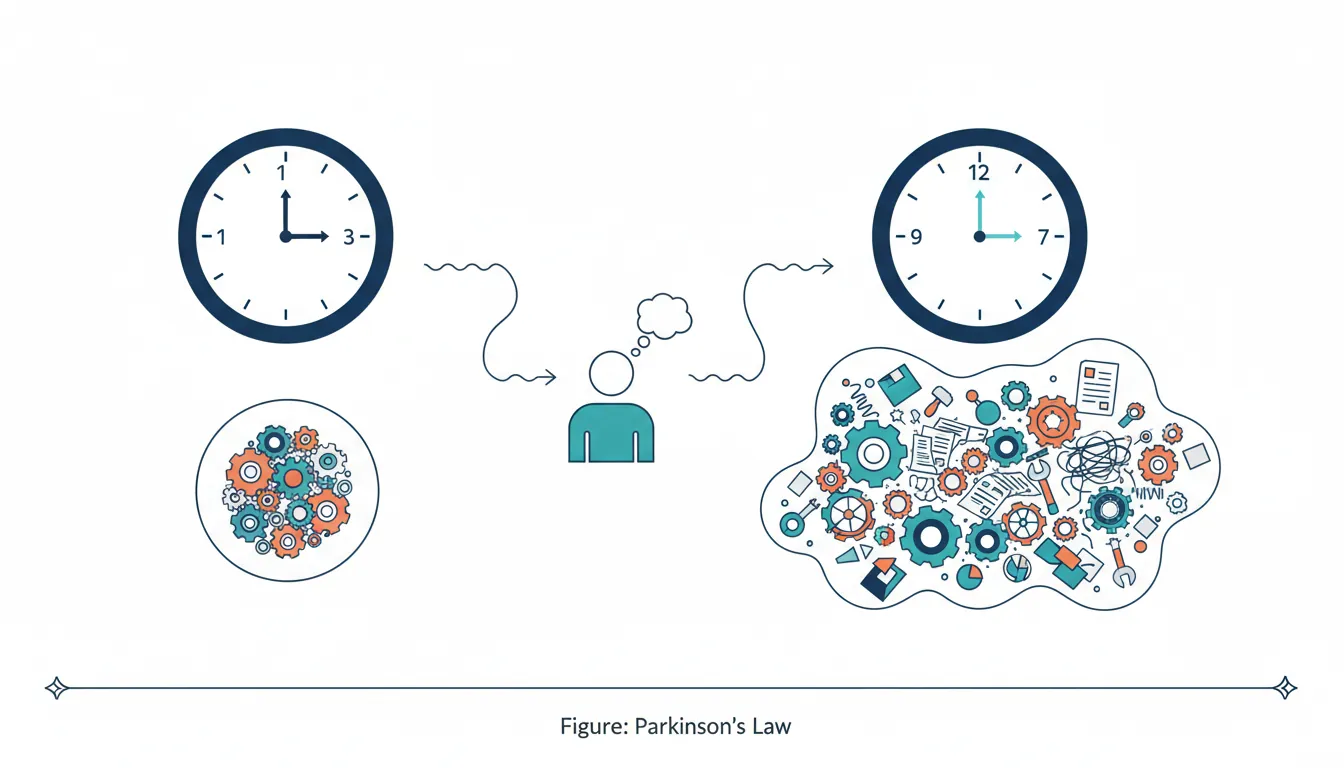
19. Parkinson's Law: Work Expands to Fill Time
Core Principle: "Work expands so as to fill the time available for its completion." Give someone 1 hour for a task, they'll finish in 1 hour. Give them 1 week, they'll take the full week. Organizational corollary: bureaucracies grow regardless of actual workload.
Figure: Parkinson's Law illustrating how the same task expands or contracts to fill whatever time is allotted — a one-hour deadline versus a one-week deadline.
Real-World Application: Government vs. Startup Efficiency
For Project Managers: Set aggressive deadlines. Amazon's "working backwards" from launch date forces teams to cut scope, not extend timelines. Tight deadlines = creative problem-solving. Loose deadlines = bikeshedding and feature creep.
For Leadership Teams: Combat bureaucratic expansion. Parkinson observed that bureaucracies grow 5-7% annually regardless of workload. Solution: zero-based budgeting (justify every headcount from scratch), regular org reviews, flat hierarchies.
For Product Teams: Time-boxing decisions. Basecamp's "6-week cycles" force teams to ship something in fixed time. Can't extend deadline → must cut scope or ship MVP. Prevents perfectionism and over-engineering.
Counteracting Parkinson's Law Tight deadlines: Create artificial urgency (ship before conference, beat competitor launch) Resource constraints: Limited budget forces prioritization Public commitments: Announcing launch date creates accountability Incremental delivery: Ship MVPs → prevents work from expanding indefinitely
20. Peter Principle: Rising to Your Level of Incompetence
Core Principle: "In a hierarchy, people tend to rise to their level of incompetence." Great engineers get promoted to engineering managers (different skillset), great salespeople become sales managers (now bad at their job). Result: organizations fill management ranks with incompetent people.
Real-World Application: The Manager Track Trap
Career Trap
How Companies Lose Great Individual Contributors
Scenario: Top Software Engineer
IC Level 5: Excellent engineer, ships critical features, loves coding
Promotion to Manager: Only path to higher pay/status in most orgs
New role: Now spends 80% time in meetings, performance reviews, hiring—zero coding
Outcome: Company loses great engineer, gains mediocre manager (no management training or aptitude)
Peter Principle in action: Rose to level of incompetence (management)
Solution: Dual Career Tracks (Google, Meta, Netflix)
IC track: Staff Engineer → Senior Staff → Principal → Distinguished (equivalent to Director → VP)
Manager track: Engineering Manager → Senior EM → Director → VP
Result: Top engineers can earn $500K+ without managing anyone—no forced incompetence
Peter PrincipleCareer Ladders
Business Applications
For HR Teams: Create parallel career tracks. Let people progress in their area of competence. Microsoft's IC track goes to "Technical Fellow" (reports to CEO, $1M+ comp)—no need to switch to management to advance.
For Leadership Teams: Promote based on fit for next role, not performance in current role. Great salesperson → great sales manager. Require management training before promotion, trial periods as "acting manager," or rotate people back to IC roles if management doesn't work out.
For Individuals: Recognize your zone of genius. If you love individual contribution (coding, design, writing), don't take management job for title/money. Negotiate for IC advancement or leave for company with better IC track.
Preventing the Peter Principle Dual tracks: IC and management paths with equal prestige/compensation Lateral moves: Allow "demotions" without stigma if role isn't working Skills assessment: Promote based on abilities needed for next role, not past performance Management training: Teach skills before promoting, not after failure
The 9 laws in this guide form the operational backbone of successful organizations. Production laws (returns to scale, learning curves, scope economies, complexity management) determine how efficiently you scale. Organizational laws (incentives, Goodhart's, principal-agent, Parkinson's, Peter Principle) determine whether your people execute effectively. Master both to build operationally excellent companies.
Strategic Scaling Framework: 4-Stage Decision Process
Integrated Framework
How All 9 Laws Connect in Scaling Decisions
Stage 1: Evaluate Returns to Scale (Law 12)
Question: Does our business model have increasing, constant, or decreasing returns to scale?
Learning curve: Price aggressively early to gain cumulative volume → move down cost curve faster than competitors (Tesla batteries: 90% cost reduction)
Economies of scope: Identify shared resources that can power multiple products (Amazon fulfillment network serves retail, FBA, Prime Now, Fresh)
Synergy: Combine both—high volume (learning) across multiple products (scope) = unbeatable cost position
Stage 3: Combat Complexity Explosion (Law 15)
Problem: Scaling from 10 → 100 → 1,000 people creates n(n-1)/2 communication pathways = exponential coordination costs
Solution: Two-Pizza Teams (6-8 people), API-first architecture, mechanisms over meetings
Warning sign: If doubling headcount doesn't double output, you've hit complexity wall → reorganize before continuing to scale
Avoid Peter Principle (Law 20): Dual career tracks (IC and management), promote based on fit for next role
Case Study: Spotify's Scaling Excellence
All 9 Laws Applied
How Spotify Built a 500M User Platform Without Complexity Collapse
Returns to Scale (Law 12): Streaming has massive increasing returns—fixed music licensing costs spread across 500M users vs. 50M = 10x lower cost per user. Invested billions in growth before profitability.
Learning Curve (Law 13): Recommendation algorithm improves with every listen—500B+ streams = decades of learning curve advantage over new entrants. Apple Music/YouTube Music can't match recommendation quality without similar data volume.
Economies of Scope (Law 14): Shared infrastructure powers music streaming, podcast hosting, audiobook delivery, artist tools—one R&D budget, four revenue streams.
Complexity Management (Law 15): "Squads and Tribes" model—small autonomous teams (6-8 people) own full features end-to-end. 200+ squads operate independently via APIs. Avoided coordination explosion that kills most 5,000-person companies.
Incentive Alignment (Law 16): Teams measured on user engagement metrics (stream completion rate, playlist saves), not vanity metrics (downloads). Prevents gaming—can't fake genuine engagement.
Goodhart's Law (Law 17): Uses balanced scorecard: (1) User engagement, (2) Artist satisfaction, (3) Revenue growth, (4) Cost efficiency. Can't optimize all four by gaming—forces real value creation.
Principal-Agent (Law 18): Exec comp heavily weighted toward stock (70%+). When Spotify stock crashes, execs feel the pain—aligns incentives with long-term shareholder value.
Parkinson's Law (Law 19): Uses 6-week release cycles (like Basecamp). Can't extend deadline—forces ruthless prioritization. Ships MVPs, iterates based on feedback. No 3-year projects.
Peter Principle (Law 20): Offers parallel IC and management tracks. Top engineers can reach "Principal Engineer" (reports to CTO, $500K+ comp) without managing anyone. Retains technical talent.
Are agent incentives aligned with principal goals?
No → stock comp for execs, retention bonuses for sales, outcome-based fees for consultants
Parkinson's Law
Are we setting deadlines tight enough to force prioritization?
No → create artificial urgency, time-box decisions, ship MVPs, use public commitments for accountability
Peter Principle
Are we promoting based on current performance or fit for next role?
Current performance → create dual tracks (IC and management), assess skills needed for promotion, allow lateral moves
Common Scaling Pitfalls
5 Mistakes That Kill Scaling Companies
Pitfall 1: Ignoring Complexity Costs
Mistake: Adding headcount to solve problems without fixing dependencies
Result: Coordination overhead exceeds productivity gains (Brooks's Law)
Solution: Split teams, reduce coupling, API-first architecture before scaling further
Pitfall 2: Optimizing for the Wrong Metrics
Mistake: Measuring activity (lines of code, calls handled) instead of outcomes (features adopted, issues resolved)
Result: Goodhart's Law—metric goes up, actual value goes down
Solution: Metric audit quarterly, ask "what's the worst gaming strategy?"
Pitfall 3: Scaling Before Product-Market Fit
Mistake: Assuming increasing returns to scale exist when they don't
Result: Burn cash scaling a broken model (WeWork, Quibi)
Solution: Validate returns to scale empirically—test at small scale before massive investment
Pitfall 4: Misaligned Incentives
Mistake: Rewarding short-term actions that destroy long-term value (Wells Fargo accounts, Uber driver churn)
Result: Principal-agent problem—employees optimize for bonuses, not company success
Solution: Balance short-term and long-term metrics (60/40 split), punish bad revenue
Pitfall 5: Forcing Management Promotions
Mistake: Only path to advancement is management (Peter Principle)
Result: Lose great ICs, gain mediocre managers
Solution: Dual career tracks with equal prestige and compensation
Team Applications: Operations, HR & Strategy
Each function applies these 9 laws differently. Operations focuses on production efficiency and scaling. HR designs incentive systems and career paths. Strategy determines when to scale, what to build in-house, and how to structure the organization.
Operations Team Applications
Operations Playbook
Production Efficiency & Complexity Management
Apply Returns to Scale to Capacity Planning:
Identify returns type: Plot output vs. input for your processes. If doubling inputs produces >2x output, you have increasing returns → scale aggressively. If <2x, you have decreasing returns → split into smaller units.
Software/cloud: Increasing returns (marginal cost ˜ $0) → invest in infrastructure ahead of demand. One global CDN serves 10M or 100M users with minimal cost difference.
Manufacturing: Constant returns (replicable processes) → add capacity in modules. Auto plants scale linearly—each new line costs same as previous.
Decision rule: If marginal cost < 10% of average cost, you have increasing returns. Prioritize volume over margins.
Use for pricing: If learning rate is 75%, forecast costs at 10x volume. Example: Current cost $100/unit at 1,000 units. At 2,000 units → $75. At 4,000 units → $56. At 8,000 units → $42. At 10,000 units → $40. Can price at $50 today knowing costs will drop to $40 at scale.
Competitive moat: Early volume leaders have cost advantage new entrants can't match without producing similar cumulative volumes. Tesla's 5M+ EVs = cost position Lucid/Rivian won't reach for 10+ years.
Leverage Economies of Scope for Multi-Product Efficiency:
Identify shared resources: Infrastructure, supply chain, R&D, brand, distribution. Calculate cost of producing A alone + B alone vs. producing A+B together. If joint production cheaper → scope economies exist.
Example: Amazon fulfillment network costs $100B to build. Serves retail ($400B revenue), FBA ($100B), Prime Now, Fresh. Average cost per business = $25B. If each business built separately → $100B each = 4x more expensive. Scope advantage = $300B saved.
M&A implication: Acquire products that leverage existing infrastructure. Disney bought Marvel, Star Wars, Pixar—all use same distribution (Disney+), merchandising, theme parks. Synergy value = scope economies.
Combat Complexity Through Modular Architecture:
Problem: Communication pathways = n(n-1)/2. 10 people = 45 connections. 100 people = 4,950 connections (110x increase). Coordination costs explode exponentially.
Solution: Microservices, API-first design, plug-in systems. Teams interact through documented interfaces, not meetings. Amazon's "service-oriented architecture"—every team exposes APIs, other teams consume them. Reduces coupling = linear scaling.
Process simplification: Amazon's "mechanisms not meetings." Replace recurring coordination (status updates, alignment meetings) with automated systems (dashboards, alerts). Each eliminated meeting = permanent complexity reduction.
Warning signs: (1) Features take longer to ship as team grows, (2) Meetings proliferate, (3) Decision velocity slows. If present → reorganize before continuing to scale.
Apply Parkinson's Law to Operational Efficiency:
Tight deadlines: Amazon's "working backwards" from launch date. Can't extend deadline → must cut scope or ship MVP. Prevents feature creep and bikeshedding.
Resource constraints: Limited budget forces prioritization. Give team $1M and they'll spend $1M. Give them $100K and they'll find a way. Artificial scarcity drives efficiency.
Incremental delivery: Basecamp's 6-week cycles. Ship something every 6 weeks → prevents work from expanding indefinitely. Iterate based on feedback.
HR Team Applications
HR & People Ops Playbook
Incentive Design & Career Development
Design Incentives That Align with Long-Term Value:
Audit current incentives quarterly: Ask "If employees maximally optimize for this metric, what's the worst thing that could happen?" If bad outcome possible → redesign metric.
Sales team example: Don't incentivize revenue per customer (encourages upselling junk). Incentivize customer lifetime value (CLV) = initial sale + expansion revenue - churn. Weight: 40% new revenue, 60% retention/expansion.
Product team example: Don't incentivize features shipped (encourages bloat). Incentivize user adoption of features + retention impact. Track which features actually drive engagement.
Customer service example: Don't incentivize calls per hour (encourages rushing). Incentivize customer satisfaction score + first-contact resolution. Quality over quantity.
Balance short and long-term: 60/40 split between quarterly targets and annual goals. Prevents sacrificing long-term value for short-term bonuses.
Prevent Goodhart's Law Through Multi-Metric Systems:
Use complementary metrics: Can't optimize all simultaneously → forces real value creation. Example: Spotify's scorecard—(1) User engagement, (2) Artist satisfaction, (3) Revenue growth, (4) Cost efficiency. Gaming one hurts the others.
Rotate metrics periodically: Change metrics every 6-12 months. Prevents long-term gaming strategies from developing. Example: This quarter measure "time to first value," next quarter "activation rate," following quarter "retention cohorts."
Qualitative checks: Netflix doesn't track hours worked—managers judge output and impact. Combines quantitative metrics with manager discretion. Prevents pure metric gaming.
Separate goals from performance reviews: Google's OKRs are aspirational (60-70% achievement expected). Performance reviews judge impact, not OKR completion. Prevents gaming by setting easy goals.
Solve Principal-Agent Through Equity Compensation:
Executive alignment: Weight comp heavily toward stock (70%+ for C-suite). If company succeeds, they get rich. If company fails, they feel the pain. Aligns with shareholder interests.
Vesting schedules: 4-year vesting with 1-year cliff. Must stay to realize value → discourages short-term thinking and job-hopping. Clawback provisions for fraud/misconduct.
Sales team: Commission on initial sale + retention bonuses paid quarterly for 2 years. If customer churns → claw back portion of commission. Aligns sales with long-term account health.
Consultants/agencies: Tie fees to implementation success, not just recommendations. Example: 50% upfront, 50% paid when ROI targets hit. Aligns incentives with client outcomes.
Avoid Peter Principle with Dual Career Tracks:
Problem: If only path to advancement is management, great ICs become mediocre managers. Company loses excellent engineer, gains bad manager (Peter Principle).
Solution: Parallel IC and management tracks with equal prestige and compensation. Google: Staff Engineer → Senior Staff → Principal → Distinguished (equivalent to Director → VP → SVP). Top ICs earn $500K+ without managing anyone.
Promotion criteria: Promote based on fit for next role, not current performance. Great salesperson → great sales manager (different skillsets). Require management training, trial periods ("acting manager"), rotate back to IC if not working.
Lateral moves without stigma: Allow "demotions" to IC roles without career penalty. Netflix: Managers can return to IC roles with title/comp intact if they prefer. Recognizes management isn't for everyone.
Combat Parkinson's Law in Hiring & Org Growth:
Problem: Parkinson observed bureaucracies grow 5-7% annually regardless of workload. More people → more meetings → more coordination → less productivity.
Zero-based budgeting for headcount: Justify every role from scratch annually. Can't just say "we had 100 people last year, need 110 this year." Must prove why each incremental role adds value.
Hire only when pain is severe: Amazon's "work backwards" from customer need. Don't hire proactively → hire reactively when team is clearly underwater on critical work.
Regular org reviews: Quarterly review of team structure. Ask: (1) Is decision velocity slowing? (2) Are meetings proliferating? (3) Is bureaucracy growing? If yes → simplify before adding people.
Strategy Team Applications
Strategy Playbook
Scaling Strategy & Organizational Design
Determine Returns to Scale to Guide Growth Strategy:
Assess business model: Does doubling inputs more than double outputs? Software (yes → increasing returns), Services (no → linear), Manufacturing (maybe → depends on automation).
If increasing returns: Prioritize market share over profitability. Invest heavily in growth even at losses (AWS lost money for years, now 70%+ margins). First mover advantage is massive—winner often captures 50-80% market share.
If constant returns: Focus on efficient replication. Franchise model (McDonald's)—master one location, replicate everywhere. Capital efficiency matters more than raw scale.
If decreasing returns: Don't scale—optimize current operations or split into smaller units. Professional services firms hit coordination limits at 500-1,000 people → spin off new firms instead of growing existing one.
Build vs. Buy Using Learning Curve & Scope Economics:
Learning curve analysis: If steep learning curve (70-80%), build in-house to capture cost reductions. Tesla batteries—built Gigafactory to move down curve faster than suppliers. Now has cost advantage no competitor can match.
If shallow learning curve (90%+): Buy from specialists. Outsource chips, sensors, logistics—minimal cost advantage from cumulative volume.
Economies of scope: Build if resource can power multiple products (shared platform). Amazon built fulfillment network—now serves retail, FBA, Prime Now, Fresh. Scope economies = $300B+ value. Buy if single-use (no leverage across products).
Two-Pizza Teams: Keep teams small (6-8 people). Amazon rule: team should be feedable with two pizzas. Autonomy over full features → minimal dependencies.
Spotify's Squads & Tribes: Squads (small teams) own features. Tribes (groups of squads) share domain. Guilds (cross-tribe) share expertise. Balances autonomy with coordination.
Valve's flat hierarchy: No managers. Employees choose projects. Works for creative work where coordination costs exceed management value. Doesn't scale beyond ~500 people.
Basecamp's 3-person teams: Extreme small teams for maximum velocity. Trade coordination for speed. Works for product companies with modular architecture.
When to Scale vs. When to Split:
Scale if: (1) Increasing returns to scale, (2) Complexity manageable through architecture, (3) Shared resources power multiple products (scope), (4) Learning curve benefits significant.
Split if: (1) Decreasing returns (coordination costs exceeding productivity gains), (2) Complexity unmanageable (decision velocity slowing), (3) No shared resources (each business independent), (4) Different incentive structures needed.
Example—Split: Private equity portfolio (decreasing returns from holding company, minimal shared resources, different incentives per company).
M&A Strategy Using Scope Economics:
Target acquisitions with shared resources: Disney bought Marvel, Star Wars, Pixar. All use same distribution (Disney+), merchandising, theme parks. Each IP more valuable in Disney portfolio than standalone.
Calculate synergy value: Cost of A alone ($X) + B alone ($Y) vs. A+B together ($Z). If Z < X+Y → scope economies = (X+Y) - Z. Example: If separate = $200M each = $400M total. Combined = $250M → $150M synergy.
Avoid conglomerate discount: If no shared resources, markets value separately (sum of parts > holding company). GE's conglomerate broke up—no synergies between jet engines and light bulbs.
Portfolio Management to Prevent Parkinson's Law:
Kill bottom 10% of projects quarterly: Prevents bureaucracy accumulation. Google's "kill meeting"—every quarter, bottom performers get cut. Frees resources for high-ROI bets.
Two-way door decisions: Amazon's framework. Reversible decisions → decide fast, iterate. Irreversible decisions → slow, deliberate. Don't treat all decisions as one-way doors (causes Parkinson's Law paralysis).
Time-box strategic initiatives: 6-month max for MVPs. If can't validate hypothesis in 6 months → kill or pivot. Prevents work from expanding indefinitely.
Cross-Functional Collaboration
How Teams Must Work Together
Operations + Strategy: Strategy identifies returns to scale, Operations implements scaling plan. Strategy says "scale," Operations figures out how without hitting complexity wall.
HR + Strategy: Strategy determines org structure (small teams, flat hierarchy), HR implements incentive systems and career tracks that support it.
Operations + HR: Operations identifies process bottlenecks, HR designs incentives to solve them (not just throw headcount at problems).
All Teams: Preventing Goodhart's Law, Parkinson's Law, and Peter Principle requires cultural buy-in. Can't solve with one function—needs company-wide commitment to (1) Hard-to-game metrics, (2) Tight deadlines, (3) Dual career tracks.
Conclusion & Next Steps
Understanding production economics and organizational behavior is critical for operational excellence. Returns to scale guide capacity decisions, learning curves justify market share investments, and proper incentive design prevents metric gaming. But even perfect operations don't guarantee success if you face fierce competition or weak market position.
The next guide explores how market structure and network effects create—or destroy—competitive moats.