We use cookies to enhance your browsing experience, serve personalized content, and analyze our traffic.
By clicking "Accept All", you consent to our use of cookies. See our
Privacy Policy
for more information.
Macro, Regulatory & Labour Economics: 19+ Laws for External Environment
January 24, 2026Wasil Zafar70 min read
Master the macroeconomic forces, regulatory dynamics, and workforce trends that shape your strategic environment—completing your economics education for business leadership. Part 8 of our 8-part Economics for Business Strategy series.
You've mastered market fundamentals, competitive positioning, strategic interaction, consumer psychology, innovation dynamics, and deal economics. But even the best internal strategies can be derailed by forces outside your control: recessions, inflation, regulatory changes, and labor shortages. Understanding macroeconomics, regulation, and workforce dynamics allows you to anticipate external shocks, adapt strategies to policy environments, and capitalize on economic cycles.
These 19+ laws cover macroeconomic forces (business cycles, inflation, interest rates, fiscal/monetary policy), regulatory dynamics (capture, public goods, externalities, antitrust), and labour markets (supply/demand, human capital, immigration). From navigating 2008's financial crisis to adapting to 2020's pandemic disruption to managing 2022's inflation spike—this is the economics of the external environment.
Setup: Berkshire Hathaway maintains $100-150B cash (2015-2019 expansion). Market criticized: "negative NPV to hold cash, should deploy into assets." Warren Buffett: "We build cash during expansions to act during recessions. Cash = optionality when others forced sellers."
2020 COVID Crash: Market drops 35% (March 2020). Most companies cut spending, hoard cash, survive. Berkshire deploys $30B: buys back stock (cheap valuation), invests in distressed energy companies (Occidental Petroleum), provides liquidity to investment-grade companies desperate for cash. Returns: 50-100% as market recovers (2020-2021).
Key Insight: Business cycles create profit opportunities for prepared companies. Build cash cushion in expansion (when easy to raise capital), deploy counter-cyclically in recession (when assets cheap). Companies that survive recessions emerge stronger—acquire distressed competitors, hire top talent laid off elsewhere, lock in long-term contracts at depressed prices. Recessions = reset button that punishes fragile, rewards prepared.
Business Applications
For Finance Teams: Cycle-proof balance sheet. Expansion: pay down debt, build cash, avoid leverage (prepare for downturn). Recession: deploy cash counter-cyclically, acquire distressed assets, lock in low interest rates (long-term debt). Most companies do opposite—lever up in booms (overconfident), deleverage in recessions (forced by lenders). Smart companies: conservative in booms (when capital cheap but assets expensive), aggressive in recessions (when assets cheap but capital scarce).
For Operations Teams: Flexible cost structure. Fixed costs (real estate, permanent staff, equipment) = vulnerable to revenue declines. Variable costs (contractors, cloud infrastructure, outsourcing) = scales with revenue. In recession: revenue drops 30% → fixed-cost company cuts 30% staff (morale damage, rehiring costs in recovery). Variable-cost company: costs automatically decline with revenue (no layoffs needed). Netflix: mostly variable costs (content licensing, cloud hosting)—scaled smoothly through 2008 recession while Blockbuster (fixed-cost retail) bankrupt.
For Strategy Teams: Counter-cyclical M&A. Expansions: high valuations, competitive bidding, expensive acquisitions. Recessions: low valuations, distressed sellers, negotiating leverage. Disney's playbook: bought Pixar ($7.4B, 2006 downturn), Marvel ($4B, 2009 recession), Lucasfilm ($4B, 2012 post-recession). All acquired at depressed valuations before recovery—created $100B+ value. Counter-cyclical acquisition strategy: wait for recessions, buy quality assets cheap, hold through recovery.
Second Case Study: Blackstone's Real Estate Counter-Cyclical Investing
Private EquityBusiness Cycles
Setup: Blackstone (world's largest real estate investor) follows disciplined counter-cyclical strategy: build cash during expansions (2005-2007: sold $30B properties near peak prices), deploy during recessions (2008-2010: bought $20B distressed properties at 40-60% discounts).
2008 Financial Crisis Execution: Commercial real estate prices drop 40% (peak to trough, 2007-2009). Most investors forced sellers (overleveraged, can't refinance debt). Blackstone deploys $15B buying: (1) Distressed office buildings NYC/SF (bought at $300/sq ft, worth $500/sq ft pre-crisis), (2) Hotel portfolios from bankrupt owners (Hilton acquisition, $26B leveraged buyout 2007, restructured in crisis), (3) Warehouses/logistics (bought before e-commerce boom).
Returns: Properties bought 2008-2010: average 25% IRR over 10 years (2008-2018 holding period). Comparison: properties bought at 2005-2007 peak: average 5% IRR (overpaid, hit by recession). Counter-cyclical timing drove 20% annual return differential = billions in outperformance. Key insight: same properties, different prices—cycle timing drives 80% of real estate returns. Blackstone's discipline: never deploy all capital in expansion (keep 40%+ dry powder for inevitable recession), never sell in panic during crash (patient capital advantage).
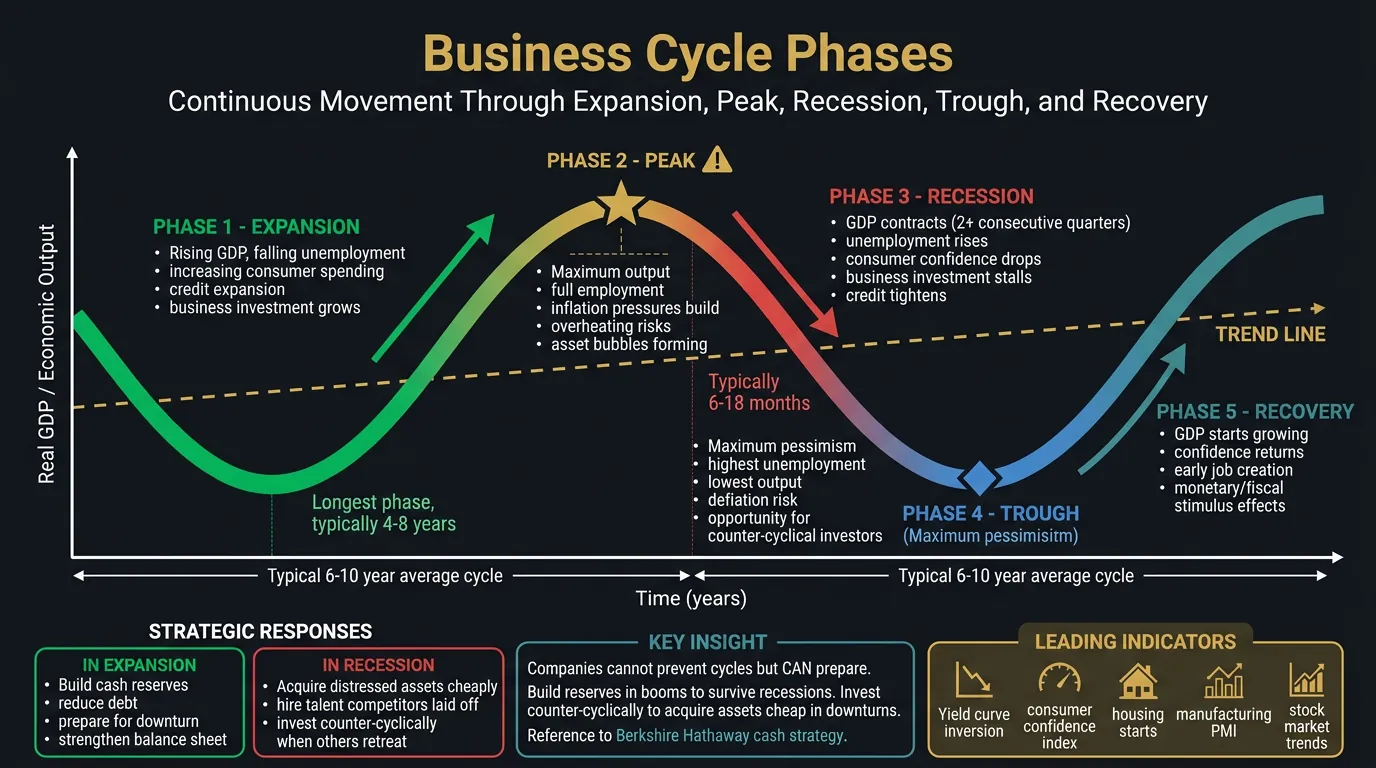
Business Cycle Strategy Framework Expansion (boom) strategy: Build cash reserves, pay down debt, avoid overextension, resist overconfidence, hire conservatively (talent expensive), plan for downturn Peak indicators: Record profit margins, low unemployment, aggressive valuations, easy capital, everyone optimistic (contrarian signal) Recession strategy: Deploy cash counter-cyclically, acquire distressed assets, hire top talent (laid off elsewhere), lock in long-term contracts (suppliers desperate), invest in R&D (competitors cutting) Trough indicators: Bankruptcies rising, unemployment high, pessimism universal, capital scarce (opportunity signal) Key insight: Be greedy when others fearful, fearful when others greedy (Warren Buffett)
Setup: Argentina: 100% annual inflation (2023). Costs double every year. Nominal revenues grow 100% (inflation-driven), but real revenues flat (no unit growth). Traditional accounting: massive profit growth (revenues up 100%). Reality: zero real growth, margin compression (input costs rise faster than prices).
Mercado Libre's Strategy: (1) Real-time pricing: adjust prices daily based on inflation, competitors, FX rates (algorithm-driven dynamic pricing). (2) Dollar-denominated contracts: negotiate supplier contracts in USD, not pesos (stable costs). (3) Fast inventory turnover: 30-day inventory cycle—buy inventory, sell before inflation erodes value. (4) Financial services: lending in inflation-indexed units (don't lose purchasing power on receivables). Result: maintained 50%+ gross margins despite hyperinflation (competitors with annual pricing cycles saw margins collapse).
Key Insight: Inflation = hidden tax on slow-moving companies. Fast movers (daily pricing, rapid inventory turns, inflation-indexed contracts) maintain margins. Slow movers (annual pricing, long inventory cycles, fixed contracts) see purchasing power eroded. Inflation penalizes operational sluggishness.
Business Applications
For Pricing Teams: Inflation requires dynamic pricing. Low inflation (2-3%): annual price increases sufficient. High inflation (>5%): need quarterly or real-time pricing adjustments. Subscription businesses (SaaS, streaming): build price escalators into contracts (CPI + 2% annual increases). Otherwise: locked into below-inflation pricing (revenue growth < cost growth = margin compression). Salesforce: contracts include 7-10% annual price increases—exceeds inflation, drives real revenue growth.
For Procurement Teams: Lock in long-term contracts in high-inflation environments. Inflation rising: secure 3-5 year fixed-price contracts (lock today's prices, benefit as inflation drives competitors' costs up). Inflation falling: negotiate short-term contracts (benefit from price declines). Airlines during 2020-2021: locked in fuel contracts when oil $40/barrel. Oil rose to $120/barrel (2022)—airlines with long-term contracts saved $1B+, competitors paid spot rates (margin destruction).
For Finance Teams: Inflation's balance sheet impact. Assets: cash loses purchasing power (hold minimal cash in high inflation), fixed assets appreciate (real estate, equipment worth more in nominal terms). Liabilities: fixed-rate debt becomes cheaper (paying back with devalued currency). Strategy in high inflation: minimize cash, maximize real assets (inventory, property, equipment), use fixed-rate debt (inflation erodes real debt burden). Turkey's tech companies (50% inflation): borrow in Turkish lira (fixed rate), invest in USD-denominated assets—debt effectively forgiven by inflation.
Second Case Study: Turkish Retailers During Lira Crisis (2021-2024)
BIM's Fast-Turn Strategy: (1) 7-day inventory cycle (vs. industry 30-day average)—buy inventory, sell within week before lira depreciates further. (2) Daily price updates (algorithm adjusts prices overnight based on FX rates, competitor pricing). (3) Dollar-linked supplier contracts (pay suppliers in TL equivalent of USD, protects from further devaluation). (4) Limited SKUs (800 items vs. CarrefourSA's 30,000)—easier to manage rapid price changes. Result: BIM maintained 10% gross margins despite 80% inflation. Sales volumes actually increased 15% (consumers shift from premium grocers to discount during inflation).
CarrefourSA's Slow-Turn Problem: (1) 45-day inventory cycle (hypermarkets hold more variety, longer shelf life). (2) Weekly pricing (too slow for 80% inflation—items bought Week 1 sold Week 6 at prices set Week 1 = margin destruction). (3) TL-denominated contracts (suppliers raising prices weekly, CarrefourSA can't pass through fast enough). Result: CarrefourSA gross margins collapsed from 22% (2020) to 12% (2023). Lost $100M+ to operational lag vs. inflation. Eventually sold Turkey operations to BIM-backed investor group (2024).
Key Insight: Hyperinflation = speed advantage. Fast inventory turns + dynamic pricing = survival. Slow turns + sticky pricing = margin destruction. BIM's $12B market cap (2024) vs. CarrefourSA exit shows: operational agility in high-inflation environments = competitive advantage. Companies that can reprice daily, turn inventory weekly win. Companies locked into monthly cycles lose.
Interest Rates & Capital Costs: Rates Affect Investment Decisions
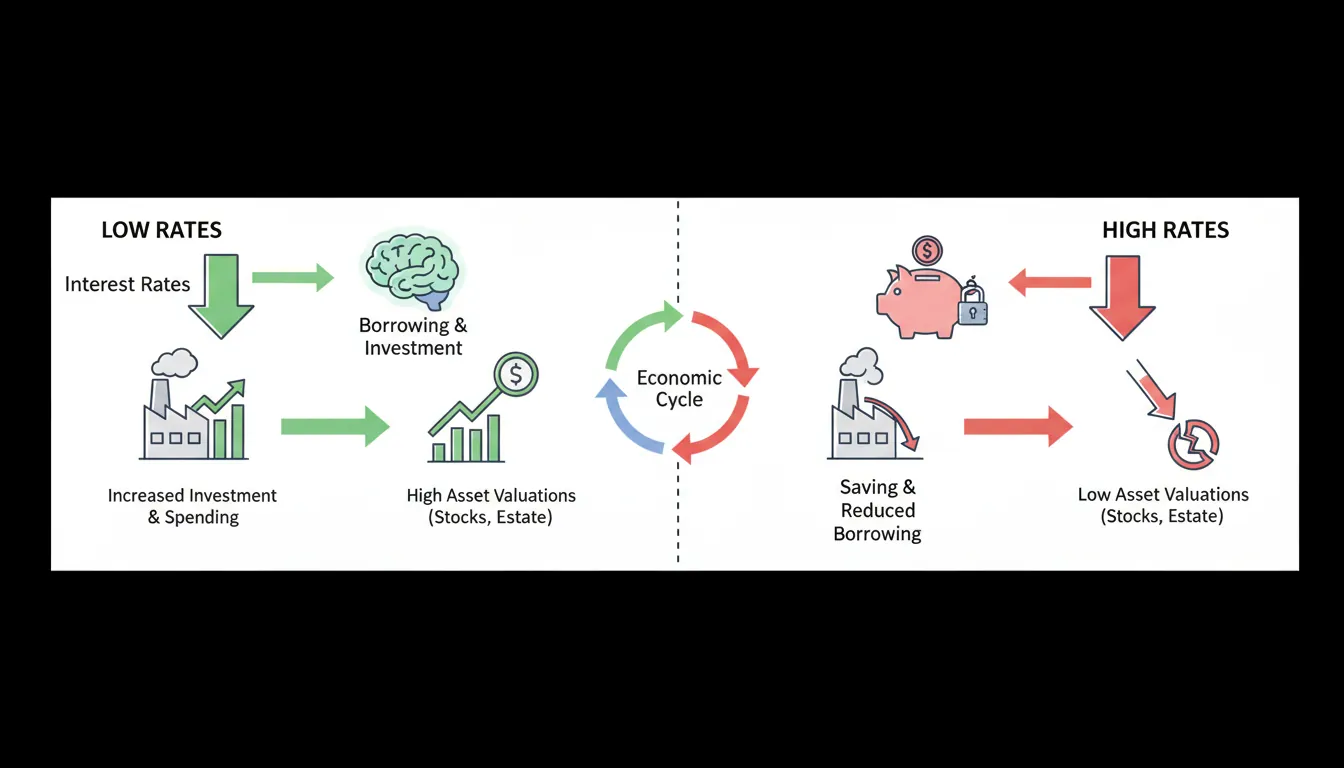
Core Principle: Interest rates = cost of capital. Low rates: cheap to borrow, NPV of long-term projects positive, asset valuations high (low discount rate), companies invest/expand. High rates: expensive to borrow, NPV negative, asset valuations compressed, companies cut spending. Central banks use rates to stimulate (cut rates) or cool (raise rates) economy. Companies must adjust CapEx, M&A, hiring based on rate environment.
Figure: Interest rate transmission mechanism — low rates drive investment and high valuations, while high rates compress valuations and reduce spending.
Impact on Companies: Homebuilders (Toll Brothers, Lennar): revenues drop 40% as buyers priced out. Zillow: transaction volumes down 50% (fewer home sales = less advertising). Home Depot: renovation spending collapses (cash-out refinancing impossible at 7% rates). Rate transmission mechanism: Fed raises rates → borrowing expensive → demand destruction → revenue decline across housing ecosystem.
Key Insight: Interest rate changes = 6-12 month lag before economic impact. When Fed signals rate hikes, adjust strategy immediately (don't wait for impact). Cut discretionary spending, delay CapEx, build cash buffer. When Fed signals cuts, prepare to invest aggressively (competitors slow, you accelerate).
Business Applications
For CapEx Planning: Interest rates change NPV calculations. Project NPV = future cash flows discounted at cost of capital. 2020 (rates 0%): 10-year project with 5% IRR = positive NPV (0% discount rate). 2023 (rates 5%): same project = negative NPV (5% discount rate). Many "profitable" projects at low rates become unprofitable when rates rise. Reassess CapEx pipeline quarterly—kill marginal projects when rates rise, accelerate when rates fall.
For M&A Teams: Acquisition valuations compress when rates rise. Leveraged buyout: 60% debt, 40% equity. 2020 (rates 2%): debt service = $2M/year on $100M debt. Can pay 15× EBITDA (cheap debt subsidizes high multiples). 2023 (rates 7%): debt service = $7M/year. Can only pay 8× EBITDA (expensive debt reduces affordable multiples). Private equity deal volume dropped 60% (2022-2023) as rising rates made LBOs uneconomic. Strategy: acquire aggressively in low-rate environments (debt cheap), sell in high-rate environments (equity multiples compressed, debt expensive).
For Treasury Teams: Duration management matters. Debt with fixed rates: lock in low rates before Fed hikes (5-10 year maturities). Debt with floating rates: use when expecting rate cuts (benefit from declining rates). Apple (2013): issued $17B in bonds at 2.4% (30-year). Today: competitors borrow at 6%+. Apple saves $400M/year in interest (locked in low rates). Duration strategy: extend in low-rate environments, shorten in high-rate environments.
Interest Rate Strategy Framework Low-rate environment (0-2%): Accelerate CapEx (cheap financing), pursue M&A (leverage works), issue long-term debt (lock in low rates), invest in growth (NPV positive for more projects), hire aggressively Rising-rate environment (2-5%+): Delay CapEx (wait for rates to stabilize), pause M&A (valuations compressing), pay down variable-rate debt, build cash (rates rising = cash yield increases), cut discretionary spending High-rate environment (5%+): Minimize debt, prioritize cash generation, high ROI projects only, optimize working capital (cash has opportunity cost), prepare for recession (rates kill demand) Falling-rate environment: Invest aggressively (NPV improving), refinance expensive debt, acquire distressed assets (others struggling with debt service)
Capital AllocationInterest Rate StrategyDebt Management
Exchange Rates & Global Trade: Currency Moves Shift Margins
Core Principle: Exchange rate fluctuations affect revenues, costs, and competitiveness. Strong home currency: exports expensive (revenue pressure), imports cheap (cost reduction). Weak home currency: exports competitive (revenue boost), imports expensive (cost pressure). Companies with global operations must hedge FX risk, price strategically across markets, and locate production to minimize currency exposure.
Setup: Apple: 60% revenues outside US, costs mostly in USD (R&D, suppliers paid in dollars). 2022: Dollar strengthens 15% vs. Euro, 20% vs. Yen, 10% vs. Yuan. Impact: European customer pays €1,000 for iPhone (same local price). At 2021 rates: €1,000 = $1,100 revenue. At 2022 rates: €1,000 = $950 revenue. Apple loses $150/phone on currency translation (14% revenue decline) despite selling same unit at same local price.
Apple's Response: (1) Raise prices in international markets (iPhone prices up 10-15% in Europe, Japan). Some demand loss, but margin protection. (2) FX hedging: forward contracts lock in exchange rates 6-12 months ahead (reduces volatility). (3) Local sourcing: shift component purchases to Euro/Yen suppliers (natural hedge—costs decline when revenue declines). Result: mitigated 50% of FX impact, but still -$5B revenue headwind (Q4 2022).
Key Insight: Large currency swings (>10%) can erase entire profit margins. Companies with global revenues + concentrated costs = extreme FX exposure. Mitigation: (1) Price dynamically by market (pass through FX moves), (2) Hedge tactically (forward contracts, options), (3) Natural hedges (local sourcing, production in customer markets).
Business Applications
For International Pricing: Adjust prices by currency zone. Strong home currency: raise international prices (offset revenue translation loss). Weak home currency: hold prices (gain competitiveness). Netflix: prices in USD in US, but local currency pricing (€, £, ¥) internationally. Adjusts prices quarterly based on FX moves—2022 (strong dollar): raised European prices 15%, maintained margins despite FX headwinds. Fixed USD pricing across all markets = margin volatility from FX swings.
For Manufacturing Strategy: Locate production near customer markets (natural hedge). Export model (produce in home market, sell globally): FX exposure high. Local production model (produce where you sell): FX exposure low. BMW: manufactures in Germany (costs in Euros), sells 40% in US (revenues in Dollars). When Euro strong: BMW cars expensive in US, margins compressed. Tesla: manufactures in US, China, Germany (localized production). FX neutral—produce in Euros, sell in Euros (natural hedge). Manufacturing location = FX risk management tool.
For Treasury Teams: FX hedging strategies. Transaction exposure (short-term receivables/payables): hedge with forward contracts (lock in rate for 3-6 months). Translation exposure (consolidated financial statements): selective hedging (expensive, only for large exposures). Economic exposure (long-term competitiveness): natural hedges (local production, pricing flexibility). Airbus (2000s): costs in Euros, revenues 70% in Dollars. Hedged 100% of Dollar exposure 12-18 months forward—protected margins when Euro strengthened vs. Dollar.
Currency Risk Management Framework Transaction risk (short-term): Forward contracts, currency options, netting (offset receivables/payables), invoicing in home currency Translation risk (accounting): Selective hedging (material exposures only), natural hedges (borrow in foreign currency), accept volatility (disclose to investors) Economic risk (long-term): Local production (manufacture where you sell), global sourcing (diverse supplier base), dynamic pricing (adjust prices by market), flexible operations (shift production locations) Example: US exporter facing strong Dollar → costs stable (USD), revenues down (foreign currency translation) → raise international prices 10%, hedge 50% of FX exposure, shift production to Mexico (natural hedge)
FX Risk ManagementGlobal PricingInternational Strategy
Fiscal Policy
Combined with Monetary Policy below for comprehensive coverage
Fiscal & Monetary Policy: Government Actions Shape Markets
Setup: March 2020: COVID lockdowns, unemployment spikes to 14%, GDP drops 30% (Q2 2020). Government response: $5 trillion fiscal stimulus (direct payments, PPP loans, enhanced unemployment), Fed cuts rates to 0% + $4 trillion quantitative easing. Largest peacetime stimulus in history.
Business Impact: (1) Consumer demand surge: stimulus checks → retail sales up 20% (2020-2021) despite recession. Target, Walmart, Amazon: record revenues. (2) Asset price inflation: low rates + money printing → stock market up 100% (2020-2021), housing up 30%, crypto boom. Wealth effect drives luxury spending (LVMH, Tesla benefit). (3) Labor market tightness: enhanced unemployment ($600/week federal supplement) reduces labor supply, wages up 15% (2021-2022), margin pressure for labor-intensive businesses (restaurants, retail).
Key Insight: Massive stimulus creates winners (consumer discretionary, assets, tech) and losers (labor-intensive businesses facing wage pressure). Companies that recognized stimulus = demand surge (Amazon, Walmart) invested heavily in capacity (warehouses, hiring). Companies that missed it (traditional retail) lost market share. Policy shifts = opportunity for prepared companies.
Business Applications
For Strategy Teams: Monitor policy signals from central banks and governments. Fed "dot plot" (interest rate projections): signals rate path 2 years ahead. ECB forward guidance: commits to rate policy conditional on inflation. Fiscal policy: infrastructure bills, tax reforms, subsidies. Incorporate policy expectations into strategy. 2021: infrastructure bill passes ($1T). Companies exposed (Caterpillar, construction materials, engineering firms) invest in capacity ahead of demand surge. 2022-2023: policy tightens (rates up, stimulus ends). Companies cut costs, delay CapEx, prepare for demand slowdown.
For Sector-Specific Opportunities: Policy changes create sector rotation. Green energy subsidies (IRA 2022): $369B for solar, wind, EVs. Tesla, solar companies, battery manufacturers benefit directly. Defense spending increases: contractors (Lockheed, Raytheon) gain. Tax cuts for corporations: buybacks, M&A increase (private equity benefits). Anticipate policy-driven demand shifts—reposition before competitors react. First Solar: stock up 300% (2022-2023) on IRA subsidies (converted marginal business into highly profitable).
For Risk Management: Policy risk = major uncertainty for international operations. China's regulatory crackdowns (2021): education sector banned from profits ($100B destroyed), tech antitrust fines ($50B), gaming restrictions. Companies operating in China faced sudden policy risk. Mitigation: diversify geography (don't concentrate in single regulatory jurisdiction), scenario plan for policy changes (what if government nationalizes sector?), maintain flexibility (avoid irreversible commitments in high-policy-risk markets).
Policy Impact Framework Expansionary policy (stimulus): Fiscal (spending up, taxes down) + Monetary (rates down, QE) → Demand surge, asset inflation, labor shortages, currency weakness. Strategy: invest in capacity, hire ahead of demand, lock in debt (rates low) Contractionary policy (austerity): Fiscal (spending down, taxes up) + Monetary (rates up, QT) → Demand decline, asset deflation, unemployment rises, currency strength. Strategy: build cash, cut costs, delay CapEx, prepare for recession Sector-specific policies: Subsidies (IRA green energy, CHIPS Act semiconductors), tariffs (trade wars), regulations (antitrust, data privacy). Strategy: lobby for favorable policy, diversify away from hostile jurisdictions, frontrun policy changes Policy tracking: Fed meetings, central bank guidance, legislative calendars, regulatory proposals
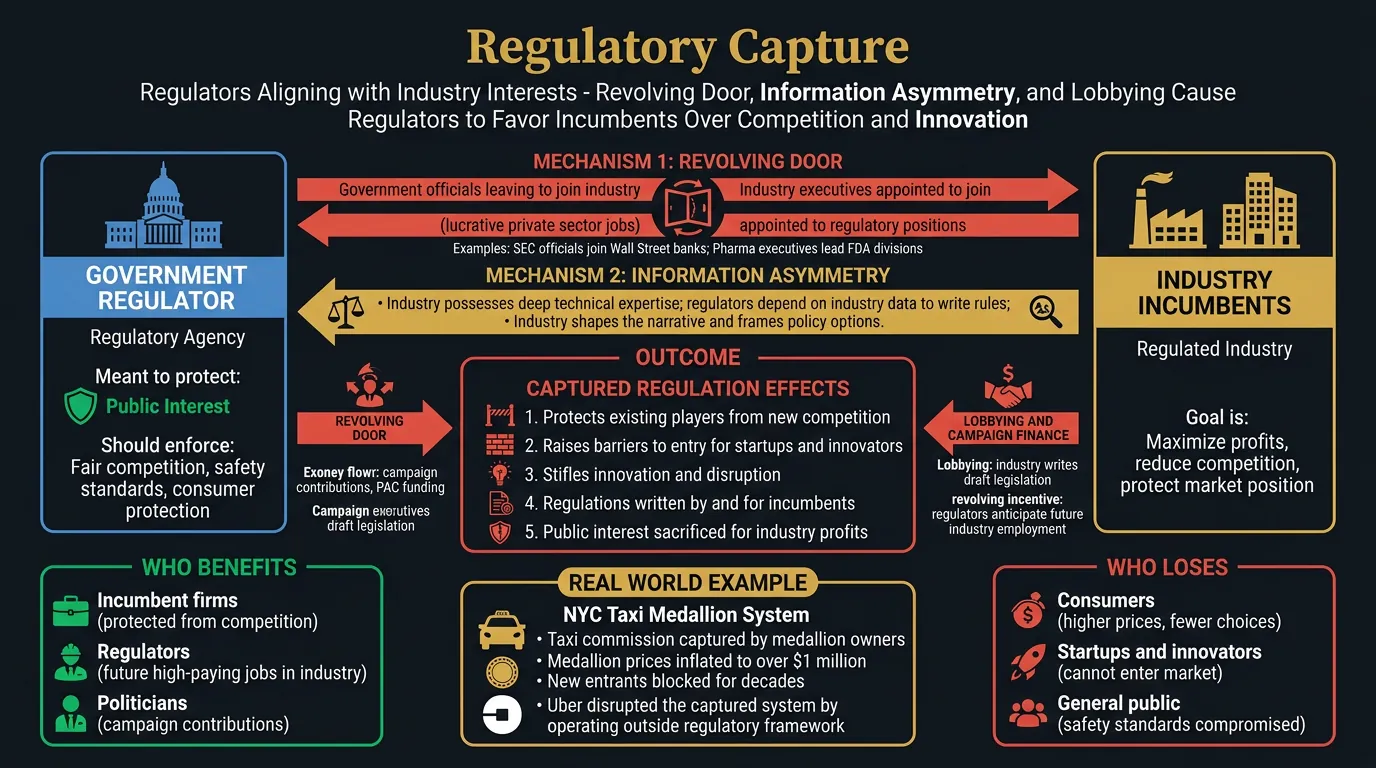
Regulatory Capture: Regulators Align with Industry
Core Principle: Regulators often become captured by the industries they regulate. Mechanisms: (1) Revolving door (regulators join industry post-government), (2) Information asymmetry (industry has expertise, regulators rely on industry data), (3) Lobbying/campaign finance. Captured regulation favors incumbents (protects existing players from competition), raises barriers to entry, stifles innovation. Companies can benefit from (or be harmed by) regulatory capture depending on market position.
Figure: Regulatory capture mechanisms — revolving door, information asymmetry, and lobbying cause regulators to favor incumbents over competition and innovation.
Uber Disruption (2011): Uber enters NYC as "black car service" (different regulatory category, not medallion-constrained). TLC initially allows (Uber = niche market, not direct competitor to yellow cabs). By 2015: Uber has 20,000 cars (vs. 13,000 medallions), medallion prices collapse to $200K (2018). Medallion owners sue, lobby for regulation. TLC responds: caps Uber vehicles (2018), imposes minimum wage (2019)—attempts to protect incumbents (too late).
Key Insight: Regulatory capture protects incumbents until technology enables circumvention. Medallion system worked for 80 years (regulators captured by taxi lobby). Uber bypassed regulation through legal arbitrage (different category). Incumbents use captured regulators to fight back (caps, wage laws), but can't reverse disruption. Startups: find regulatory gaps, exploit before incumbents mobilize regulators.
Business Applications
For Incumbents: Use regulatory capture defensively. Lobby for barriers to entry: licensing requirements (hair braiding needs 1,000 hours training in some states—protects salons from competition), safety regulations (require expensive testing that only large companies can afford), data privacy rules (GDPR compliance costs $1M+—hurts startups, minimal impact on Google/Facebook). Pharmaceutical companies: extend patents through regulatory filings (biologics get 12-year exclusivity), lobby FDA for stricter approval (raises costs for generic manufacturers). Regulatory capture = moat for incumbents.
For Startups: Identify captured regulations to disrupt. Heavily regulated industries (taxis, hotels, healthcare, finance, education) = likely captured (incumbents control regulators). Look for "arbitrage" opportunities: Airbnb avoided hotel regulations (peer-to-peer not covered), Uber avoided taxi regulations (black car service), Robinhood avoided broker minimums (tech platform not traditional brokerage). Move fast before incumbents lobby for new regulations covering your category.
For Policy Teams: Invest in regulatory relationships. Lobbying spend ROI: avg $220 return per $1 lobbied (study: pharmaceutical companies). Google, Amazon, Meta: $50M+/year lobbying budgets. Regulatory access = influence on rules. Hire ex-regulators (revolving door works both ways—FCC commissioners join telecom companies, FDA officials join pharma). Build coalitions (trade associations amplify influence). Amazon's HQ2 strategy: located in Washington DC suburbs—proximity to regulators = regulatory influence.
Second Case Study: Telecom Industry and Net Neutrality Regulations
TelecommunicationsRegulatory Capture
Setup: Net neutrality debate (2005-2020): Should ISPs treat all internet traffic equally (net neutrality) or charge content providers for faster delivery (paid prioritization)? Consumer advocates want neutrality (prevent Comcast blocking Netflix). ISPs (Comcast, AT&T, Verizon) want paid prioritization (new revenue stream—charge Netflix $1B/year for fast lanes).
Regulatory Capture Mechanisms: (1) Revolving door: 5 FCC chairmen (2000-2020)—4 joined telecom/cable lobby after government service. Tom Wheeler (FCC chair 2013-2017): former telecom lobbyist before appointment. (2) Lobbying spend: ISPs spend $80M/year lobbying FCC, Congress. (3) Campaign finance: Telecom industry $50M+ political donations annually. (4) Information asymmetry: FCC relies on ISP-provided data about network costs, congestion (ISPs claim neutrality harms investment—data shows opposite).
Outcome: 2015: FCC (Democratic majority) passes net neutrality rules. 2017: FCC (Republican majority, new chairman = former Verizon lawyer) repeals neutrality. 2024: Still no permanent rules—ping-pongs with administration changes. ISPs successfully captured regulatory process—prevent permanent consumer-friendly rules despite 80%+ public support for net neutrality. Regulatory uncertainty benefits ISPs (can threaten paid prioritization, extract payments from content providers even without formal rules).
Navigating Regulatory Capture Signs of capture: Industry-favorable rules, high barriers to entry, complexity (benefits large players with compliance teams), revolving door between regulators and industry Incumbent strategy: Lobby for strict licensing, safety standards, data requirements (raise costs for entrants), support "consumer protection" that actually protects incumbents Disruptor strategy: Find regulatory arbitrage (operate in unregulated category), move fast (before rules change), build customer base (harder to ban once popular), lobby for "innovation-friendly" rules Examples: Taxi medallions (capture until Uber), occupational licensing (barbers, interior designers), certificate of need (hospitals block competitors), telecom spectrum (favors AT&T/Verizon)
Regulatory StrategyLobbyingCompetitive Barriers
Public Goods Problem: Markets Under-Provide
Core Principle: Public goods = non-excludable (can't prevent non-payers from using) + non-rival (one person's use doesn't reduce others'). Examples: national defense, clean air, basic research, open-source software. Private markets under-provide public goods (free-rider problem—everyone wants to use, no one wants to pay). Government intervention (taxes, subsidies, direct provision) or collective action (industry consortia, open-source communities) needed.
Real-World Application: Pharmaceutical R&D for Rare Diseases
Case Study: Orphan Drug Act
PharmaPublic Goods
Setup: Rare diseases (<200,000 patients in US): limited market, high R&D costs. Private sector won't invest—$500M to develop drug for 10,000 patients = uneconomic (can't recoup costs). Public good problem: society benefits from curing rare diseases, but no private company will fund research (free-rider: "Let someone else develop it, we'll copy once approved").
Government Intervention: Orphan Drug Act (1983): provides (1) 7-year market exclusivity (extended patent protection), (2) Tax credits for R&D (50% of costs), (3) Fast-track FDA approval. Makes rare disease drugs profitable—converts public good (under-provided by market) into private good (excludable via exclusivity, profitable via subsidies). Result: orphan drug approvals up 10× (pre-1983: 10 total drugs, post-1983: 600+ drugs). Government corrected market failure.
Key Insight: Public goods need government intervention OR alternative funding models. Basic research (NIH grants $45B/year—funds university science that companies won't). Open-source software (Linux, Apache—volunteer labor + corporate sponsorship). Industry consortia (SEMATECH—semiconductor R&D shared across competitors). When private incentives misaligned (public good problem), look for policy-driven solutions or collective funding.
Business Applications
For R&D Teams: Distinguish private goods (excludable, rival) from public goods (non-excludable, non-rival). Private goods: patent protection, trade secrets (can capture returns, fund privately). Public goods: basic science, platform standards, infrastructure (can't exclude competitors, need alternative funding). Strategy: lobby for government R&D subsidies (DARPA funded internet, GPS, touchscreens—public goods that enabled private industry), join industry consortia (share costs of pre-competitive research), contribute to open source strategically (build ecosystem that benefits your products).
For Policy Teams: Advocate for public funding of foundational research. Tech industry: benefits from government-funded computer science (NSF, DARPA). Pharma: benefits from NIH basic research ($45B/year funds university labs that discover drug targets). Clean energy: benefits from DOE subsidies. ROI on lobbying for R&D funding: 100× (taxpayers fund research, companies commercialize discoveries). Tesla: $465M DOE loan (2009) funded Model S development—public investment de-risked private innovation.
For Sustainability Teams: Public goods problem = tragedy of the commons. Clean air, oceans, climate stability = public goods (non-excludable, non-rival). Individual companies won't reduce pollution voluntarily (costs money, benefits everyone including competitors). Requires regulation (carbon taxes, emission caps) or collective action (industry agreements). Companies can benefit from advocating for smart regulation—levels playing field, prevents race-to-bottom on environmental standards. Auto industry: supported California emissions standards (avoided 50-state patchwork of regulations).
Public Goods Strategy Framework Public goods characteristics: Non-excludable (can't charge users) + Non-rival (infinite supply) = private markets under-provide Solutions: (1) Government provision (taxes fund public goods: R&D grants, infrastructure), (2) Subsidies (tax credits, prizes for private provision), (3) Regulation (mandates, standards), (4) Collective action (industry consortia, open-source communities) Business strategy: Lobby for government funding (basic research, infrastructure), join industry consortia (share pre-competitive costs), contribute to open-source (build ecosystem), support smart regulation (level playing field on public goods like environment) Examples: NIH funds drug discovery (public), companies commercialize (private). Internet protocols (public via open standards), AWS/Azure (private services built on public protocols)
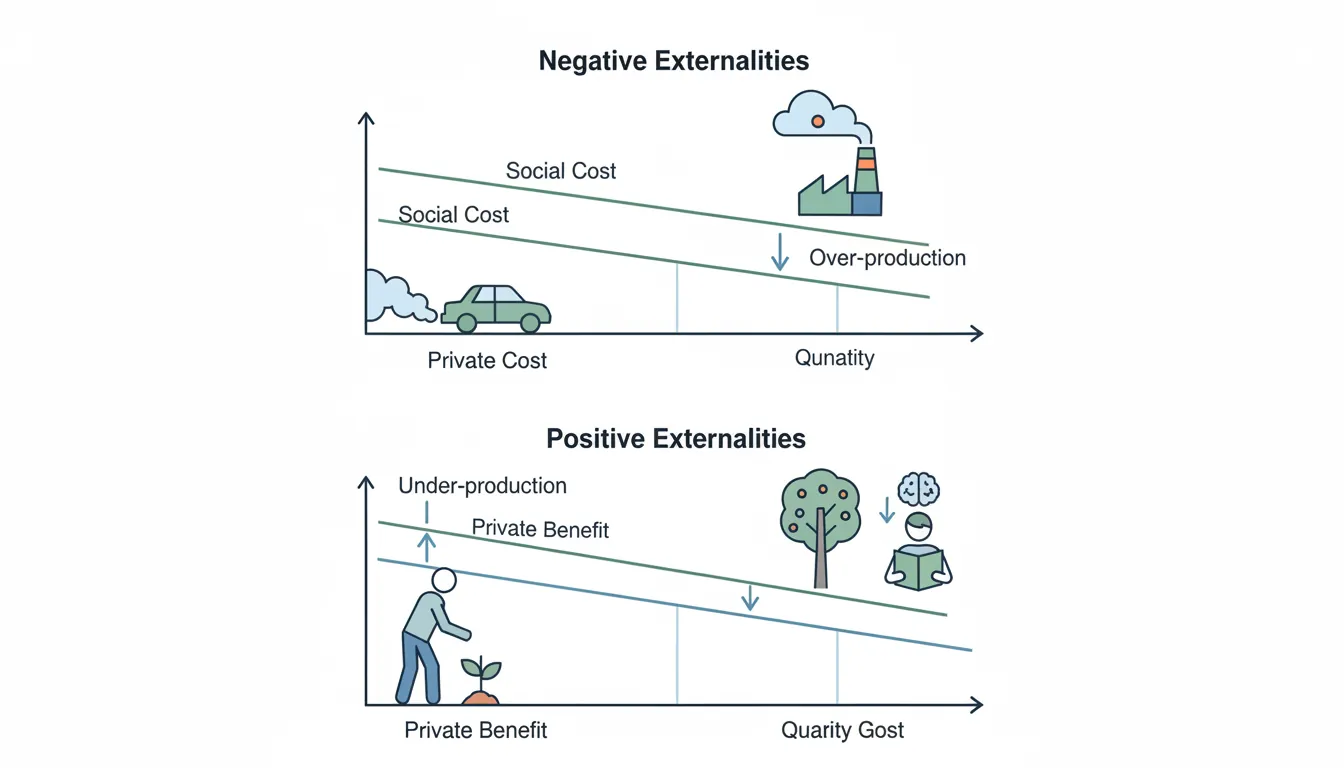
Core Principle: Externality = cost/benefit imposed on third parties not involved in transaction. Negative externalities (pollution, congestion, noise): private costs < social costs → market over-produces. Positive externalities (education, vaccination, R&D): private benefits < social benefits → market under-produces. Regulation (taxes, subsidies, caps) internalizes externalities, aligning private incentives with social optimum.
Figure: Negative and positive externalities — gaps between private costs and social costs lead to market over-production or under-production.
Real-World Application: Carbon Emissions and Climate Change
Case Study: EU Emissions Trading System
ClimateExternalities
Setup: Carbon emissions = negative externality. Coal plant burns coal, produces electricity (private benefit), emits CO2 (social cost: climate change, health impacts). Private cost: $50/MWh (coal, plant operation). Social cost: $50 + $30/ton CO2 × 0.8 tons/MWh = $74/MWh. Market failure: plant produces too much (private cost < social cost), society bears excess cost ($24/MWh).
EU ETS Solution (2005): Cap-and-trade system. (1) Government sets emissions cap (1.8 billion tons/year, declining 2% annually). (2) Companies buy permits to emit (1 permit = 1 ton CO2). (3) Permits traded on market (current price: €80/ton). Internalizes externality: coal plant now pays $50 fuel + €64 carbon ($80 × 0.8 tons) = $114/MWh total cost. Natural gas (0.4 tons/MWh): $70 fuel + €32 carbon = $102/MWh. Renewables (0 tons): $90/MWh + €0 = $90/MWh. Carbon price makes renewables cheapest—market shifts from coal → gas → renewables. Externality internalized via pricing.
Result: EU emissions down 30% (2005-2023). Coal generation down 60%, renewables up 300%. Carbon pricing = $100B+/year revenue (used to subsidize green tech). Market-based solution to externality problem—avoided command-and-control regulation, used price signals to drive decarbonization.
Business Applications
For Sustainability Teams: Anticipate externality regulation. Negative externalities (carbon, pollution, waste): government will eventually tax or cap (internalize costs). Companies that move early (invest in clean tech before mandates) gain competitive advantage when regulation arrives. Tesla: invested in EVs pre-carbon-pricing—when subsidies/regulations arrived (California ZEV mandate, federal tax credits), Tesla positioned to benefit. Incumbents (GM, Ford) caught flat-footed, scrambling to build EV capacity.
For Risk Management: Price externalities into decisions even before regulation. Stranded asset risk: coal plants built assuming no carbon tax. When carbon pricing arrives, plants become uneconomic (operating costs > revenue). Utilities that assumed zero carbon cost: $100B+ in stranded assets (retired plants early). Utilities that modeled $50/ton CO2 in planning: avoided building coal, invested in gas/renewables, no stranded assets. Shadow carbon pricing (internal carbon tax) = insurance against future regulation.
For Corporate Strategy: Positive externalities = investment opportunities. R&D creates positive externalities (innovations spill over to competitors, society). Government subsidizes R&D (tax credits, grants) to increase private investment. Companies can capture subsidies: R&D tax credits (US: 20% of R&D spending), innovation grants (ARPA-E for energy, SBIR for small business). Amazon: claimed $1B+ in R&D tax credits (2020)—reduced taxes while increasing innovation spending. Leverage subsidies to fund innovation that has positive externalities.
Second Case Study: Tobacco Industry Negative Externalities
Public HealthExternalities
Setup: Cigarette smoking creates massive negative externality: smokers pay $8/pack private cost, but impose $35/pack social cost (healthcare: lung cancer, heart disease, COPD treatment costs; lost productivity: sick days, premature death; secondhand smoke: non-smoker health impacts). Market failure: private companies profit ($8 revenue/pack) while society bears costs ($35 medical/productivity losses).
Internalizing the Externality: 1998 Tobacco Master Settlement Agreement: 46 US states sue tobacco companies for healthcare costs ($200B+ spent treating smoking-related illnesses). Settlement: tobacco companies pay $206B over 25 years. Effectively a retroactive externality tax—forces companies to pay for social costs they previously externalized. Additionally, cigarette taxes raised: federal $1/pack, state average $2/pack (some states $4-5/pack). Total taxes now ~$3-5/pack (partially internalizes health externality).
Market Impact: Cigarette prices: $2/pack (pre-1998) → $8+/pack (post-settlement + taxes). Consumption drops: 24% of adults smoked (1998) → 11% (2024). Tax revenue: $25B/year (federal + state). Public health benefit: 8 million premature deaths avoided (1998-2024) from reduced smoking rates. Economic lesson: when externalities internalized through taxes/lawsuits, market outcomes align with social optimum (less smoking = fewer health costs). Tobacco industry fought internalization for decades (denied health risks, lobbied against taxes)—but eventually lost as evidence overwhelmed denial.
Externality Management Framework Negative externalities: Pollution, congestion, noise, health risks. Solutions: Pigovian taxes (carbon tax, congestion pricing), cap-and-trade (emissions permits), regulation (emission standards, bans). Strategy: invest early in clean tech (pre-empt regulation), use shadow pricing (internal carbon tax), lobby for market-based solutions (cap-and-trade > command-and-control) Positive externalities: R&D, education, network effects. Solutions: Subsidies (R&D tax credits, education grants), public provision (NSF, NIH). Strategy: capture subsidies (R&D credits, innovation grants), invest in workforce development (positive externality = skilled labor pool) ESG integration: Internalize externalities into decision-making before regulation forces it (avoid stranded assets, build green competitive advantage)
Carbon StrategyESG ManagementExternality Pricing
Antitrust Economics: Market Power Attracts Scrutiny
Real-World Application: Google Search Antitrust Case
Case Study: DOJ vs. Google (2020-Present)
Big TechAntitrust
Setup: Google: 90% global search market share, 95% mobile search. DOJ lawsuit (2020): alleges monopolization through exclusionary agreements. (1) Pays Apple $15B/year to be default search on iPhone (blocks competitors from distribution). (2) Pays Samsung, Mozilla $5B+/year for default status. (3) Bundles search with Android (OEMs must pre-install Google Search to get Play Store). Allegations: maintains monopoly through distribution control, not superior product.
Google's Defense: (1) Consumers choose Google because it's best (quality, not coercion). (2) Default can be changed (users can switch to Bing, DuckDuckGo—don't, proving Google superior). (3) Payments to Apple/Samsung = competitive bidding (Microsoft could outbid if Bing better). (4) Android bundling = efficient distribution (consumers benefit from integrated experience). Traditional antitrust: focus on consumer harm (higher prices). Google: prices = $0 (free search), consumers benefit from better quality.
Potential Remedies: (1) Ban exclusive agreements (Apple must offer choice screen for search). (2) Unbundle Android (separate Search from Play Store). (3) Structural breakup (spin off Chrome, Android). (4) Behavioral remedies (data sharing with competitors). Trial ongoing (2024)—outcome will reshape big tech antitrust doctrine.
Business Applications
For Dominant Platforms: Market power = antitrust target. 90%+ market share (Google Search, Microsoft Windows, Amazon e-commerce): expect regulatory scrutiny. Mitigation strategies: (1) Avoid exclusionary conduct (don't block competitors from distribution), (2) Don't abuse dominance (tie products, exclusive dealing, predatory pricing), (3) Invest in compliance (competition law training, legal review of product decisions), (4) Document pro-competitive justifications (efficiency gains, consumer benefits). Microsoft learned from 1990s antitrust (browser bundling)—now structures Windows to allow browser choice, avoids exclusionary tactics.
For M&A Strategy: Horizontal mergers (competitors combining) = high antitrust risk. HHI thresholds (market concentration index): <1,500 = safe, 1,500-2,500 = scrutiny, >2,500 = likely blocked. Meta-Within (VR fitness app, 2022): FTC sued to block (small deal, $400M, but high market shares in nascent market—prevented). Remedy: pursue vertical mergers (supplier + customer), conglomerate mergers (unrelated businesses)—lower antitrust risk than horizontal consolidation. Amazon-MGM ($8.5B, 2022): approved (vertical: distribution + content, not horizontal).
For Competitive Strategy: Use antitrust offensively. If dominant competitor abuses market power, file complaint (EU, DOJ). Spotify vs. Apple: complaint about App Store 30% fee + restrictions on Spotify in-app (forced through Apple payment system). EU: fined Apple €1.8B, ordered changes to App Store rules (2024). Antitrust = competitive tool for challengers against dominant platforms. Smaller players: document anti-competitive conduct, build coalition (multiple complainants stronger than one), lobby regulators.
Second Case Study: Microsoft Antitrust (1998-2001)
SoftwareAntitrust
Setup: 1998 DOJ sues Microsoft: 95% desktop OS market share (Windows). Allegation: bundled Internet Explorer (IE) with Windows to kill Netscape Navigator (65% browser share 1995). Tying = illegal under antitrust law when dominant firm forces customers to buy Product B (browser) to get Product A (OS).
Anti-Competitive Conduct: (1) Technical integration: IE embedded into Windows (couldn't uninstall without breaking OS). (2) OEM agreements: PC manufacturers (Dell, HP, Compaq) contractually required to ship Windows PCs with IE as default browser, hide Netscape icon. (3) Exclusive deals: AOL, CompuServe paid to use IE exclusively (blocked Netscape distribution). Result: IE market share 25% (1997) → 95% (2002). Netscape bankrupted, sold to AOL for $4.2B (down from $10B valuation).
Legal Outcome: 2000: Judge Jackson rules Microsoft violated Sherman Act (monopolization). Proposes breakup: split Windows OS from applications/IE. 2001: Appeals court overturns breakup, but upholds monopolization verdict. Settlement: Microsoft must (1) share APIs with competitors, (2) allow OEMs to install rival browsers, (3) submit to 5-year DOJ oversight. Fines: $750M+ (US), €2.2B (EU for separate violations).
Long-Term Impact: Microsoft learned "antitrust compliance culture." Missed mobile OS (Android/iOS won) partly because conservative on bundling/integration post-lawsuit. Meanwhile, Google built Chrome browser 65%+ market share (2024) using similar tactics (default browser deals with Apple, Samsung) without antitrust penalties—regulatory environment evolved. Case precedent: big tech now faces constant antitrust scrutiny. Microsoft's experience = cautionary tale for Facebook, Google, Amazon dominance strategies.
Antitrust Risk Management High-risk behaviors: (1) Tying (force customers to buy A to get B), (2) Exclusive dealing (block competitors from distribution), (3) Predatory pricing (below-cost pricing to drive out rivals), (4) Refusal to deal (deny competitors access to essential facilities), (5) Horizontal mergers (competitor consolidation in concentrated markets) Safe harbors: (1) Market share <40% (presumed not dominant), (2) Efficiency justifications (lower costs, better quality), (3) Consumer benefits (free products, innovation), (4) Competitive markets (easy entry, many rivals) Compliance: Antitrust training (sales, product, M&A teams), legal review (pricing, distribution agreements, product bundling), document pro-competitive rationale (efficiency, innovation, consumer benefit) Examples: Microsoft (browser bundling fined €2.2B), Google (shopping comparison fined €2.4B), Meta (attempted Within acquisition blocked)
Antitrust ComplianceMarket PowerRegulatory Risk
Labour Supply & Demand: Workforce is Strategic Asset
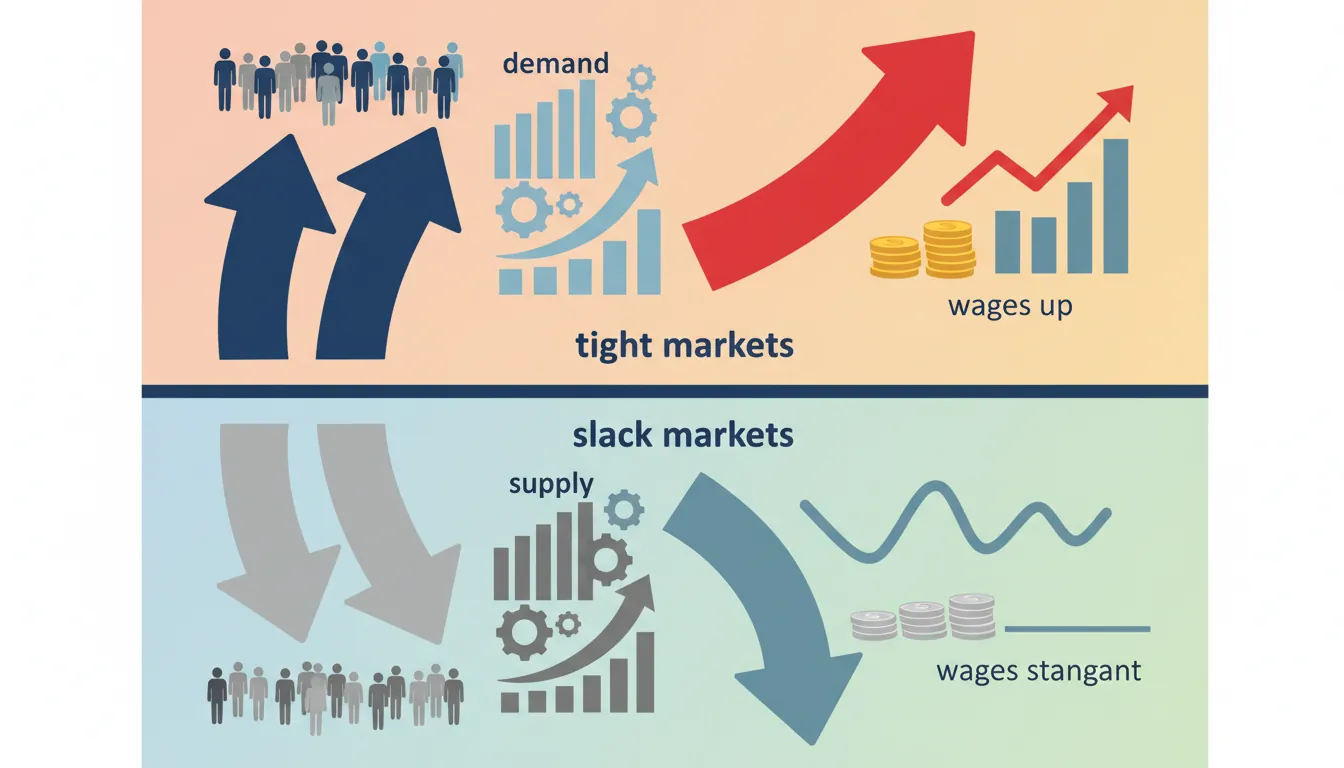
Core Principle: Labour markets operate on supply and demand like any other market. Labour supply = workers offering skills at given wages. Labour demand = employers hiring at given wages. When demand exceeds supply (tight labour market): wages rise, workers have negotiating power. When supply exceeds demand (slack labour market): wages stagnate, employers have power. Understanding labour market dynamics critical for talent strategy, compensation planning, and expansion decisions.
Setup: US nursing shortage driven by demographic shift (aging population = more healthcare demand) + limited supply (nursing schools have capacity constraints, 4-year degree requirement). 2010-2020: demand for registered nurses grew 15% (10M+ jobs), supply grew 8% (COVID accelerated retirements). Labour market imbalance: shortages in 40+ states, 60-90 day time-to-fill for RN positions.
Wage Response: Tight labour market → wage surge. RN median salary: $65K (2010) → $80K (2020) → $95K+ (2023 post-COVID). High-shortage areas (rural hospitals, ICU) offered 20-30% wage premiums. Travel nurses: $3,000-4,000/week (3× staff nurse pay). Labour supply inelastic short-term (can't train nurses overnight) → employers bid up wages to fill positions.
Strategic Responses: (1) Immigration recruiting: hospitals recruited internationally (Philippines, India) to reduce search frictions—immigrant nurses filled 15-20% of openings in high-shortage metro areas. (2) Wage differentiation: pay premiums for hard-to-fill specialties (ICU, ER, oncology). (3) Training pipelines: partner with nursing schools, offer tuition reimbursement (build supply long-term). (4) Retention investments: improve working conditions (reduce burnout), offer flexibility (part-time, remote case management). Labour shortages force employers to invest in both supply (training) and retention.
Business Applications
For Workforce Planning: Track labour market indicators—unemployment rate by skill level, time-to-fill metrics, wage growth trends. Tight markets (low unemployment, long time-to-fill): invest in retention (losing employees expensive to replace), build training pipelines (can't rely on external hiring), offer above-market wages (attract scarce talent). Slack markets (high unemployment, short time-to-fill): hire aggressively (abundant talent, negotiating power), upgrade talent (trade up for better candidates), lock in wages (delay raises until market tightens).
For Compensation Strategy: Labour market pricing = competitive positioning. Tight labour markets: pay at or above market (75th percentile+) or lose talent to bidding wars. Slack labour markets: pay median (50th percentile) sufficient to attract talent. Tech sector (2020-2022): engineer shortage drove FAANG salaries to $300K+ (75th percentile), startups forced to match or lose candidates. 2023 layoffs: labour supply increases, wage pressure eases, companies freeze raises. Compensation strategy must adapt to supply/demand cycles.
For Geographic Expansion: Labour availability = location driver. Labour-intensive operations (call centers, warehouses, manufacturing): locate in areas with abundant labour supply (avoid competing with tech hubs for same talent pool). Amazon warehouse strategy: avoid expensive metro areas (NYC, SF), build in lower-cost metros (Columbus, Nashville) with available workforce. Tech R&D: cluster in talent-dense metros (San Francisco, Seattle, Boston, Austin) despite high costs—access to skilled labour justifies premium.
Labour Market Strategy Matrix Tight labour markets (demand > supply): Wage inflation, long time-to-fill, high turnover, employee leverage. Strategy: pay premium wages, invest in retention, build training pipelines, recruit internationally, offer flexibility Balanced markets (demand ˜ supply): Stable wages, moderate time-to-fill, normal turnover. Strategy: pay market rates, selective recruiting, maintain pipelines Slack labour markets (supply > demand): Wage stagnation, short time-to-fill, low turnover, employer leverage. Strategy: hire aggressively, upgrade talent, pay median wages, delay raises Key metrics: Unemployment rate by skill level, time-to-fill by role, wage growth trends, turnover rates, offer acceptance rates
Core Principle: Human capital—the skills, education, and experience embodied in workers—drives productivity and economic growth. Investment in education and training increases productivity, which raises wages. Workers with more human capital earn more because they produce more. Companies compete for high-human-capital workers and must decide: build talent internally (training) or buy externally (recruiting).
Real-World Application: SpaceX Talent Strategy
Case Study: Deep-Tech Human Capital Competition
AerospaceHuman Capital
Setup: SpaceX's rocket engineering team (2015-2025) requires rare skills: aerospace PhDs, materials science expertise, propulsion systems knowledge. Domestic talent pool limited (few universities offer specialized programs, 8-10 year training pipeline from undergrad through PhD to industry experience). SpaceX solution: recruit globally—~40% foreign-born engineers with advanced degrees.
Build vs. Buy Decision: Training domestic engineers to equivalent level would take 8-10 years + $500K+ per engineer (undergraduate + PhD + R&D experience). Immigration policy = shortcut to human capital accumulation—importing trained workers faster and cheaper than educating domestically. SpaceX invests heavily in H-1B and O-1 visas (~20% of engineering workforce on visas), building pipeline from top global universities (IITs in India, Tsinghua in China, European technical institutes).
Competitive Advantage: Access to global talent pool = innovation velocity advantage. SpaceX develops reusable rockets (Falcon 9), reduces launch costs 10× (from $200M to $20M per launch), dominates commercial space market (60%+ of global launches). Competitors (Boeing, Lockheed) constrained by domestic-only talent pools, slower to innovate. Human capital strategy = source of competitive moat in deep-tech industries.
Business Applications
For Talent Strategy: Build-vs-buy human capital decision depends on skill requirements and time constraints. High human capital requirements + fast growth = favor external recruiting (faster than training, access global pools). Moderate requirements + stable growth = favor internal training (cheaper long-term, builds loyalty, firm-specific skills). Google: hires experienced engineers externally (PhDs, senior roles), trains internally for product/program management (company-specific skills). Balance external hiring (inject new ideas, specialized expertise) with internal development (retain institutional knowledge).
For Compensation Planning: Human capital theory predicts wage premium for skills. Workers with rare, valuable skills command higher wages (supply-demand + productivity premium). Tech sector: software engineers with ML/AI skills earn 30-50% more than general software engineers (human capital scarcity + high productivity). Companies must pay for human capital or lose talent. But beware credential inflation: MBA/PhD doesn't guarantee productivity—assess actual skills, not just credentials.
For Workforce Development: Invest in human capital when skills are firm-specific or transferable skills are scarce. Firm-specific skills (internal processes, proprietary systems, institutional knowledge): train internally (employees can't take to competitors, investment protected). Transferable skills (coding, data analysis, project management): risk employees leave post-training, but necessary to build workforce capabilities. McKinsey, BCG: invest heavily in training (firm-specific consulting methods) despite 20-30% annual turnover—human capital development = core business model.
Human Capital Investment Framework High human capital roles: PhDs, specialized technical skills, rare expertise. Strategy: recruit globally (faster than training), pay premium wages (scarcity + productivity), retain aggressively (replacement cost high) Moderate human capital roles: Bachelor's degree, general skills, some experience. Strategy: mix of external hiring + internal training, pay market wages, develop firm-specific skills Low human capital roles: Minimal education/training requirements, abundant supply. Strategy: hire externally (training costs > benefits), pay below-market (leverage supply), automate when possible ROI calculation: Training cost < (productivity gains × retention rate × tenure) → invest in development. Else: hire externally
Talent DevelopmentHuman CapitalSkills Strategy
Immigration Economics: Labour Mobility Drives Growth
Core Principle: Immigration affects labour markets, productivity, innovation, and growth. Key dynamics: (1) Complementarity vs. substitution (immigrants complement or compete with native workers), (2) Human capital transfer (skill migration = brain gain/drain), (3) Fiscal impacts (taxes paid vs. services consumed), (4) Innovation effects (immigrant entrepreneurship, patents, research). Immigration policy = strategic workforce policy—affects talent availability, wage dynamics, and growth capacity.
Real-World Application: Philippine Nurses Migration to US
Case Study: Comparative Advantage in Labour Mobility
HealthcareImmigration
Setup: Philippine nurses migrating to U.S. hospitals (2000-2020) exemplifies comparative advantage in labour. Philippines has comparative advantage in nurse training (English-speaking, lower costs, strong nursing education tradition). U.S. has comparative advantage in healthcare delivery (capital-intensive hospitals, advanced technology, higher productivity per nurse). Migration = labour trade—both countries gain.
Economic Impact: (1) U.S. benefits: filled nursing shortages (Philippine nurses 15-20% of new hires in shortage areas), reduced wage pressure (immigration expanded supply, mitigated wage inflation), higher productivity (nurses work with advanced equipment, see more patients per shift). (2) Philippines benefits: remittances ($4B+/year from nurses abroad), brain circulation (returnees bring skills, capital, networks), training industry (nursing schools expanded to meet export demand). Net effect: global productivity increases—nurses produce more value in U.S. setting (capital complementarity), Philippines earns foreign exchange.
Key Insight: Labour mobility increases global efficiency by moving workers to where their marginal product is highest. Unrestricted migration would narrow wage gaps faster than trade alone. But political constraints (median voter opposition, concentrated losses for competing workers) limit immigration despite net-positive economic effects. Firms must navigate policy uncertainty while building global talent strategies.
Immigration Economics: Core Concepts
Complementarity vs. Substitution: Immigration's labour market impact depends on whether immigrants complement or substitute native workers. Complementarity: immigrants have different skills (language, technical specialties, cultural knowledge) or enable scale (more engineers → more projects → more demand for managers, designers, sales). Example: Indian H-1B software engineers (2000-2020) initially seen as substitutes (wage suppression fears), but research showed complementarity—immigrant engineers enabled faster product development, increasing demand for U.S.-based product managers, designers, sales teams. Native wages in complementary roles rose 5-10%. Substitution: immigrants have identical skills and demand is fixed. Example: low-skilled immigration in construction (Mexican workers 2000-2020) slightly reduced wages for low-skilled natives (3-7% in high-immigration metros) but raised wages for skilled trades (electricians, plumbers, foremen) due to complementarity.
Brain Gain / Brain Drain: Talent migration creates winners (destination countries gain human capital = brain gain) and losers (origin countries lose talent = brain drain). But brain drain → brain circulation when returnees bring knowledge back. Example: Indian diaspora in Silicon Valley (1980-2020) = initial brain drain (IIT graduates → U.S. tech firms). By 2000s: brain circulation emerged—returnees founded Flipkart, Zomato, Ola (unicorns) with Valley networks/capital. Origin countries benefit from remittances ($89B annually from U.S. to India) and diaspora knowledge transfer. Firms can leverage immigrant employees' networks for international expansion (cultural knowledge, trust networks = lower transaction costs).
Search & Matching Frictions: Immigration reduces labour market search costs by expanding supply, especially for hard-to-fill roles. Example: U.S. nursing shortages (2010-2020)—average time-to-fill for RN positions 60-90 days. Hospitals recruited internationally (Philippines, India), reducing search frictions. Immigrant nurses filled 15-20% of openings in high-shortage metros. Faster hiring → shorter patient wait times → higher hospital revenues. Immigration = friction reduction, productivity gain.
Political Economy Constraints: Immigration policy shaped by political forces—median voter theorem (policy reflects middle voter preferences, not expert consensus), concentrated losses vs. diffuse gains (workers in competing occupations mobilize opposition despite net-positive effects), policy uncertainty (H-1B denial rates 6% → 24% during 2017-2020, firms shifted hiring to Canada). Firms must model political constraints in workforce planning, build coalitions for immigration-friendly policies, diversify geographically to reduce policy risk.
Business Applications
For Global Talent Strategy: Build immigration talent pipelines before hiring needs arise. Partner with universities in origin countries (India's IITs, China's Tsinghua) to create recruiting channels. Sponsor visas proactively (H-1B, O-1 in US; Tier 2 in UK; Blue Card in EU). Leverage diaspora networks—immigrant employees' connections reduce recruiting friction. Tesla, Google, Microsoft: 40-50% foreign-born engineers in deep-tech roles. Immigration policy = competitive advantage in talent-intensive industries.
For Compensation Planning: Immigration affects wage dynamics. Tight immigration policy → labour shortage → wage inflation (U.S. tech 2017-2020: H-1B restrictions drove $300K+ engineer salaries). Loose immigration policy → labour abundance → wage moderation. Model immigration policy scenarios (baseline, restrictive, expansive) to forecast compensation costs. Don't assume wages determined only by productivity—policy drives supply, supply drives wages.
For Geographic Diversification: Reduce immigration policy risk by distributing workforce globally. If U.S. H-1B restrictive, hire in Canada (Express Entry), EU (Blue Card), Singapore (Employment Pass). Amazon, Microsoft, Google: expanded Canadian R&D centers (Vancouver, Toronto) when U.S. visa approvals tightened. Geographic arbitrage = hedge against single-country policy risk. But beware coordination costs (time zones, cultural differences, IP protection variance).
For Advocacy & Policy Engagement: Lobby for immigration policies aligned with business needs. Tech sector: supports H-1B expansion, STEM green cards, startup visas. Agriculture: supports H-2A guest worker programs. Healthcare: supports nurse/doctor visa pathways. Build coalitions beyond business (include immigrant advocacy groups, universities, consumers) to shift median voter. ROI on immigration lobbying high if industry-aligned policy passes (access to global talent vs. constrained domestic pool).
Immigration Strategy Framework Talent acquisition: Build global recruiting pipelines (university partnerships in origin countries), sponsor visas proactively (don't wait for hiring need), leverage diaspora networks (immigrant employee referrals), invest in visa/relocation support Policy risk management: Diversify workforce geography (Canada, EU, Singapore as hedges), model policy scenarios (baseline, restrictive, expansive), lobby collectively (industry coalitions), monitor political cycles (election outcomes affect policy) Complementarity optimization: Pair immigrant workers with complementary native workers (e.g., immigrant engineers + native PMs/designers), structure teams to maximize knowledge spillovers (mixed-nationality collaboration), document productivity gains (build business case for immigration support) Fiscal & social considerations: Skilled immigration = net fiscal contributors (high taxes, low service use), supports government R&D funding (immigrant taxes fund NIH, NSF), enhances innovation ecosystems (patents, startups, knowledge spillovers)
Immigration PolicyGlobal TalentWorkforce Strategy
Executive Framework: Navigating External Forces
You've mastered 19+ laws governing macroeconomic cycles, regulatory dynamics, and labour markets. But these forces don't operate in isolation—they interact, compound, and create strategic complexity. The best executives synthesize external environment analysis into integrated decision-making. Here's a 4-layer framework for navigating macro, regulatory, and workforce dynamics.
The 4-Layer External Environment Framework
Four Layers of External Analysis Layer 1: Macroeconomic Environment - Business cycles, inflation, interest rates, exchange rates, fiscal/monetary policy Layer 2: Regulatory Dynamics - Capture, public goods, externalities, antitrust, institutional quality Layer 3: Labour Market Forces - Supply/demand, human capital, immigration, wage dynamics Layer 4: Cross-Cutting Integration - How layers interact to create compounding effects or strategic trade-offs
Layer 1: Macroeconomic Environment Strategy
Economic Law
Strategic Insight
Executive Action
Business Cycles
Recessions are inevitable (6-10 year cycles). Prepared companies emerge stronger.
Build cash reserves in expansions (40%+ of market cap), deploy counter-cyclically in recessions (acquire distressed assets, hire talent, lock in contracts at depressed prices)
Inflation Dynamics
Inflation erodes purchasing power, compresses margins for slow movers. Speed = survival in hyperinflation.
Dynamic pricing (adjust prices quarterly in moderate inflation, daily in hyperinflation), fast inventory turns, dollar-denominated contracts, inflation escalators in SaaS contracts
Interest Rates
Rates drive cost of capital, NPV of projects, asset valuations, M&A multiples. 6-12 month transmission lag.
Low rates: accelerate CapEx/M&A, issue long-term debt. High rates: delay investments, pay down debt, build cash, prepare for recession
Exchange Rates
Currency swings (>10%) can erase profit margins. Global revenues + concentrated costs = extreme FX exposure.
Dynamic pricing by market (pass through FX moves), FX hedging (forward contracts), natural hedges (local production, sourcing in customer currency)
Track unemployment by skill level, time-to-fill metrics. Tight markets: pay premium (75th percentile), invest in retention. Slack: hire aggressively, upgrade talent
Human Capital
High human capital requirements + fast growth = favor external recruiting (faster than 8-10 year training pipeline).
Build vs. buy decision: specialized skills (recruit globally), general skills (train internally), firm-specific (develop in-house)
Immigration
Immigration expands talent pools, reduces search frictions, drives innovation. But policy uncertainty high (H-1B volatility).
Build global recruiting pipelines (IITs, Tsinghua partnerships), sponsor visas proactively, diversify geography (Canada, EU hedges), lobby for immigration-friendly policies
Integrated Case Study: Walmart Navigating External Forces (2008-2024)
Case Study: Multi-Layer External Environment Management
WalmartIntegrated Strategy
Context: Walmart ($650B revenue, 2.3M employees, 10,500 stores globally) navigates constant external pressures across all four layers. 2008-2024 period spans financial crisis, low interest rates, inflation spike, regulatory shifts, and labour market transformation.
Layer 1: Macroeconomic Navigation
Business Cycles (2008 Recession): Counter-cyclical advantage—consumers trade down from premium grocers during recession. Walmart sales grew 7% (2008-2009) while competitors struggled. Invested in expansion during downturn (acquired sites from bankrupt retailers cheap), emerged with 15% larger footprint.
Interest Rates (2020-2023): Locked in $20B long-term debt at 2-3% rates (2020-2021) before Fed hikes. Competitors borrowing at 6%+ by 2023. Saved $600M+/year in interest costs. Rate timing = strategic advantage.
Exchange Rates: International operations (Mexico, China, Canada) = 25% of revenue. Strong dollar (2022) = $2B FX headwind. Hedged 60% of exposure via forward contracts, shifted production to local suppliers (natural hedge), raised prices in local markets. Mitigated 80% of FX impact.
Layer 2: Regulatory Dynamics
Labour Regulations: State minimum wage increases ($7.25 → $15 in some states, 2015-2023) = $4B annual cost. Walmart response: (1) Invested $2B in automation (self-checkout, inventory robots), (2) Reduced headcount 5%, (3) Increased productivity targets 15%. Offset 60% of wage impact through automation ROI.
ESG/Climate Regulations: Anticipated carbon pricing (shadow price $50/ton internally). Invested $5B in renewables (solar on stores, electric delivery fleet), committed to zero emissions by 2040. When regulations arrive, positioned as leader vs. laggards scrambling to comply.
Layer 3: Labour Market Forces
Tight Labour Market (2021-2023): Unemployment 3.5%, warehouse worker shortages. Walmart raised starting wages $11 → $17/hour (+55%), added benefits (college tuition, healthcare), reduced turnover from 60% → 40%. Labour cost increased $3B, but retention savings + productivity gains = $1.5B net benefit.
Immigration Policy Impact: H-2A guest worker program (distribution centers, warehouses) provided 10% of workforce in high-growth regions. Visa restrictions (2017-2020) → 15% longer time-to-fill, 8% wage inflation. Diversified hiring (veterans programs, older workers re-entry) to reduce immigration dependency.
Human Capital Investment: Walmart Academy (200+ training centers) upskills 500K employees/year. ROI: trained employees 15% more productive, 10% less turnover. $1B annual training investment = $2B+ productivity/retention gains.
Seven Executive Mistakes in External Environment Management
Mistake
Why It Happens
How to Avoid
1. Ignoring Cycle Timing
Lever up in expansion peaks (overconfidence), forced to deleverage in recession (worst timing). Example: Private equity deals at 2007 peak = overleveraged in 2008 crash.
Build cash in booms (resist peer pressure to deploy), maintain 40%+ dry powder for counter-cyclical deployment. Track cycle indicators: profit margins, unemployment, valuations.
2. Linear Extrapolation
Assume current trends continue indefinitely. Low inflation forever → shocked by 2021-2023 spike. Low rates forever → unprepared for 2022-2023 hikes.
Scenario planning: model baseline + upside + downside cases. Stress test strategy against macro shocks (recession, inflation, rate surge). Build optionality to adapt.
3. Siloed Analysis
Finance tracks rates, HR tracks labour, Government Relations tracks regulation—no integration. Miss compounding effects and strategic trade-offs.
Cross-functional Macro Intelligence Council (Finance + HR + Gov Relations + Strategy). Quarterly external environment reviews synthesizing all four layers.
4. Reactive Policy Response
Wait for regulations to pass before adapting. Example: Auto industry lobbied against California emissions standards instead of investing in EVs early—lost to Tesla.
Proactive policy engagement: lobby for favorable outcomes, invest ahead of likely regulations (ESG, immigration reform), build flexibility to pivot when policy shifts.
5. Underpricing Labour Risk
Assume talent always available at market wages. Tight labour markets → wage spirals, unfilled positions, project delays. Example: Tech 2020-2022 hiring frenzy drove $300K+ engineer salaries.
Track leading indicators: unemployment by skill, time-to-fill trends, wage growth. Build talent pipelines before hiring need, invest in retention during tight markets, diversify geography.
6. Short-Term Externality Thinking
Ignore carbon/ESG risks until regulation forces action. Example: Coal utilities built plants assuming no carbon tax → $100B+ stranded assets when carbon pricing arrived.
Expand into markets based on GDP growth alone, ignore rule of law. Example: Western firms in China tech crackdown 2021 lost billions (unpredictable regulation, no judicial recourse).
Assess institutional quality (property rights, contract enforcement, regulatory stability) before major investments. Strong institutions → long-term CapEx. Weak → minimize fixed assets, political risk insurance, maintain exit optionality.
Executive Synthesis: Navigate, Don't React
The external environment is uncontrollable but predictable. Business cycles recur, inflation responds to policy, labour markets tighten/loosen, regulations evolve. Executives who anticipate cycles, scenario plan macro shocks, integrate cross-functional intelligence, and adapt strategies proactively outperform reactive peers by 20-30% over economic cycles. Master the external environment—don't be mastered by it.
Team Applications: Function-Specific External Environment Playbooks
External environment analysis isn't just for executives—every function needs actionable playbooks for navigating macro cycles, regulatory shifts, and labour dynamics. Here's how Finance, HR, Government Relations, and Strategy teams apply macro/regulatory/labour economics laws to drive business outcomes.
Core Responsibility: Translate external economic forces into financial strategy—capital allocation, debt management, pricing, FX hedging, scenario planning.
Tactic
Economic Law
Implementation
Key Metrics
Cycle-Aware Capital Allocation
Business Cycles
Expansion (early-cycle): Invest in growth CapEx, acquire growth companies (low multiples), hire aggressively. Peak (late-cycle): Build cash reserves (target 40% of market cap), pay down debt, prepare dry powder. Recession: Deploy counter-cyclically (distressed asset M&A, lock in suppliers at low prices), maintain investments in core capabilities. Recovery: Scale winning bets from recession, expand capacity ahead of demand recovery.
• Cash as % of market cap • Debt/EBITDA ratio • Cycle-adjusted P/E ratio • CapEx vs. depreciation
Inflation Hedging Strategy
Inflation Dynamics
Pricing: Inflation escalators in contracts (CPI +2% annual adjustments in SaaS/B2B), dynamic repricing (quarterly price reviews in moderate inflation, monthly in high inflation). Hedges: Commodity futures (lock in input costs 6-12 months forward), TIPS bonds (Treasury Inflation-Protected Securities), real assets (real estate, infrastructure with inflation-linked revenues). Working Capital: Fast inventory turns (JIT reduces inflation exposure), dollar-denominated contracts (emerging markets), advance purchases (prepay suppliers in hyperinflation).
• Price realization rate • Gross margin vs. CPI • Inventory turnover days • % contracts with escalators
Interest Rate Risk Management
Interest Rates
Low rates (0-2%): Issue long-term debt (10-30 year maturities), fund M&A/CapEx with cheap debt, pursue NPV-positive projects (lower hurdle rates). Rising rates (2-5%+): Delay debt issuance, pay down variable-rate debt, reduce leverage, shift to equity financing, increase project hurdle rates. Hedging: Interest rate swaps (fixed-for-floating swaps protect against rate rises), stagger debt maturities (avoid refinancing cliff in high-rate environment).
• Weighted avg. cost of debt • Fixed vs. floating rate mix • Debt maturity profile • Interest coverage ratio
FX Exposure Management
Exchange Rates
Transaction hedging: Forward contracts (lock in rates for foreign receivables/payables), currency options (protect downside, keep upside). Translation hedging: Natural hedges (match revenue currency to cost currency, produce locally), FX debt (borrow in foreign currency to offset foreign asset exposure). Pricing: Dynamic pricing by market (pass through FX moves to customers), multi-currency contracts (invoice in customer currency, hedge centrally).
• % revenue hedged • FX impact on EBITDA • Hedge effectiveness ratio • Local production as % of local sales
Fiscal/Monetary Policy Tracking
Fiscal/Monetary Policy
Monitor: Fed/ECB policy guidance (dot plots, press conferences), legislative calendars (infrastructure bills, tax reforms, stimulus programs). Scenario planning: Model baseline (consensus forecast) + hawkish (rapid rate hikes, tight fiscal) + dovish (extended low rates, fiscal expansion). Frontrun policy: Deploy ahead of infrastructure spending (construction, materials), lobby for tax incentives (R&D credits, green energy subsidies), adjust capital allocation when policy shifts signal recession/expansion.
• Policy forecast accuracy • Scenario planning range • Time to policy adaptation • Lobbying ROI
Finance Team Macro Scorecard: Track leading economic indicators monthly—unemployment rate, ISM manufacturing index, yield curve (10-year minus 2-year spread), Fed funds rate, CPI/PPI inflation, dollar index. Build proprietary recession probability model (yield curve inversion + PMI contraction = 70% recession within 12 months). Present quarterly macro outlook to executive team with capital allocation recommendations.
HR Team: Labour Market Intelligence & Workforce Strategy
Core Responsibility: Navigate labour supply/demand dynamics, immigration policy shifts, human capital investment decisions to secure talent at optimal cost.
• Unemployment rate by skill • Time-to-fill by role • Offer acceptance rate • Voluntary turnover rate
Compensation Planning
Labour Supply & Demand
Tight markets: Pay 75th percentile+ (retention premium), accelerate raises (semi-annual vs. annual), expand equity grants, invest in non-monetary perks (remote work, flexibility). Balanced markets: Pay median to 60th percentile, standard annual raises (3-5%), maintain benefits competitiveness. Slack markets: Pay median, freeze base salaries (bonus variability instead), reduce signing bonuses, negotiate down external offers. Skill premiums: ML/AI engineers 30-50% above median, specialized skills (cybersecurity, cloud architecture) 20-30% premiums, commoditized skills at market median.
• Compensation percentile vs. market • Turnover by pay quartile • Skill premium analysis • Total rewards cost per employee
Immigration Strategy
Immigration Economics
Global talent pipelines: University partnerships (IITs in India, Tsinghua in China), campus recruiting abroad, credential recognition (foreign degrees, experience). Visa sponsorship: Proactive H-1B filings (April lottery, 6-month lead time), O-1 visas for exceptional talent (higher approval rates), L-1 transfers from international offices. Policy hedges: Diversify geography (Canadian offices for H-1B denials, European hubs for global mobility), invest in credential pathways (certifications for non-degreed candidates), lobby for immigration-friendly policies. Complementarity optimization: Hire immigrants in complementary roles (H-1B engineers complement native PMs/designers, raise overall productivity).
• % workforce foreign-born • Visa approval rates • Time to immigration compliance • Complementarity wage effects
Build vs. Buy Talent
Human Capital Theory
External recruiting (buy): Specialized/scarce skills (ML, aerospace engineering), fast growth (can't wait 8-10 years for training pipeline), senior leadership (experience required). Internal development (build): Firm-specific skills (proprietary systems, unique processes), abundant skills (general business, sales), long-term employees (lower turnover risk). Hybrid approach: Hire mid-career talent (3-5 years experience), train on firm-specific skills, promote into leadership. ROI calculation: Training cost < (productivity gains × retention rate × expected tenure). Example: $50K training investment, 20% productivity boost, 80% retention, 5-year tenure = $50K < ($100K annual gain × 0.8 × 5) = $400K benefit. Strong ROI.
• Build vs. buy mix by role • Training ROI by program • Promotion rate (internal pipeline) • Retention by development investment
Workforce Development
Human Capital Theory
High human capital roles: Deep training investment (technical certifications, advanced degrees, 6-12 month onboarding), mentorship programs, career ladders (clear progression). Moderate human capital: Standard onboarding (1-3 months), on-the-job training, cross-functional rotations. Low human capital: Minimal training (1-2 weeks), focus on productivity/efficiency, higher acceptable turnover. Retention tactics: Golden handcuffs (equity vesting, retention bonuses), skill differentiation (firm-specific training reduces outside options), internal mobility (career paths retain talent).
• Training hours per employee • Skill development completion rates • Internal mobility rate • Turnover by human capital level
HR Team Labour Market Scorecard: Monthly dashboard tracking: unemployment rate (overall + by skill category), average time-to-fill (by role family), wage growth vs. CPI, offer acceptance rate, voluntary turnover rate, immigration policy changes (H-1B cap, processing times), competitor wage movements. Quarterly workforce scenario planning: tight labour market playbook (retention focus, wage premiums) vs. slack market playbook (aggressive upgrading, selective hiring).
Government Relations Team: Regulatory Intelligence & Advocacy
Core Responsibility: Navigate regulatory dynamics, lobby for favorable policies, monitor antitrust/compliance risks, build political capital.
Tactic
Economic Law
Implementation
Key Metrics
Regulatory Capture Strategy
Regulatory Capture
Incumbents (defend moat): Lobby for licensing requirements (taxi medallions, occupational licensing), safety regulations (favor large players with compliance scale), standards that entrench existing tech. Disruptors (attack moat): Find regulatory arbitrage (Uber operated as tech platform, not taxi service), move fast before capture occurs (scale before regulators act), grassroots campaigns (mobilize customers against incumbents). Revolving door: Hire former regulators (FDA, FCC, DOJ experience), place executives in regulatory roles (future relationships), provide policy expertise (comment letters, testimony).
• Lobbying spend vs. competitors • Regulatory wins/losses • Revolving door hires • Policy influence score
Public Goods Advocacy
Public Goods
R&D subsidies: Lobby for government funding (DARPA, NIH, DOE grants), demonstrate public benefit (national security, health, clean energy), coordinate industry coalitions (share lobbying costs). Industry consortia: Join pre-competitive research groups (SEMATECH in semiconductors, Open Compute in data centers), contribute to open-source strategically (build goodwill, influence standards). Infrastructure advocacy: Push for public investment (broadband, EV charging, ports), document economic benefits (job creation, GDP growth), align with political priorities (bipartisan infrastructure bills).
• Government funding secured • Consortium participation • Infrastructure policy wins • Public-private partnership ROI
Externality Management
Externalities
Carbon pricing: Advocate for market-based solutions (cap-and-trade over command-and-control regulation), shadow carbon pricing internally ($50/ton assumption for investment decisions), invest pre-mandate (clean tech, renewables—Tesla playbook). ESG regulation: Proactively adopt disclosure standards (TCFD, SASB), set ambitious targets (net-zero commitments), document progress (sustainability reports). Tobacco/alcohol/sin taxes: If in affected industry, argue for moderate taxes (avoid black markets), invest in harm reduction (e-cigarettes, low-alcohol products), diversify revenue streams.
Talent availability by geography: Assess local unemployment, university output (STEM graduates), immigration policies before expansion. Example: Amazon avoided expensive coastal metros, built HQ2 in Northern Virginia (lower labour costs, immigration access via Dulles airport). Wage inflation impacts: Model unit economics under tight labour (15% wage growth scenario). If margins negative, delay expansion or automate. Human capital requirements: High human capital needs (rocket engineering, AI research) → locate near talent clusters (Silicon Valley, Boston). Low human capital needs (warehousing, customer service) → prioritize cost/infrastructure over talent density. Immigration policy hedging: If reliant on H-1B/skilled immigration, diversify to Canada/EU (friendly immigration policies), build remote-first infrastructure.
• Talent density by market • Wage inflation scenario impact • Human capital availability scores • Immigration policy risk assessment
Institutional Quality Evaluation
Institutional Quality (implied across laws)
Scoring framework: Assess countries/markets on: (1) Property rights protection, (2) Contract enforcement (judicial efficiency), (3) Regulatory predictability, (4) Corruption levels (Transparency International index), (5) Political stability. Strategic implications: Strong institutions (U.S., Western Europe, Singapore) → long-term CapEx, IP-intensive operations. Moderate (Brazil, India, Mexico) → partnerships, joint ventures, phased investment. Weak (Venezuela, Russia, some African markets) → minimize fixed assets, political risk insurance, maintain exit optionality. Monitoring: Track World Bank Ease of Doing Business rankings, Transparency International corruption scores, political risk ratings (Moody's, S&P sovereign risk).
• Institutional quality scores by market • Investment allocation by institution strength • Political risk incidents • Exit option preservation
Series Conclusion: Your Economics Toolkit for Business Leadership
Congratulations on completing all 8 parts of our Economics for Business Strategy series! You've mastered 103+ economic laws spanning market fundamentals, production economics, competitive positioning, game theory, consumer psychology, innovation dynamics, deal economics, and external environments. This knowledge forms a comprehensive toolkit for strategic decision-making at every organizational level.
Economics isn't just theory—it's a practical framework for understanding markets, anticipating competitive moves, designing pricing strategies, structuring deals, and navigating uncertainty. Whether you're a CEO setting corporate strategy, a product manager prioritizing features, a sales leader negotiating contracts, or an investor evaluating opportunities, these economic principles provide the analytical foundation for better decisions.
Applying Your Economics Knowledge
Strategic Planning: Use market structure, competitive dynamics, and platform economics to identify opportunities
Pricing & Positioning: Apply behavioral economics, elasticity, and reference pricing for revenue optimization
Product Development: Leverage innovation economics, substitution effects, and network effects for product strategy
Negotiations & Deals: Master BATNA, transaction costs, and real options for value-creating agreements
Risk Management: Navigate uncertainty using Black Swan thinking, optionality, and strategic flexibility
Organizational Design: Apply incentive theory, principal-agent dynamics, and human capital frameworks
The economic lens transforms how you see business challenges. Where others see chaos, you see patterns. Where others react, you anticipate. Where others compete on price, you build moats. This is the power of economic thinking—and you now have the complete toolkit.