We use cookies to enhance your browsing experience, serve personalized content, and analyze our traffic.
By clicking "Accept All", you consent to our use of cookies. See our
Privacy Policy
for more information.
Innovation & Platform Economics: 11 Laws for Digital Dominance
January 24, 2026Wasil Zafar50 min read
Master the economic principles driving technological disruption, platform dominance, and digital ecosystem orchestration—the playbook for innovation strategy. Part 6 of our 8-part Economics for Business Strategy series.
Introduction: The Economics of Digital Transformation
Technology changes everything—from exponentially declining computing costs to disruptive business models to platform-based ecosystems that connect millions of participants. Understanding innovation economics separates incumbents who successfully adapt (Microsoft's cloud transformation, Netflix's streaming pivot) from those disrupted by startups (Blockbuster, Nokia, Kodak). Platform economics explains how Apple orchestrates a $1 trillion+ ecosystem, why Airbnb doesn't own hotels, and how Google monetizes free search through multi-sided markets.
These 11 laws cover technological innovation (Moore's Law, S-curves, disruption theory) and platform dynamics (two-sided markets, chicken-egg problems, envelopment strategies). From Clayton Christensen's innovator's dilemma to Geoffrey Moore's crossing the chasm, this is the economic foundation of tech strategy.
Innovation Dynamics: How to identify disruptive threats, manage cannibalization, and navigate technology lifecycles
Platform Strategy: Orchestrating two-sided markets, solving chicken-egg problems, and defending against envelopment
Digital Moats: Building data network effects, reducing multihoming costs, and creating ecosystem lock-in
Disruption Defense: When to cannibalize your own products and how incumbents can respond to upstarts
Ecosystem Orchestration: Managing complementors, setting standards, and capturing value in platform ecosystems
Let's begin with the exponential force that powers all digital innovation: Moore's Law.
Moore's Law: Exponential Computing Power
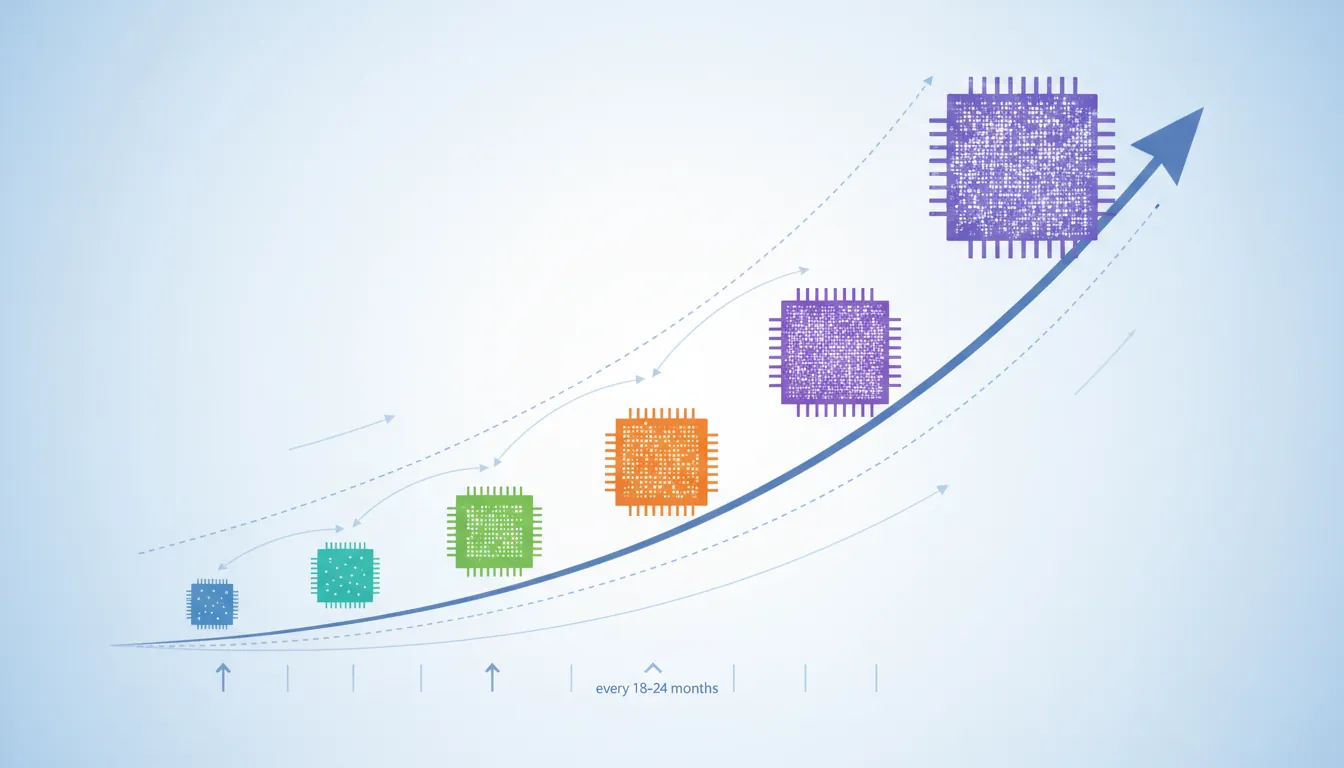
Core Principle: The number of transistors on a microchip doubles approximately every 18-24 months while cost per transistor halves. Drives exponential improvement in computing performance and enables tech business models that rely on ever-cheaper computation.
Moore's Law illustrating the exponential doubling of transistors on microchips every 18-24 months
Setup: AWS EC2 launched 2006. Standard instance: $0.10/hour for computing power roughly equivalent to 2006 desktop PC. By 2024, same $0.10 buys 100× more computing (faster CPUs, more RAM, better storage).
Result: AWS cut prices 100+ times (2006-2024). Average annual price reduction: 15-20% for equivalent compute. Netflix streaming business model impossible at 2006 prices—encoding 4K video for 250M subscribers required compute costs 1/100th of 2006 levels. Moore's Law enabled cloud to displace on-premise IT.
Key Insight: Build businesses that benefit from deflation. AI/ML models: training cost drops 50% every 2 years (better chips). Startups can now train models on $10K that cost $1M in 2015. Defensive moat = data/algorithms, not compute (compute becomes commodity).
Business Applications
For Strategy Teams: Plan for exponential improvement in tech capabilities. Product impossible today may be viable in 3 years (example: real-time video translation required $100M infrastructure in 2015, now feasible on smartphone). Don't dismiss "too expensive" ideas—revisit as Moore's Law drives costs down. Google's self-driving car: required $150K LIDAR sensors (2010), now $500 sensors enable affordable autonomous vehicles.
For Product Teams: Design for tomorrow's compute, not today's. Netflix built streaming infrastructure assuming bandwidth/compute would improve 10× (correct bet). Build features that are "barely possible" today—they'll be easy tomorrow. But beware: if your moat is raw compute power, Moore's Law commoditizes your advantage. Sustainable moat = proprietary data, network effects, brand, not just better tech.
For Finance Teams: Model CapEx with deflation assumptions. Cloud pricing drops 15-20% annually—five-year budget for compute should assume 50%+ cost reduction. Don't lock into long-term contracts at current prices (unless deep discounts). Moore's Law rewards flexibility: month-to-month pricing captures deflation benefits.
Strategic Implications of Moore's Law What becomes possible: Real-time AI inference, edge computing, personalized medicine, autonomous vehicles What becomes commoditized: Raw compute, storage, bandwidth (cloud providers compete on price) Where to build moats: Data (training sets), algorithms (proprietary models), network effects, brand Timing strategy: Early-mover advantage in data collection, but wait for compute deflation before scaling Note: Moore's Law slowing (physics limits), but specialized chips (GPUs, TPUs, neuromorphic) continue exponential gains for specific workloads
Technology StrategyCloud EconomicsAI/ML Strategy
Experience Curve: Cost Drops with Cumulative Output
Core Principle: Unit costs decline by a consistent percentage (typically 10-25%) with each doubling of cumulative production. Driven by learning (workers get faster), process improvements (bottlenecks eliminated), and scale economies. First mover who scales fastest achieves cost advantage over followers.
Setup: Solar panel cost per watt: $76 (1977), $1.80 (2010), $0.20 (2024). Price dropped 99.7% over 47 years. Not due to raw material costs (silicon)—due to cumulative production experience.
Mechanism: Every doubling of cumulative solar installations ? 20% cost reduction (Wright's Law). Global solar capacity doubled every 2-3 years (1990-2024). Each doubling: manufacturers learned how to reduce waste, automate production, optimize supply chains. China scaled fastest (70% of global production by 2020) ? lowest costs ? dominated market.
Result: Solar now cheaper than coal in most markets (2024). Experience curve made renewable energy economically inevitable. First movers in solar (Germany, Japan) lost to fast scalers (China). Lesson: speed to scale matters more than early-mover timing.
Business Applications
For Manufacturing Teams: Track cost per unit vs. cumulative units produced. Plot on log-log scale—should be straight line downward. If cost isn't declining, you're not learning. Benchmark against industry experience curve (semiconductors: 25% reduction per doubling, aircraft: 15%, chemicals: 10%). If you're below industry curve, you're operationally weak. Above curve = competitive advantage.
For Pricing Teams: Price based on future costs, not current costs. Tesla Model 3: priced at $35K (2017 announcement) when production cost was $50K. Bet on experience curve bringing costs below price within 2 years (correct). Competitors priced EVs based on current high costs ? couldn't compete when Tesla's costs dropped 40% while prices stayed flat.
For Strategy Teams: Race to scale in new markets. First to 10,000 units has 20-30% cost advantage over competitor at 5,000 units (assuming 20% experience curve). Winner-take-most dynamics in industries with steep experience curves. Prioritize volume growth over profitability in early years—scale drives future profitability through cost reduction.
Leveraging Experience Curve Effects Measure learning rate: Track unit cost vs. cumulative volume (typically 10-30% reduction per doubling) Accelerate production: Volume maximization in early years compounds cost advantages Price for future costs: Set prices based on costs at 2× current volume, capture margin as you scale Defend through scale: High-volume incumbents have structural cost advantage (hard to displace) Caution: Experience curve flattens at maturity—diminishing returns to further volume gains
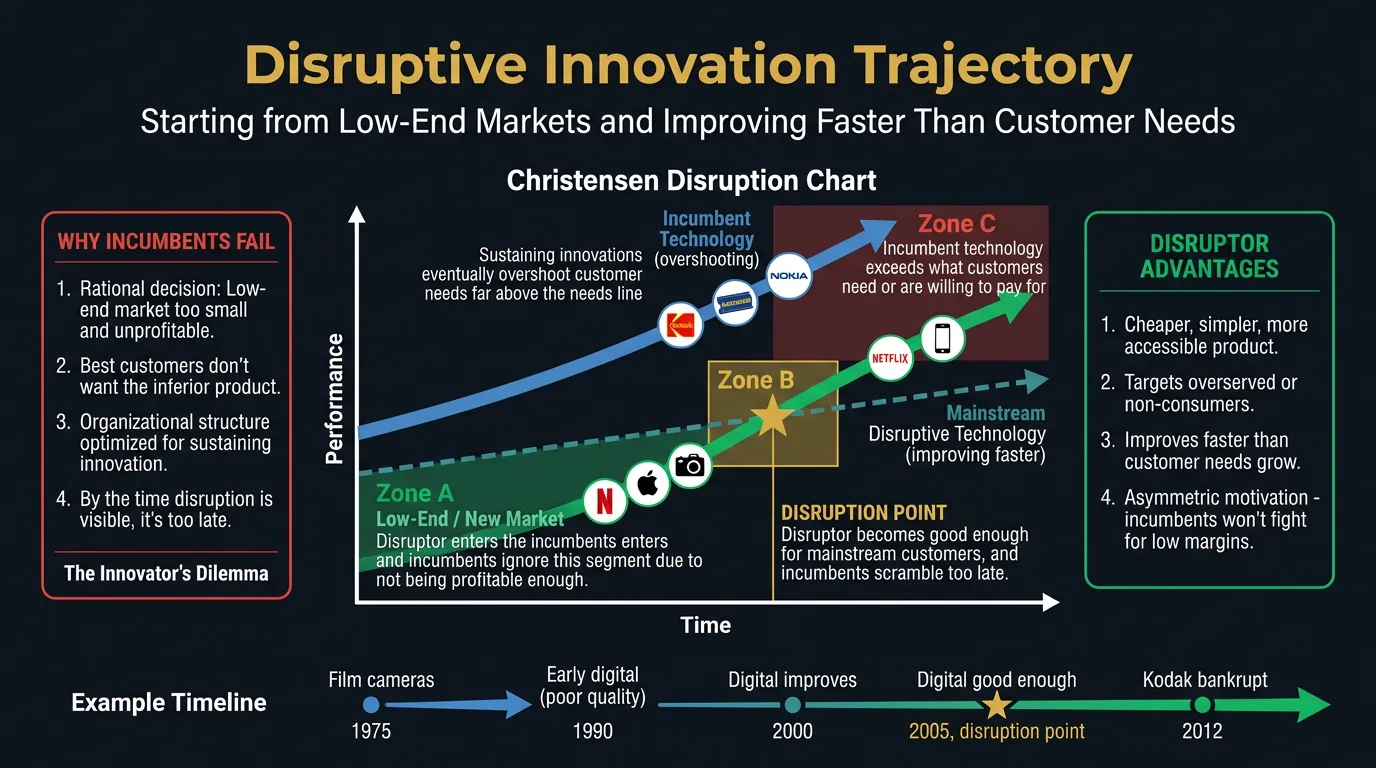
Core Principle: Disruptive innovations start in low-end or new markets (worse performance, lower cost) and improve faster than customer needs. Incumbents ignore them (not profitable, doesn't serve best customers), then get blindsided when disruptor improves enough to steal mainstream market.
Disruptive innovation trajectory starting from low-end markets and improving faster than customer needs
Setup: Kodak invented digital camera (1975). Image quality: terrible (0.01 megapixels). No instant gratification (view on TV). Professional photographers ignored it—film superior for print quality, color accuracy, resolution.
Disruption Path: Digital improved exponentially (Moore's Law). 1995: 1MP (acceptable for web). 2000: 3MP (acceptable for 4×6 prints). 2005: 8MP (matches film for most use cases). 2010: 12MP+ (exceeds film). Kodak dismissed threat until too late—digital sales cannibalized film revenue faster than Kodak could pivot.
Result: Kodak filed bankruptcy (2012). Film revenue collapsed from $16B (1999) to $0 (2012). Incumbents' dilemma: digital cannibalized profitable film business, so Kodak optimized for declining market instead of embracing disruptor. Classic mistake: protect existing revenue instead of cannibalizing yourself.
Business Applications
For Strategy Teams: Actively look for "bad" solutions to your problem that are improving fast. Cloud computing was terrible vs. on-premise servers (2008)—slow, unreliable, insecure. But improved exponentially while on-premise stayed flat. By 2015, cloud superior for most workloads. Don't dismiss competitors because they're "not good enough yet." Ask: "What's their improvement trajectory? Will they be good enough in 3 years?"
For Product Teams: Build "good enough" products for low-end markets, then move upmarket. iPhone (2007): worse than BlackBerry for email, worse than Nokia for calls, worse than iPod for music. But "good enough" at all three + touchscreen UI. Improved faster than incumbents, became best at everything by 2012. Disruptors don't need to be best—just good enough + improving faster.
For Innovation Teams: Create autonomous units to pursue disruptive ideas. Amazon AWS (2006): launched as separate business unit, not part of retail. Allowed to cannibalize potential server sales to retailers. Became $90B business (2024). If AWS had been inside retail org, would've been killed to "protect partner relationships." Disruption requires insulation from core business incentives.
Defending Against Disruption (Clayton Christensen Framework) Warning signs: New entrant serves "bad" customers (low-end, non-consumers), offers worse product at lower price, improves faster than you Incumbent trap: Optimize for best customers (high margin) while disruptor takes low end, then improves to steal mainstream Defense strategy: (1) Create separate business unit to pursue disruptor, (2) Cannibalize yourself before others do, (3) Acquire disruptors early Examples of disruption: Netflix vs. Blockbuster, Uber vs. taxis, Airbnb vs. hotels, Tesla vs. Detroit, Zoom vs. Cisco
Innovation StrategyCompetitive ThreatMarket Entry
Technology S-Curve: Performance Plateaus Over Time
Core Principle: Technology performance follows S-curve: slow initial progress, rapid improvement in middle phase, diminishing returns at maturity. Smart companies jump to new S-curve (next-generation tech) before current technology saturates. Late jumpers get disrupted.
Real-World Application: Hard Drive Storage Density
Setup: Hard drive areal density (bits per square inch): 2,000 (1980), 10 billion (2000), 1 trillion (2015). Growth rate: 40%/year (1980-2010), 10%/year (2010-2020), <5%/year (2020-2024). S-curve saturating—approaching physics limits of magnetic recording.
S-Curve Jump: Western Digital/Seagate optimized magnetic recording (incremental gains). Meanwhile, Samsung/Intel invested in SSDs (flash memory—different S-curve). 2015: SSDs expensive but 10× faster. 2024: SSDs same price as HDDs for consumer use cases. Incumbent HDD makers (Western Digital, Seagate) revenue declined 40% (2015-2024) as market shifted to SSDs.
Key Insight: Betting on old S-curve in late stages = betting against physics. Winners jumped to new S-curve early (Samsung invested in flash 2005-2010 when unprofitable). Incumbents optimized old tech too long, missed jump window. By 2015, too late—Samsung/Intel had scale advantage on new curve.
Business Applications
For R&D Teams: Map technology performance over time. If improvement rate slowing, you're approaching S-curve top—time to invest in next-generation tech. Intel's mistake: kept optimizing x86 CPUs (saturating S-curve) while ARM invested in mobile chips (new S-curve). By 2020, ARM dominated mobile, challenging Intel in servers. Diversify R&D: 70% on current tech, 30% on next S-curve.
For Product Teams: Don't launch major products on mature S-curves. Blockbuster invested in DVD-by-mail (2004) when streaming S-curve emerging—wrong curve, wrong timing. Netflix bet on streaming (2007) despite terrible quality—correct curve, early but right. Product lifespans: 10+ years on young S-curve, 2-3 years on mature S-curve before obsolescence.
For Strategy Teams: Identify S-curve inflection points in your industry. Battery energy density: lithium-ion S-curve maturing (incremental gains), solid-state batteries = new S-curve (10× energy density potential). Auto manufacturers investing in solid-state now (GM, Toyota) position for 2030+ market. Late movers will scramble to license technology at high cost.
Managing S-Curve Transitions Early stage (bottom): High risk, slow progress, uncertain if tech will work. Small bets, rapid experimentation Growth stage (middle): Rapid improvement, invest heavily, scale fast. Winner-take-most dynamics Maturity stage (top): Diminishing returns, incremental gains. Start investing in next S-curve Transition timing: Jump to new S-curve when old curve improvement rate <10%/year (mature) Warning: Don't jump too early (new tech not ready) or too late (competitors scaled new curve)
R&D StrategyTechnology LifecycleInnovation Timing
Cannibalization Principle: New Products Eat Old Ones
Core Principle: Launching superior product cannibalizes sales of existing product. Companies fear cannibalization, delay launches to protect legacy revenue. But if you don't cannibalize yourself, competitors will. Better to cannibalize your own revenue than lose it to rivals.
Setup: iPod revenue: $9B (2008), Apple's largest product line. iPhone (2007) included iPod functionality—music, videos, apps. Internal debate: will iPhone cannibalize iPod sales? Answer: yes. Did Apple delay iPhone? No.
Result: iPod revenue collapsed: $9B (2008) ? $4B (2010) ? $1B (2014) ? discontinued (2022). But iPhone revenue grew: $6B (2008) ? $150B (2024). Total Apple revenue: $32B (2008) ? $380B (2024). Cannibalization = correct strategy. If Apple had protected iPod, competitors (Android) would've taken both iPod AND phone markets.
Key Insight: Steve Jobs: "If you don't cannibalize yourself, someone else will." Better to cannibalize high-margin iPod with higher-margin iPhone than let Samsung/Google capture smartphone market. Cannibalization is strategic opportunity disguised as threat.
Business Applications
For Product Teams: Launch better products even if they cannibalize existing ones. Netflix launched streaming (2007) knowing it would cannibalize DVD-by-mail (100% of revenue). DVD revenue: $1.2B (2009) ? $0 (2020). Streaming revenue: $0 (2007) ? $30B (2024). Cannibalization created $200B company. If Netflix had protected DVDs, Hulu/Disney+ would've taken streaming market, leaving Netflix with dying DVD business.
For Finance Teams: Model cannibalization explicitly. New product will take X% of legacy revenue. But total revenue = (legacy - cannibalization) + (new product) + (new customers). Usually net positive if new product superior. Example: Electric vehicles cannibalize gas cars for auto manufacturers. But EVs attract new customers (environmentalists) + higher margins + avoid regulatory penalties. Net: cannibalization increases total market size.
For Sales Teams: Compensate reps on total revenue, not product-specific revenue. If iPhone rep earns more than iPod rep, reps will push iPhone (cannibalizing iPod). Align incentives with company goal (maximize total revenue), not protect legacy products. Microsoft failed at this: Windows Phone reps competed with Windows PC reps for resources. Android/iOS won while Microsoft fought internally.
Setup: 2015 Apple Watch launch: $349-$17,000 (Edition model). Product overlaps with iPod Nano ($149, used for music during workouts). Apple Watch does everything Nano does (music playback, fitness tracking) + notifications, apps, communication. Clear cannibalization scenario: should Apple delay Watch to protect Nano sales?
Cannibalization Decision: Apple proceeds despite internal analysis showing Watch would kill Nano. Logic: (1) Smartwatch category emerging (Samsung Gear, Android Wear launched 2014-2015), (2) If Apple doesn't cannibalize Nano, competitors will capture wrist computing category, (3) Watch ASP $400+ vs. Nano ASP $149 (trading up to higher-margin product), (4) Watch creates Services revenue (apps, Apple Pay transactions) that Nano doesn't.
Result: iPod Nano sales: 2.6M units (2014) ? discontinued (2017). Apple Watch sales: 12M units (2015), 56M units (2023). Revenue: Nano contributed ~$400M annually (2014). Watch contributes $18B+ annually (2023)—45× the revenue. Strategic validation: self-cannibalization captured category before competitors. Samsung smartwatch market share peaked at 12% (2015), declined to 8% (2023) as Apple Watch dominates 50%+ share. If Apple had protected Nano, would have ceded wearables category to Samsung/Fitbit. Lesson: cannibalize yourself or competitors will cannibalize you—always choose self-cannibalization when new technology enables superior product experience.
Strategic Cannibalization Framework When to cannibalize: New product objectively better, competitors emerging, legacy product saturating How to manage: Launch in separate business unit (avoid internal resistance), compensate sales on total revenue, communicate cannibalization as growth strategy Metrics to track: Total revenue (legacy + new), customer acquisition (new product attracts different customers?), margin improvement (new product higher margin?) Classic examples: iPhone vs. iPod, Netflix streaming vs. DVD, AWS vs. on-premise servers, Tesla EVs vs. internal combustion Failure cases: Kodak protected film over digital, Nokia protected feature phones over smartphones, Blockbuster protected stores over streaming
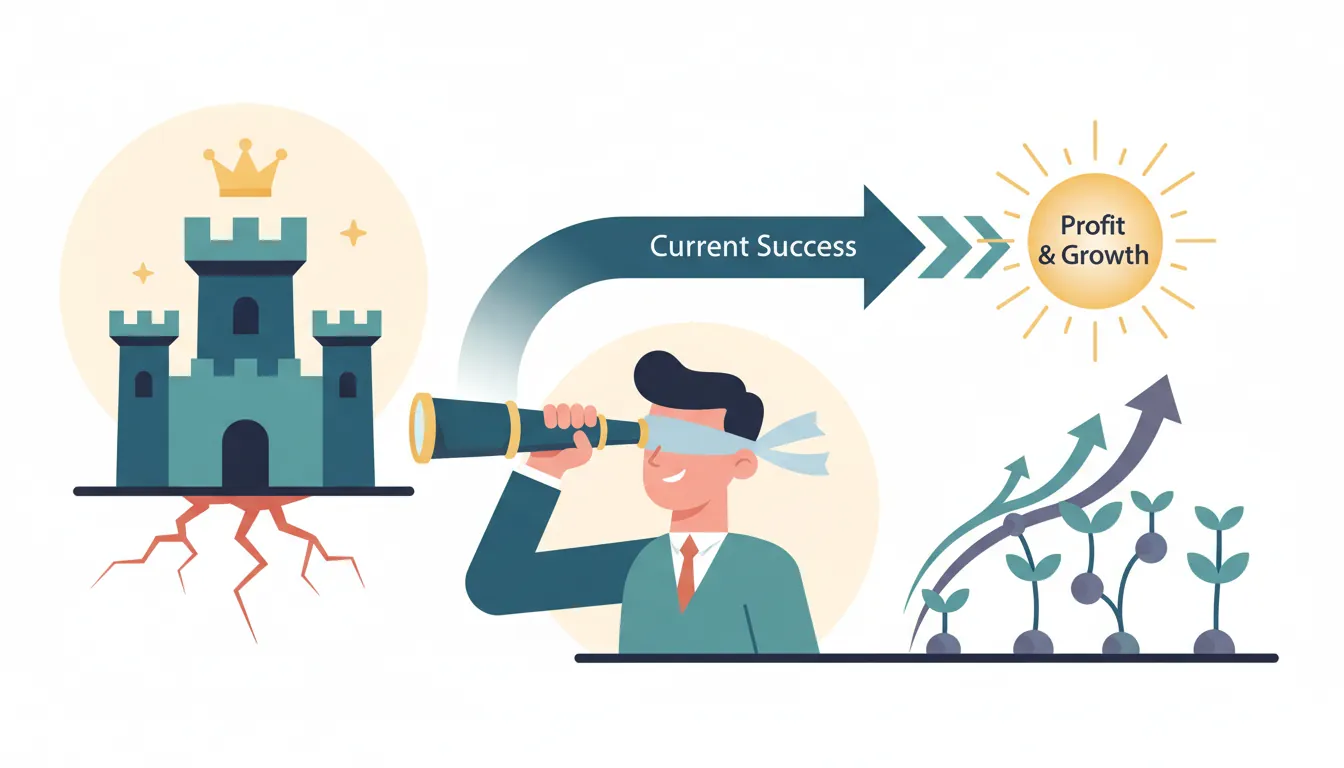
Core Principle: Successful companies fail not because they're lazy or incompetent, but because they do exactly what made them successful—listen to best customers, optimize for high margins, invest in sustaining innovations. This blinds them to disruptive innovations that initially serve "bad" customers with "worse" products.
The Innovator's Dilemma showing how success blinds incumbents to disruptive threats
Real-World Application: Enterprise Software Disrupted by SaaS
Setup: Siebel Systems dominated CRM (1999-2005). Enterprise customers paid $1M+ for on-premise software (18-month implementations). Salesforce launched SaaS CRM (1999): $50/user/month, cloud-based, 5-day setup. Siebel dismissed it: "Not enterprise-grade. Can't customize. Security issues. Our customers would never buy this."
Dilemma Mechanism: Siebel's best customers (Fortune 500) wanted deep customization, on-premise control, dedicated support. Salesforce served "bad" customers (SMBs, startups) with simple needs. Siebel optimized for best customers—added features, complexity, price. Meanwhile, Salesforce improved: added customization (2005), security certifications (2007), enterprise features (2010). By 2012, "good enough" for Fortune 500. Siebel's revenue: $2B (2004) ? acquired by Oracle (2006) ? irrelevant (2012).
Result: Salesforce market cap: $250B (2024). Siebel's rational decisions (serve best customers, optimize high-margin on-premise deals) led to disruption. Doing "right" thing (listening to customers) = strategic failure. Innovator's Dilemma.
Business Applications
For Strategy Teams: Explicitly ignore best customers when evaluating disruptions. Ask: "If we served worst customers (low-end, non-consumers) instead of best customers, what would we build?" Salesforce served small businesses (Siebel ignored). Zoom served consumers (Cisco focused on enterprise). Tesla served luxury buyers (Detroit focused on mainstream). All became category leaders by serving "wrong" customers first.
For Product Teams: Separate sustaining vs. disruptive innovation. Sustaining: makes existing product better for existing customers (higher margins). Disruptive: worse product for different customers (lower margins). Allocate resources: 70% sustaining (feeds current revenue), 30% disruptive (protects future). Netflix: 70% optimizing streaming quality/content, 30% experimenting with gaming/live sports (potential disruptors).
For Leadership Teams: Create autonomous units for disruptive innovations. Amazon AWS: separate P&L, separate leadership, different metrics (growth vs. profitability). Allowed to "waste" resources on "bad" customers (startups paying $100/month vs. enterprise paying $100K). Became $90B business by serving customers Amazon retail would've ignored. Structure determines strategy—traditional divisions can't pursue disruption (wrong incentives).
Escaping the Innovator's Dilemma Warning signs you're trapped: (1) Product getting more complex for best customers, (2) Ignoring low-end competitors as "not good enough", (3) Margins increasing (focus on profitable customers), (4) "Our customers don't want that" dismissing simpler alternatives Escape strategies: (1) Create separate business unit with different success metrics, (2) Acquire disruptors early (Facebook buying Instagram/WhatsApp), (3) Launch "worse" product intentionally for low-end market, (4) Compensate execs on long-term market share, not short-term margins Examples of failure: Blockbuster, Nokia, BlackBerry, Kodak, Borders, Circuit City—all did "right" thing serving best customers, all disrupted Examples of success: Microsoft (cloud), Adobe (subscription), Apple (iPhone), Amazon (AWS)—all cannibalized high-margin businesses to avoid disruption
Core Principle: Platform creates value by facilitating interactions between two distinct user groups (buyers-sellers, advertisers-users, drivers-riders). Must optimize pricing and features for both sides simultaneously. Imbalance kills platform—too many sellers without buyers = ghost town, too many buyers without sellers = poor experience.
Solution: Surge pricing. 2× fare = $20 ? $40. Effect: (1) Demand decreases (some riders decide not to travel or take alternative), (2) Supply increases (drivers attracted by high earnings). Within 15 minutes: wait times drop to 5 minutes, market clears. Both sides happier than with long waits.
Key Insight: Platform must balance both sides continuously. If pricing too low (favors riders), drivers leave, supply collapses. If too high (favors drivers), riders leave, demand collapses. Dynamic pricing (surge) maintains equilibrium. Critics call it "price gouging"—economists call it "market clearing price." Uber's innovation wasn't ridesharing—it was dynamic two-sided pricing.
Business Applications
For Platform Teams: Monitor both sides' engagement metrics separately. Airbnb: track host satisfaction (listings growth, earnings) AND guest satisfaction (booking conversion, reviews). If one side declining, diagnose why. Usually pricing imbalance: hosts want higher fees (more earnings), guests want lower fees (better value). Platform fee structure determines which side subsidizes the other. Airbnb takes ~14% from both sides—balanced extraction.
For Pricing Teams: Price asymmetrically to maximize total value. Credit cards: charge merchants 2-3% (inelastic demand—must accept cards), charge consumers $0 (elastic—will use cash if fees high). Subsidy from merchants funds rewards for consumers. Newspapers: charge advertisers high rates (value = reach), charge readers low rates (value = content). Subsidy from advertisers funds journalism. Two-sided pricing ? fair pricing. Charge each side what maximizes network effects.
For Growth Teams: Solve chicken-egg problem through subsidies. Uber: paid drivers guaranteed earnings (even without rides) in new cities. Ensured supply ready when riders arrived. Lyft tried opposite (recruit riders first, then drivers)—failed because riders saw long wait times, churned immediately. Rule: subsidize hard-to-acquire side, charge easy side. Usually harder to recruit supply (drivers, hosts, sellers) than demand (riders, guests, buyers).
Two-Sided Market Dynamics Pricing strategy: Subsidize price-sensitive side, charge value-capturing side. Google: free for users (generates content/data), charges advertisers (captures value) Liquidity challenge: Need critical mass on both sides simultaneously. eBay: seed marketplace with own inventory, then attract sellers Cross-side network effects: More drivers ? shorter wait times ? more riders ? higher driver earnings ? more drivers (virtuous cycle) Same-side effects: More sellers ? more competition ? lower prices ? worse for sellers. Must manage competitive intensity Platform governance: Set rules (rating systems, quality standards, dispute resolution) that benefit both sides
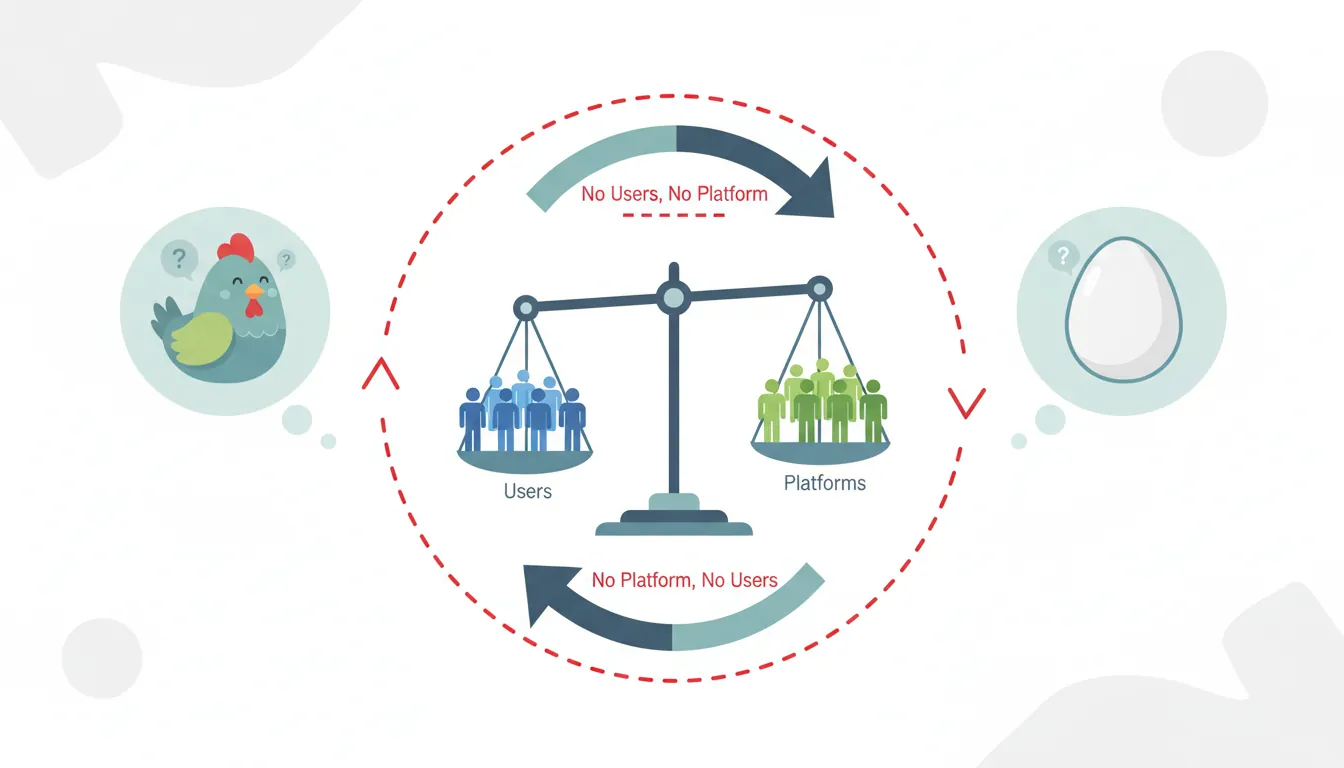
Core Principle: Platforms need both sides to have value, but neither side joins without the other. Riders won't use Uber without drivers. Drivers won't drive without riders. First-mover disadvantage in two-sided markets—early platforms must solve bootstrapping problem through subsidies, vertical integration, or sequential market building.
The chicken-and-egg problem in two-sided markets where neither side joins without the other
Problem: OpenTable launched 1999. Needed: (1) Restaurants using software for reservations, (2) Diners searching for tables. But restaurants won't pay for software without diners. Diners won't use platform without restaurants. Classic chicken-egg.
Solution (Vertical Integration): OpenTable sold reservation management software to restaurants ($1,200 upfront + $200/month). Software worked standalone—restaurants got value immediately (digital reservation book, table management). OpenTable built restaurant supply without needing diners. Then launched consumer-facing app: "Book tables at 5,000+ restaurants." Diners joined because supply already existed. Avoided chicken-egg by vertically integrating restaurant side (sold software) before platformizing (connected diners).
Result: 60,000 restaurants by 2020. $2.8B acquisition by Booking Holdings (2024). Key insight: solve chicken-egg by giving one side standalone value BEFORE connecting both sides.
Business Applications
For Marketplace Teams: Four strategies to solve chicken-egg: (1) Subsidize one side (Uber: guaranteed driver earnings), (2) Start with niche where density achievable (Airbnb: SXSW conference—small geography, high density), (3) Provide standalone value (OpenTable: software works without diners), (4) Fake the other side (Reddit: founders created fake users/content to appear active). Choose based on unit economics: subsidies work if LTV > CAC within 12 months.
For Growth Teams: Launch in dense geographies, not broad ones. Uber: launched San Francisco only (2010). Achieved 50% driver utilization (drivers busy half the time) ? high earnings ? more drivers ? shorter wait times ? more riders. Then expanded city-by-city. Competitor mistake: launch 20 cities simultaneously, achieve 10% utilization everywhere, drivers quit due to low earnings, platform dies. Density > breadth in early days.
For Product Teams: Build single-player mode before multiplayer. LinkedIn: profile creation useful even without network (resume, portfolio). As you add connections, value increases. But initial value = standalone. Pinterest: image bookmarking useful for single user (personal catalog). Sharing/following added later. Products with standalone value solve chicken-egg—users get value on day 1, network effects amplify over time.
Chicken-Egg Solution Playbook Marquee users: Recruit high-profile participants to attract others (Clubhouse invited celebrities, everyone else followed) Subsidies: Pay for one side's participation (Uber driver guarantees, YouTube creator fund) Geographic density: Dominate small area before expanding (Lyft: San Francisco ? Los Angeles ? NYC, not nationwide) Fake it: Simulate the other side until real users arrive (Reddit fake accounts, Yelp fake reviews—ethically questionable but effective) Vertical integration: Provide service yourself before platformizing (Amazon sold own products before opening marketplace)
Core Principle: When switching costs are low, users multihome (use multiple competing platforms simultaneously). Drivers work for Uber AND Lyft. Restaurants list on DoorDash AND Uber Eats. Reduces network effects' defensive value—platform can't lock in supply side. Winner-take-all less likely when multihoming prevalent.
Real-World Application: Food Delivery Wars
Case Study: Restaurant Multihoming
Food DeliveryMultihoming
Setup: Restaurant partners with DoorDash, Uber Eats, Grubhub simultaneously (2020-2024). Why? Zero switching cost—accepts orders from all platforms. Each platform brings incremental demand. Multihoming maximizes revenue.
Platform Impact: Platforms can't differentiate on supply (all have same restaurants). Must compete on: (1) Consumer side (delivery fees, speed, UX), (2) Commission rates (lower take rate attracts restaurants), (3) Consumer demand (restaurants prioritize platform with most orders). Result: commoditization, low margins. DoorDash, Uber Eats, Grubhub all unprofitable 2020-2023 despite billions in GMV. Multihoming prevents winner-take-all monopoly rents.
Key Insight: When supply multihomes, network effects weaken. Can't lock in restaurants because they're non-exclusive. Platforms must compete on price/service perpetually. Contrast with Airbnb: some hosts multihome (Airbnb + Vrbo), but many exclusive due to hassle of managing multiple calendars. Lower multihoming = stronger network effects.
Business Applications
For Platform Strategy: Reduce multihoming through exclusive incentives. Amazon: offer lower commission rates to sellers who list exclusively on Amazon (Brand Registry). DoorDash: guaranteed order volume for restaurants that remove competitors' tablets. Spotify: exclusive podcast deals (Joe Rogan, Gimlet Studios) prevent multihoming to Apple Podcasts. Exclusivity creates differentiation—users can't get same content elsewhere.
For Product Teams: Increase switching costs to reduce multihoming. Shopify: once merchant sets up store, store data, customer database, customizations locked into platform. Merchant COULD multihome (also sell on Amazon, eBay), but operational complexity high. Make platform the "system of record"—all data flows through you. Switching = losing data, breaking workflows.
For Sales Teams: Measure share-of-wallet, not just customer count. If restaurants multihome across 3 platforms, each platform gets ~33% of orders. Winner = platform with highest share-of-wallet (orders per restaurant). Optimize for "primary platform" status: (1) Lowest commissions (restaurants send high-volume orders), (2) Best support (dedicated account managers), (3) Marketing co-investment (drive consumer demand to increase restaurant GMV on your platform).
Managing Multihoming Dynamics High multihoming = weak defensibility: Food delivery, ridesharing (drivers multihome), classified ads (sellers post everywhere) Low multihoming = strong defensibility: Social networks (Facebook), professional networks (LinkedIn), communication (Slack vs. Teams) Reduce multihoming strategies: (1) Exclusive content/features, (2) Data lock-in, (3) Workflow integration, (4) Volume incentives, (5) Loyalty programs Accept multihoming strategies: Compete on price/quality, build consumer brand, increase consumer side lock-in (if supply multihomes, lock in demand)
Platform Envelopment: Bundling to Kill Competitors
Core Principle: Incumbent platform leverages existing user base to bundle competitive feature, commoditizing standalone rival. Attack vector: give away competitor's core product free (cross-subsidized by main platform). Rival can't match price (no subsidy source), loses users, dies. Microsoft bundled IE with Windows (killed Netscape), Office with Windows (killed WordPerfect, Lotus).
Platform envelopment strategy where incumbents bundle competitive features to commoditize standalone rivals
2017 Market: Slack dominates workplace chat (12M daily active users). Charges $6.67-$12.50/user/month. Microsoft sees threat: if teams communicate in Slack, they might abandon Outlook/Office. Envelopment strategy: launch Teams (Slack clone), bundle free with Office 365 (120M existing users). Slack now competes against free alternative. Slack's pricing: $8/user. Teams: $0 (included in Office 365 subscription customers already paying for).
2020-2024 Result: Teams grows to 280M daily active users (2023). Slack: 18M (acquired by Salesforce for $28B—down from $50B potential IPO valuation). Slack didn't lose on features—Teams roughly equivalent. Lost on distribution. Every Office 365 customer gets Teams free. IT departments choose bundled option (lower complexity, lower cost).
Key Insight: Platform envelopment = strategic bundling. Microsoft didn't build better product. Built "good enough" product and leveraged existing distribution (Office 365 base). Slack couldn't match price because no subsidy source. Standalone products vulnerable to envelopment by platforms with adjacent user bases.
Business Applications
For Corporate Strategy: Defend against envelopment through: (1) Differentiation (Slack's deeper integrations, superior UX), (2) Enterprise lock-in (mission-critical workflows only Slack supports), (3) Platform independence (integrate with Microsoft AND Google, don't pick sides). If envelopment inevitable, sell before commoditization complete. Slack sold for $28B—still had premium over free Teams. Waited longer = lower valuation (customers switching to free).
For Product Teams: Use envelopment offensively: identify adjacent markets where you have user overlap. Google enveloped Microsoft Office via Google Workspace (free Gmail ? free Docs/Sheets). Docs not better than Word—but free + collaboration features good enough. Amazon enveloped shipping logistics via Prime (free shipping bundled with video streaming). Standalone shipping companies couldn't match free.
For Pricing Teams: If you're the enveloper (bundler): price bundle low to gain market share, cross-subsidize weak product with strong products. If you're the enveloped (unbundled rival): emphasize superior features, charge premium for quality, target customers who need best-in-class (not good-enough). Adobe Creative Cloud resisted commoditization by dominating professional tier. Consumer tier lost to free alternatives (Canva, Figma).
Platform Envelopment Tactics Classic envelopment cases: Microsoft IE (bundled with Windows, killed Netscape), Google Maps (bundled with Android, killed TomTom), Apple Music (bundled with iPhone, commoditized Spotify) Defense strategies: (1) Go multi-platform (Spotify on iPhone, Android, web—harder for Apple to envelop), (2) Enterprise lock-in (critical workflows), (3) Rapid innovation (stay ahead on features), (4) Regulatory (antitrust claims—Spotify vs. Apple lawsuit) Bundling economics: Marginal cost of adding feature to bundle ~$0. Standalone rival's marginal cost > $0. Bundle always wins on price, rival must win on quality by wide margin
Core Principle: Product improves as more users generate data. Google Search: more queries ? better algorithm training ? more accurate results ? more users ? more queries (virtuous cycle). Data network effects create winner-take-all dynamics—largest player has best data, best product, attracts most users, gets even better data. Difficult to dislodge leader.
Mechanism: Google processes 8.5B searches/day (2024). Each search = data point: query, clicked result, time on page, bounce rate. Aggregate data trains algorithm: "For query X, users prefer result Y over Z" (Y = higher click-through rate, lower bounce). Algorithm updates: rank Y higher, Z lower. Next user searching X gets better results (Y first). Clicks Y, confirms ranking. Algorithm learns faster.
Competitive Moat: Bing (Microsoft) processes ~1B searches/day—10× less data. Algorithm improves 10× slower. Even if Bing's engineering team equally talented, data disadvantage insurmountable. Google's 92% market share (2024) driven by quality gap from data network effects. Users choose Google ? Google gets more data ? quality improves ? users stay ? gap widens.
Key Insight: Data network effects create compounding advantages. Leader's product improves faster than rivals because more users = more data = faster learning. Challenger must be 10× better on features to overcome data disadvantage. Why DuckDuckGo (privacy-focused search) remains niche—privacy = less data collection = weaker algorithm = worse results. Users choose quality (Google) over privacy.
Business Applications
For Data Science Teams: Build data flywheels into product. Waze (navigation): users driving ? real-time traffic data ? better route predictions ? more users adopt Waze ? denser traffic data ? predictions improve. Netflix: users watching ? ratings/viewing behavior ? better recommendations ? more engagement ? more data ? recommendations improve. Design products where usage generates training data that improves product.
For Product Teams: Early-stage strategy: acquire users fast to build data moat. Uber: subsidized rides (lost $1-3 per ride) to gain users, collect routing data, improve ETA predictions. Data moat formed before profitability. Tesla: sold 1M+ cars at low margins to collect autonomous driving data. Now has 10B+ miles of real-world driving data—far more than Waymo, Cruise, competitors. Data advantage = better self-driving model = eventual competitive dominance.
For Strategy Teams: Attack data network effects through: (1) Niche superiority (DuckDuckGo: privacy > quality for some users), (2) Data partnerships (Bing partnered with Yahoo, AOL for query volume), (3) Synthetic data (OpenAI: generate training data via simulations, not just user data), (4) Regulatory data sharing (EU forcing platforms to share data with rivals). If can't match incumbent's data scale, find alternative data source or redefine problem where less data needed.
Data Network Effects Playbook Strongest examples: Google Search, Waze navigation, Netflix recommendations, Spotify Discover, Amazon product recommendations, LinkedIn job matching Weak data effects: E-commerce (Amazon's data doesn't improve shipping speed), ridesharing (Uber's data doesn't improve driver availability), social media (Facebook's data doesn't improve messaging features). Data must directly improve core value proposition Building data moats: (1) Instrument everything (track all user interactions), (2) Close feedback loops (use data to improve product visibly), (3) Scale fast (more users = more data = wider moat), (4) Proprietary data (unique to your product, competitors can't replicate)
AI/ML StrategyCompetitive MoatsProduct-Market Fit
Executive Framework: Digital Innovation Playbook
Innovation and platform economics explain why incumbents fail despite superior resources, why platforms achieve monopolistic scale, and why technological disruption follows predictable patterns. The 11 laws above reveal the mechanisms behind Moore's Law exponentials, disruptive innovation paradoxes, and platform network effects. This framework synthesizes those laws into an actionable system for executives navigating technological change, platform competition, and digital transformation.
Problem: Technology improves exponentially (Moore's Law), but executives plan linearly. Result: underinvestment in emerging tech, overinvestment in mature tech, disruption blindness. Companies caught on wrong side of S-curve transitions (Nokia smartphones, Blockbuster streaming, Kodak digital) despite massive resources.
Solution Framework: Map technology trajectories explicitly, time transitions strategically.
Technology Law
Business Implication
Strategic Action
Warning Signs
Moore's Law
Computing power doubles every 18-24 months. Yesterday's impossible becomes tomorrow's commodity. Enables platform economics (infinite marginal capacity)
Ride cost deflation curve (AWS pricing ?50% every 3 years). Invest in compute-intensive features competitors can't afford today (will be cheap tomorrow). Don't build data centers—cloud scales exponentially cheaper
CapEx-heavy tech infrastructure, on-premise bias, 3-5 year hardware refresh cycles (too slow for exponential improvement)
Experience Curve
Unit costs fall 20-30% for every doubling of cumulative production. First mover gets learning advantage ? cost moat
Race to volume in nascent markets (Tesla batteries, solar panels). Subsidize early adoption to accelerate learning curve descent. Don't enter markets where incumbents have 10× cumulative experience (unrecoverable cost disadvantage)
Entering mature markets without differentiation, expecting to \"compete on quality\" against cost leaders with 1000× experience advantage
Technology S-Curve
All technologies hit diminishing returns eventually. Sustaining innovation yields shrink, disruptive alternatives emerge. Example: Hard drives hit 4TB/platter density limit ? SSDs take market share
Monitor performance improvement rates—if <10% annual gains, S-curve maturity imminent. Hedge with alternative architectures (Intel: CPUs slowing ? invest in GPUs/AI chips). Transition before inflection point, not after
5+ years of declining R&D ROI (smaller improvements despite higher spend), dismissing alternatives as \"not good enough yet\" (classic disruption blindness)
Executive Decision Rule: Create technology radar with 3 zones: (1) Sustaining tech (current S-curve, milk it) ? optimize costs, extend lifespan, (2) Inflection watch (S-curve slowing, alternatives emerging) ? pilot new tech, prepare transition, (3) Next S-curve (alternative gaining traction) ? transition aggressively, cannibalize yourself before others do. Review quarterly—technology transitions compress from 10-year cycles (mainframe?PC: 1980-1990) to 3-year cycles (iPhone?app economy: 2007-2010).
Layer 2: Innovation Portfolio Strategy
Problem: Incumbents over-invest in sustaining innovation (incremental improvements to core business), under-invest in disruptive innovation (low-margin, small market initially). Rational allocation kills long-term viability. Innovator's Dilemma: listening to best customers and maximizing margins ? vulnerability to low-end disruption.
Solution Framework: Strategic cannibalization through portfolio approach—attack yourself before others do.
Innovation Type
Characteristics
Resource Allocation
Governance Model
Core Business (70%)
Sustaining innovation: better products for best customers. High margins, certain ROI, incremental growth
Majority resources (70% budget, best talent). Example: Apple iPhone yearly refresh (camera, processor improvements)
Related innovations: new customer segments, geographies, use cases for existing tech. Moderate risk, 2-3 year payback
Meaningful investment (20% budget). Example: Apple Watch (leverages iPhone ecosystem, targets health/fitness adjacent to communication)
Separate business units with growth targets. 3-year horizon, allow losses initially. Success metric: user growth, engagement
Transformational Bets (10%)
Disruptive innovation: attacks own business or creates new markets. High uncertainty, 5-10 year horizon, potential for 10× outcome OR failure
Small but protected budget (10%). Example: Apple Vision Pro (AR/VR), autonomous vehicle project. Many fail—portfolio approach tolerates casualties
Skunkworks / separate entities insulated from core business metrics. No revenue targets for 3-5 years. Success metric: technical milestones, learning
Cannibalization Strategy—Attack Core Business Proactively:
Cannibalization Scenario
Self-Disruption Playbook
Case Study
Product Cannibalization
Launch product that reduces sales of profitable line BEFORE competitor does. Preserve customer relationship, transition revenue stream. Accept margin decline short-term for market position long-term
Apple iPhone killing iPod: iPod sales peak 2008 (55M units, $9B revenue). iPhone launched 2007—iPod app free. Result: iPod sales ? $0 by 2014. But iPhone captured music playback market, prevented Spotify/Zune from winning standalone device category. Better to cannibalize yourself (keep customer) than let competitor do it (lose customer)
Business Model Cannibalization
Introduce low-margin/free alternative to high-margin model. Preserves customer base, forces competitors to match (destroys their economics). You survive margin compression; pure-play rivals don't
Microsoft Teams free with Office 365: Slack charges $8/user/month, profitable standalone. Microsoft bundles Teams free (cannibalizes potential Teams revenue). But Office 365 has 90%+ margins on productivity suite—can absorb Teams $0 pricing. Slack can't match free (no subsidy source). Result: Teams 280M users, Slack acquired at depressed valuation. Cannibalization strategy destroyed standalone competitor
Technology Platform Transition
Migrate customers to new platform even if cannibalizes legacy revenue. Delays = competitor captures next-gen market, you're stuck with shrinking legacy base
Adobe Creative Cloud: Perpetual licenses ($1,299 Photoshop, high margin) ? subscription ($10/month). Cannibalized upfront revenue. But subscription model: (1) Lowers switching costs (competitors charge $0-50), (2) Ensures continuous updates (stays ahead of Figma/Canva), (3) Recurring revenue (predictable vs. lumpy license sales). Short-term pain (revenue recognition delay), long-term gain (95% market share defended, $19B ARR in 2024)
Executive Decision Rule: Cannibalization is inevitable—only question is WHO does it. If you don't launch lower-margin alternative, competitor will. Better scenario: you cannibalize yourself (keep customer relationship, transition revenue) vs. competitor does it (you lose customer AND revenue). Litmus test: "If we were a startup, would we attack our core business this way?" If yes, do it before startup does. Amazon's Bezos: "We want to be the ones to kill our own business, not someone else."
Problem: Platforms have fundamentally different economics than linear businesses (pipelines). Traditional strategy (optimize margins, control supply chain, own customer) fails. Platform strategy requires: subsidizing one side, solving chicken-egg problem, managing multihoming, defending against envelopment.
Solution Framework: Platform-specific playbook for launch, growth, and defense.
Platform Challenge
Strategic Approach
Execution Tactics
Success Metrics
Two-Sided Market Balance
Optimize for BOTH sides simultaneously. Imbalance kills platform (too many sellers without buyers = ghost town, too many buyers without sellers = poor experience)
Supply-demand ratio (target 1:3 to 1:5), wait times (<5 min), fill rate (>80% buyer requests matched), both-side NPS (>40 each)
Chicken-Egg Cold Start
Need both sides for value, but neither joins without the other. Solve through: vertical integration (own one side), subsidies (pay for participation), marquee users (attract high-value participants), or fake it (simulate missing side)
OpenTable strategy: Sold reservation software to restaurants ($1,200 upfront) = standalone value BEFORE connecting diners. Built supply (60,000 restaurants), THEN launched consumer app (diners came because supply existed). Avoided chicken-egg by vertically integrating restaurant side first. Alternative: Uber strategy: guaranteed driver earnings in new cities (even without rides) to ensure supply when riders arrived
Time to liquidity (30-90 days target from launch to critical mass), burn rate (subsidies sustainable?), conversion from single-sided to two-sided usage
Multihoming Defense
When switching costs low, supply multihomes (drivers on Uber AND Lyft, restaurants on DoorDash AND Uber Eats). Network effects weakened—can't lock in supply. Must compete on price/quality perpetually
Reduce multihoming: (1) Exclusive incentives (Amazon: lower fees for Brand Registry exclusivity), (2) Volume rewards (DoorDash DashPass: guaranteed orders for exclusive partners), (3) Data/tools lock-in (Shopify: once store built, switching costs high). Alternative: Accept multihoming, focus on consumer lock-in instead (if supply commoditized, differentiate on demand side)
Exclusivity rate (% supply single-homed), share-of-wallet (orders per restaurant across platforms—target >50%), consumer retention (compensate for supply churn)
Platform Envelopment Defense
Incumbent platform bundles your feature free (cross-subsidized by main business). You can't match price (no subsidy source). Example: Microsoft Teams free with Office 365 killed Slack's $8/user pricing
Defense strategies: (1) Multi-platform (Spotify on iPhone+Android+Web—harder for Apple Music to envelop), (2) Enterprise lock-in (Slack's deep integrations, workflows—Teams \"good enough\" but not best-in-class for power users), (3) Rapid innovation (stay 2-3 years ahead on features—enveloper struggles to keep pace while managing core business), (4) Regulatory (antitrust claims—Spotify vs. Apple 30% tax lawsuit)
Feature gap vs. enveloper (maintain 2× advantage), enterprise NPS (>50 = lock-in defensible), churn to bundled alternative (<10% acceptable, >20% existential)
Executive Decision Rule: Platform economics require patient capital and tolerance for early losses. Uber lost $1-3/ride for years to achieve network density. Subsidies ROI measured in years (LTV), not quarters (CAC payback). Board/investors must accept: (1) Negative margins during growth phase (subsidizing harder-to-acquire side), (2) High burn rate (geographic expansion = relaunching chicken-egg each market), (3) Winner-take-most outcome uncertainty (platform leadership = high value, #2-3 position = low value). Don't launch platform without 3-5 year capital commitment and stomach for losses.
Layer 4: Data Network Effects & Winner-Take-Most Moats
Problem: Traditional moats (brand, patents, scale) are weakenings in digital economy. Data network effects create new moat: more users ? more data ? better product ? more users (virtuous cycle). Leader's advantage compounds—Google Search, Waze navigation, Netflix recommendations improve faster than rivals because 10× more data.
Solution Framework: Build data flywheels intentionally, race to data scale before competitors.
Data Flywheel Component
Design Principles
Implementation
1. Data Generation
Product usage must generate training data that improves product. Not all data valuable—focus on data that directly enhances core value prop
Google Search: Every query + click + dwell time = training signal for ranking algorithm. 8.5B searches/day = 8.5B data points. Bing (1B/day) improves 8× slower despite equivalent engineering talent. Waze: Driving generates real-time traffic data ? better routes ? attracts more drivers ? more traffic data. Tesla: 1M+ cars collect autonomous driving data ? better self-driving model ? selling point for new buyers
2. ML/AI Application
Use data to improve product visibly and frequently. Users must perceive improvement (confirms value of sharing data, encourages continued use)
Netflix recommendations: Viewing data ? better suggestions ? higher engagement ? more viewing data. 80% of views from recommendations (2024)—algorithm drives discovery. Spotify Discover Weekly: Listening data ? personalized playlists ? users discover niche artists ? more engagement ? richer taste profiles. Users explicitly attribute value to ML-driven features
3. Competitive Moat Width
Data advantage must be defensible—proprietary (unique to your product), high-velocity (updating constantly), and compound-improving (more data = exponentially better, not linearly)
Proprietary data: Amazon purchase behavior (can't replicate elsewhere), LinkedIn professional graph (unique social network). High-velocity: Google Search updates hourly (static web index = obsolete), Waze traffic refreshes every 30 seconds. Compound improvement: Early Google Search quality gap = 20% better than competitors. After 10 years 10× more data ? 200% better (exponential widening, not linear)
4. Network Effects Amplification
Combine data network effects WITH traditional network effects (social, marketplace, platform). Creates multi-dimensional moat—user value increases from both network size AND data quality
LinkedIn: More professionals join (network effect) ? more profile/job data (data network effect) ? better job matching algorithm ? attracts more users. Dual flywheel. Uber: More riders (demand) + more drivers (supply) = network effect PLUS more trip data ? better ETA/pricing algorithms = data network effect. Compound moats
When Data Network Effects DON'T Apply:
Scenario
Why Data Doesn't Help
Example
Data Doesn't Improve Core Value
Product value = non-data attributes (speed, price, convenience). More users ? better product
E-commerce delivery: Amazon's purchase data doesn't make shipping faster. Uber's ride data doesn't increase driver availability (supply constraint, not data problem). Food delivery: DoorDash data doesn't improve restaurant food quality
Data Plateaus Quickly
After initial training data, marginal value of new data ? 0. Common in mature ML domains where models saturated
Email spam filters: Gmail spam detection 99.9% accurate with 100M emails. Going to 1B emails ? 99.92%. Diminishing returns—no moat from extra data. Image recognition: Model accuracy peaks at 10M labeled images, additional data adds <0.1% improvement
Data Widely Available
Training data commoditized (public datasets, purchased, scraped). No proprietary advantage from data scale
Large Language Models (LLMs): All trained on public internet data (Common Crawl, Wikipedia, Reddit). OpenAI ChatGPT vs. Google Gemini vs. Anthropic Claude trained on similar datasets. Differentiation = architecture/compute, not data. Competitor can replicate data easily
Executive Decision Rule: Audit whether your product has data network effects potential. Ask: (1) Does usage generate proprietary data? (2) Does that data directly improve core value prop? (3) Do improvements compound (more data = exponentially better)? (4) Is data refresh rate high (real-time > daily > static)? If yes to all 4 ? race to data scale (subsidize growth, acquire users fast, invest in ML infrastructure). If no ? data won't be moat, focus on other defensibility (brand, switching costs, operational excellence). Don't assume \"AI strategy\" = competitive advantage without proven data flywheel.
Integrated Case Study: Amazon's Innovation & Platform Mastery
How Amazon Applied All 11 Laws to Build $2 Trillion Empire
Integrated StrategyMulti-Law Application
Layer 1 - Technology Trajectory Management:
Moore's Law (Cloud Computing): Bezos saw computing deflation curve—AWS pricing drops 50% every 3 years while performance doubles. Built elastic cloud infrastructure (2006), rode Moore's Law to $80B+ annual AWS revenue (2024). On-premise competitors (Oracle, IBM) stuck with linear pricing, couldn't match exponential cost improvement
Experience Curve (Fulfillment): 1997: 2 warehouses, $150/package cost. 2024: 1,000+ fulfillment centers, $3/package (50× improvement from learning curve). Invested heavily in logistics automation, robotics (Kiva acquisition 2012), route optimization. Competitors can't match unit economics—10-20 year experience gap insurmountable
S-Curve Transition (Retail ? Digital): Physical retail S-curve saturated (mall growth peaked 1990s). Bezos bet on digital commerce S-curve (1994 launch). Traditional retailers waited until inflection point (2005-2010), by then Amazon 15 years ahead on technology curve. Borders, Circuit City, Tower Records—extinct. Walmart survived only through massive digital investment (2015+), still trails Amazon 2:1 in e-commerce
Layer 2 - Innovation Portfolio & Cannibalization:
Disruptive Innovation (AWS): 2006: Amazon's core business = e-commerce. AWS = disruptive bet on cloud infrastructure (adjacent to retail, initially low-margin, uncertain market size). Traditional strategy: focus on retail margin expansion. Bezos allocated 10% resources to AWS despite no retail synergy. Result: AWS = 60%+ of Amazon operating profit (2024), higher margin than retail ever achieved. Classic innovator's dilemma solved through portfolio approach
Cannibalization (Marketplace): Amazon Marketplace (2000) cannibalized Amazon's first-party retail sales—merchants sell same products, Amazon earns lower commission vs. retail margin. But preserved customer relationship (customers stayed on Amazon.com), prevented eBay from capturing e-commerce growth. By 2024: 3rd-party sales = 60% of units sold. Better to cannibalize yourself than lose customer
Innovator's Dilemma Defense (Prime Video): 2011: Netflix dominates streaming. Amazon launches Prime Video—bundled free with Prime shipping ($139/year). Cannibalizes potential standalone streaming revenue. But Netflix risk: if consumers choose Netflix over Amazon (attention/wallet share), Amazon loses core retail relationship. Prime Video = defensive cannibalization. Outcome: Prime members spend $1,400/year vs. non-Prime $600/year. Streaming bundle = retention tool, not revenue center
Layer 3 - Platform Economics:
Two-Sided Markets (Marketplace Pricing): Merchants pay 15% commission (value-capturing side—need Amazon's 300M customers). Consumers pay $0 listing fees (price-sensitive side—would use eBay/Walmart if charged). Asymmetric pricing: extract from inelastic side (sellers), subsidize elastic side (buyers). Optimizes total platform GMV
Chicken-Egg Solution (Marketplace Launch): 2000 problem: need merchants for product selection, need customers for merchant revenue. Amazon's solution: vertical integration first (own inventory, sell direct), then platformize (invite merchants to list alongside Amazon products). Merchants joined because customer base already existed (200M visitors/month). Avoided chicken-egg by building one side (demand) before connecting to other side (supply)
Multihoming Defense (Brand Registry): Merchants multihome (list on Amazon, eBay, Shopify, Walmart simultaneously). Amazon's response: Brand Registry program—merchants who list exclusively get lower fees (10% vs. 15%), brand protection, advertising tools. Creates incentive for single-homing. If merchant multihomes anyway, Amazon competes on consumer lock-in (Prime members rarely price-shop across platforms)
Platform Envelopment (Amazon Basics): Amazon Basics = private label products targeting best-selling categories (phone cables, batteries, etc.). Uses marketplace data to identify high-volume, high-margin categories ? launch Basics SKU ? rank prominently in search ? take market share. Envelopment strategy: Amazon owns distribution (search algorithm), bundles own products with platform access. Merchant can't escape—needs Amazon's traffic even if competing with Amazon Basics. Platform envelopment of own marketplace participants (controversial but effective)
Layer 4 - Data Network Effects:
Recommendation Engine: 300M+ customers generate 10B+ purchase/browse/search events annually. Data trains recommendation algorithm ? "Customers who bought X also bought Y" drives 35% of sales (2024). Walmart has similar selection but 1/10th the data—recommendations weaker, conversion lower. Amazon's data advantage = 15-year head start, compounds annually
Supply Chain Optimization: Predictive analytics: "Customer in Seattle searched for camping gear ? pre-position inventory at Seattle fulfillment center (anticipatory shipping)." Data network effect: more customers ? better demand forecasts ? lower fulfillment costs ? lower prices ? more customers. Walmart tried to replicate (2018+) but lacks data depth—Amazon's decade of behavioral data irreplicable
Key Lesson for Executives: Laws interact and compound. Moore's Law + Experience Curve = unbeatable cost structure. Cannibalization + Platform Economics = market leadership preservation. Data Network Effects + Two-Sided Markets = virtuous cycle lock-in. Don't apply laws in isolation—design integrated innovation system that leverages multiple dynamics simultaneously. Amazon's success = holistic application of technological, innovation, platform, and data laws across 30-year arc.
7 Common Executive Mistakes in Digital Transformation
Mistake
Why It Fails
Correction
1. Linear Thinking in Exponential World
Plan IT budgets, roadmaps, competitor strategy assuming linear improvement (5-10% annual). Reality: Moore's Law = 2× every 18 months (exponential). Result: underestimate cloud deflation (AWS 50% cheaper every 3 years), AI capability improvement (GPT-2?GPT-4: 100× in 4 years), data storage costs (S3: 99% cheaper 2006-2024). Strategies obsolete within 24 months
Use exponential forecasting for technology roadmaps. Ask: "If computing/storage/bandwidth is 10× cheaper and 10× faster in 5 years, what becomes possible?" Amazon 2006: AWS seemed economically infeasible (data centers expensive). 2024: AWS $80B revenue because Moore's Law made cloud 50× more efficient. Build strategies around exponential curves, not current constraints
Allocate 100% resources to core business optimization (serve best customers, maximize margins). Rational short-term, fatal long-term. Disruptive alternatives emerge at low-end (inferior performance, lower price), gradually improve, eventually overtake. By time incumbent responds, disruptor has 5-10 year lead. Nokia smartphones, Blockbuster streaming, Kodak digital, BlackBerry touchscreens—all saw disruption coming, couldn't abandon profitable core business until too late
Institutionalize 70-20-10 portfolio: 70% core, 20% adjacent, 10% transformational. Protect transformational bets from quarterly earnings pressures—separate P&L, long-term metrics, skunkworks independence. Amazon: AWS unprofitable 2006-2014 (8 years), would've been killed if evaluated on core retail ROI standards. Survived because Bezos ring-fenced it. Google: 10% time, X Labs—institutionalized permission to work on non-core projects
3. Fear of Cannibalization
Refuse to launch products/services that reduce sales of profitable lines. Logic: "Why introduce $10/month subscription when we sell $1,000 perpetual licenses?" Result: competitor launches subscription, takes market share, incumbent loses both license revenue AND customer relationship. Adobe resisted Creative Cloud (2010-2013), feared cannibalizing $1,299 Photoshop sales. Delay allowed Sketch, Figma to gain traction. By 2013, forced to transition anyway—but from weaker position
Assume cannibalization is inevitable—only question is who does it. Bezos: "If we don't cannibalize ourselves, someone else will." Launch cannibalizing alternative proactively: (1) Preserve customer relationship (they stay with you, not competitor), (2) Transition revenue stream (low-margin subscription > $0 if customer leaves), (3) Learn new business model (SaaS, freemium) before forced to. Apple: iPhone cannibalized iPod ($9B revenue peak). But preserved music customer, prevented Spotify from owning portable music category. Cannibalization = strategic defense
Launch two-sided platform without solving cold start. Announce marketplace, wait for both sides to show up organically. Neither side joins (buyers: no sellers, sellers: no buyers). Platform dies within 6-12 months with <5% liquidity. Quibi (2020): launched streaming platform, expected creators and viewers to join simultaneously—died in 6 months, $1.75B loss. Google+ (2011): social network, needed users for content—died despite Google's brand
Pick ONE chicken-egg solution and commit capital: (1) Subsidies: Uber guaranteed driver earnings in new cities ($1,000+/week even without rides), ensured supply when riders arrived. (2) Vertical integration: OpenTable sold software to restaurants first (standalone value), then launched consumer app. (3) Marquee users: Clubhouse invited celebrities (Elon Musk, Oprah)—everyone else followed. (4) Fake it: Reddit founders created fake users/posts to simulate activity. Requires 6-18 months burn rate tolerance—no revenue during cold start phase
5. Ignoring S-Curve Transitions
Invest in mature technology past inflection point (diminishing returns set in). Hard drives: hit 4TB/platter density limit (2015), continued investing in HDD R&D while SSDs gained market share. Intel CPUs: 14nm process stuck 2014-2020 (Moore's Law slowing), continued incremental improvements while ARM chips (mobile, Apple M1) disrupted laptop market. S-curve maturity signals: R&D spending ? but performance gains ?, alternative technologies emerging, customer complaints about lack of innovation
Technology radar with 3 zones: (1) Milk it (mature S-curve): optimize costs, extend product life, don't over-invest in R&D (diminishing returns). (2) Hedge (inflection zone): pilot alternatives, prepare transition, maintain optionality. (3) Transition (new S-curve): aggressive investment, cannibalize legacy, race to leadership on next curve. Apple: Mac/iPod peaked (2007), transitioned to iPhone aggressively—cannibalized iPod, redirected R&D to mobile. Result: iPhone = 50% of revenue (2024), Mac = 10%. Transition timing = strategic skill
6. Platform Envelopment Blindness
Build standalone product in niche (workplace chat, project management, CRM). Ignore platform adjacency risk. Platform incumbent (Microsoft, Google, Salesforce) bundles your feature free (cross-subsidized by core business). You can't match $0 price—no subsidy source. Slack $8/user vs. Teams $0 (Office 365 bundle), Zoom $15/user vs. Google Meet $0 (Gmail bundle), Trello $10/user vs. Asana/Monday.com $0 trials. Standalone pricing unsustainable when platform offers "good enough" for free
Defense strategies: (1) Multi-platform: Integrate everywhere (Zoom on Teams, Slack, Google Meet)—reduces envelopment angle. (2) Enterprise lock-in: Build workflows/integrations platforms can't replicate quickly—Slack's 2,500+ integrations vs. Teams' 500. (3) Niche dominance: Serve power users platform ignores—Figma for designers (Adobe too general), Notion for knowledge workers (Google Docs too simple). (4) Exit timing: Sell before envelopment destroys valuation—Slack sold $28B (2021) vs. potential $50B IPO, but Teams growing fast (correct to sell before margin compression)
7. Data Strategy Without Data Network Effects
Proclaim \"AI-first strategy\" and \"data-driven culture\" without validating whether data improves core product. Collect data (customer demographics, purchase history, usage logs), build dashboards, hire data scientists—but product value unchanged. E-commerce: more purchase data doesn't make shipping faster. SaaS: usage analytics don't improve software features (engineering does). Healthcare: patient records don't improve drug efficacy (clinical trials do). Data collection ? data network effects
Apply 4-part data network effects test: (1) Proprietary: Is data unique to your product or publicly available? (2) Core value: Does data DIRECTLY improve main value prop (search results, recommendations, navigation)? (3) Compound improvement: Does 10× more data = 10× better product (exponential) or 1.1× better (linear/plateau)? (4) High velocity: Does data refresh real-time/daily (valuable) or static (commodity)? Pass all 4 ? invest heavily in ML infrastructure, subsidize user growth for data scale. Fail any test ? data won't be moat, focus on operational excellence, brand, switching costs instead. Don't waste AI budget on data with no network effects
Final Executive Guidance: Innovation and platform economics demand different mental models than industrial-era strategy. Technology improves exponentially (not linearly), disruption comes from below (not above), platforms win through network effects (not product quality alone), and data creates compounding moats (not diminishing returns). Companies that master these dynamics (Amazon, Apple, Google, Microsoft, Meta) achieve 40-60%+ operating margins and $1-2T valuations. Those that don't (Nokia, BlackBerry, Blockbuster, Kodak, Yahoo) shrink from market leaders to footnotes within 5-10 years. The gap isn't talent or resources—it's strategic framework. Apply the 11 laws systematically, compound their interactions, and institutionalize innovation portfolio discipline. Digital transformation isn't technology adoption—it's business model reinvention guided by exponential economics.
Team Applications: Product, Strategy & Engineering
Innovation and platform economics principles translate differently across functions. Product teams design for data network effects and habit formation. Strategy teams time S-curve transitions and manage cannibalization risk. R&D teams balance sustaining vs. disruptive innovation portfolios. Platform teams solve chicken-egg problems and multihoming dynamics. Engineering teams architect for exponential scale (Moore's Law). This section provides function-specific playbooks for applying the 11 laws.
Product Team: Building Platforms & Network Effects
Core Mandate: Design products that create network effects, generate valuable data, and achieve platform economics—not just ship features. Product-market fit in digital era = winner-take-most dynamics (network effects, data moats) or commoditization.
1. Data Network Effects Engineering (Laws: Data Network Effects, Moore's Law)
Framework: Build data flywheels into core product architecture from day 1
Flywheel Stage
Product Design
Success Metrics
Data Generation
Usage creates training data. Waze: driving generates traffic data. Spotify: listening reveals preferences. Google Search: clicks signal result quality. Design core workflow to maximize data capture (not just functionality)
Events logged per user session (target 50+ for ML training), data completeness (% fields populated), data uniqueness (proprietary vs. public)
ML Application
Data improves product visibly. Netflix recommendations drive 80% of views. LinkedIn job matching uses profile/network data. Product teams must close loop: data ? algorithm ? better UX ? more usage ? more data
ML-driven feature adoption (% users using recommendations, search, personalization), A/B test lift from ML improvements (target 5-15% engagement increase)
Defensibility
Compound improvement—leader gets better faster than followers because more data. Google Search 2004 vs. 2024: 1000× more queries ? exponentially better results. Bing can't catch up despite equal engineering talent
Quality gap vs. competitors (measured via blind tests, NPS), data scale advantage (10× more events = target moat), improvement velocity (quality gain per 1M new users)
Tactical Application: Audit every feature for data generation potential. Spotify "Discover Weekly" generates listening data (what users like) AND social data (sharing behavior). Dual data streams ? better recommendations + viral growth. Dropbox file sharing generates usage data (collaboration patterns) AND network data (who works with whom). Product managers should ask: "What data does this feature create, and how does it improve the product?"
Build single-player mode first (standalone value before network). LinkedIn: profile = resume (useful alone). As connections added, value increases. But initial value ? zero
Pinterest: save images for yourself (personal catalog) before social sharing. Notion: personal knowledge base before team collaboration. Figma: design tool before multiplayer. All provide solo value, network amplifies
Supply-Demand Balance
Product features that maintain equilibrium. Uber surge pricing (dynamic supply/demand matching). Airbnb Smart Pricing (algorithmic host pricing suggestions). Prevent imbalances (too many sellers = low sales, too many buyers = poor experience)
DoorDash: restaurant waitlist when demand exceeds supply. eBay: auction format clears market. Amazon Marketplace: algorithmic search ranking ensures top sellers get visibility (prevents ghost town for low-volume merchants)
Multihoming Prevention
Switching costs through data/workflow lock-in. Shopify: customizations, plugins, customer data migrate poorly. Merchant multihomes (also on Amazon) but Shopify = system of record (primary platform)
Product Differentiation Against Bundled Competitors:
Defense Strategy
Product Tactics
When to Use
Power User Features
Build 10× better product for specific niche. Slack: 2,500+ integrations, threading, search, bots vs. Teams' 500 integrations. Bundled option "good enough" for casual users, insufficient for power users
When platform envelopment threat = general purpose tool (Office 365, Google Workspace). Niche deeply, serve underserved segment platform ignores
Multi-Platform Strategy
Integrate everywhere—Zoom on Teams, Slack, Google Meet. Spotify on iPhone, Android, Alexa, Tesla. Reduces envelopment angle (harder to bundle if you're already integrated)
When you have horizontal use case (communication, file storage, calendar). Don't let platform own entire workflow—embed yourself in their ecosystem
API-First Architecture
Expose APIs before UI (Twilio, Stripe, Plaid). Developers build on your platform, creating switching costs (code dependencies). Platform envelopment requires rewriting all integrations
B2B SaaS with technical users. API lock-in stronger than UI lock-in—code harder to migrate than clicking buttons
Cannibalization Decision Framework: Should product team build feature that cannibalizes existing revenue? Yes if: (1) Competitor will build it anyway (cannibalize yourself vs. lose customer), (2) Customer retention > margin preservation (keep user at lower price vs. lose user entirely), (3) New feature enables platform expansion (Amazon Marketplace cannibalized retail but enabled infinite selection). No if: (1) Cannibalization purely internal (no competitive threat), (2) New feature has worse unit economics AND no strategic benefit, (3) Customer willing to pay for both (upsell opportunity, not substitution).
Core Mandate: Time S-curve transitions, manage innovation portfolios (sustaining vs. disruptive), and defend against platform envelopment—not just competitive positioning in static markets.
15-20% resources. Small bets on alternatives, partnerships, acquisitions. Maintain optionality before S-curve plateaus
Performance improvements <10% annually for 2+ years, alternative tech hitting 70% price-performance parity, early adopter defections
Transition (Next S-Curve)
Aggressive migration. Apple 2020: M1 chips (ARM architecture) replace Intel CPUs in Macs. Cannibalized Intel partnership (15 years), bet on new S-curve (ARM mobile efficiency + desktop performance)
50-70% resources shifted to new curve. Accept short-term cannibalization for long-term positioning. Transition before market forces you (Nokia waited too long on smartphones)
Alternative tech exceeds incumbent on key metric (ARM: battery life + performance), cost parity achieved (TSMC 5nm = Intel 14nm price), ecosystem tipping (developers prioritize new platform)
Quarterly S-Curve Audit Process: (1) Map current technology trajectories (performance improvement rate, R&D efficiency), (2) Identify inflection points (where diminishing returns set in), (3) Scout alternative S-curves (emerging tech with 10× potential), (4) Allocate resources based on stage (milk growth, hedge maturity, transition to next curve). Output: technology roadmap with 3-5 year horizon, transition triggers (when to shift investment), portfolio allocation (sustaining vs. disruptive R&D).
Related innovation: new segments, geographies, use cases. Moderate risk, 2-3 year payback. Example: Google Cloud (adjacent to Search infrastructure), YouTube (video search), Android (mobile search)
Separate business units with P&L autonomy. 3-5 year horizon, allow losses initially. CEO-level oversight (not CFO). Success = user growth, engagement, ecosystem expansion
3-5 years: User growth (30%+ CAGR), engagement metrics (DAU, time spent), path to profitability visible. Accept losses if strategic value high (Android: $0 revenue, but protects Search from Apple)
Transformational Bets (10%)
Disruptive innovation: attacks own business OR creates new market. High failure rate tolerated. Example: Google Fiber (ISP disruption), Waymo (autonomous vehicles), Google Glass (AR/VR). Most fail—portfolio approach accepts casualties
Skunkworks / Alphabet "Other Bets" model. Isolated from core metrics, no revenue targets 5+ years. Board-level oversight, option to shut down without political cost. Success = technical milestones, market validation, strategic optionality
5-10 years: Technical feasibility proven, early adopter traction (10K+ users), unit economics path (even if currently negative). Valuation = option value, not DCF. Expected value = (10% success probability) × ($10B+ outcome) = $1B option value
Common Strategy Mistake—Applying Core Metrics to Transformational Bets: Disruptive innovations don't meet core business hurdle rates (IRR, payback period, margin targets). Example: AWS 2006-2014 lost money for 8 years—would've been killed by standard ROI analysis. But strategic value: cloud infrastructure platform, $80B annual revenue (2024), 60%+ operating margin. Strategy teams must protect transformational bets from quarterly earnings pressure—separate governance, long-term metrics, patient capital.
Can't compete on price (platform subsidizes feature). Must differentiate on: (1) Niche depth (serve power users platform ignores), (2) Multi-platform (reduce dependency on single ecosystem), (3) Enterprise lock-in (workflows platform can't replicate). If inevitable, sell before valuation collapses
Slack vs. Teams: Initially fought (deeper features, integrations), eventually sold to Salesforce $28B (2021). Correct decision—Teams growing 3× faster, Slack valuation would've dropped to $15B within 2 years. Exit timing = strategic skill
Food delivery: All platforms have same restaurants (multihoming). DoorDash differentiates on consumer side: DashPass subscription ($10/month), fastest delivery (optimized logistics), largest selection (most restaurants despite multihoming). Consumer lock-in compensates for supply commoditization
Winner-Take-Most Race
When network effects strong (social, marketplace, platform), #1 captures 60-80% market share, #2-3 fight for scraps. Strategy: race to scale aggressively (burn capital for growth), subsidize hard-to-acquire side, expand geographically before competitors. Profitability delayed until dominance achieved
Uber vs. Lyft: Uber burned $20B+ (2010-2020) to achieve global scale (10,000+ cities). Lyft stayed US-only, preserved capital. Result: Uber $150B valuation (2024), Lyft $12B. Winner-take-most dynamics = scale advantage worth burn rate. Lyft's capital efficiency = strategic mistake in platform market
Platform vs. Pipeline Decision Framework: When to build platform (two-sided market) vs. linear business (pipeline)? Platform if: (1) Value creation = matching/facilitating transactions (not direct service delivery), (2) Network effects possible (more supply ? attracts demand ? attracts more supply), (3) Marginal costs near zero (digital goods, software), (4) Willing to accept 5-10 year losses for scale. Pipeline if: (1) Asset-heavy (manufacturing, logistics), (2) No network effects (value = operational excellence, not network size), (3) Profitability required within 2-3 years. Tesla: chose pipeline (manufacture cars) not platform (facilitate car sharing) because EVs = hardware-intensive, long development cycles, capital requirements. Uber: chose platform because rides = matching problem (connect riders to drivers), not operational problem (own vehicle fleet).
R&D Team: Balancing Sustaining vs. Disruptive Innovation
Core Mandate: Allocate R&D resources between core business optimization (sustaining innovation) and future business creation (disruptive innovation)—not just technical feasibility studies.
$50-500K each. Total $25M. Small bets, many experiments. Example: Google X "moonshot factory" (100+ projects in early R&D)
Technical feasibility (does physics/chemistry/software work?), market size potential (TAM >$1B), differentiation (unique IP or 10× better than alternatives)
Advance 20% to Prototype (10 projects). Kill 80% fast (poor feasibility, small market, copyable by incumbents). Fail fast culture = capital efficiency
Prototype (10 projects)
$1-5M each. Total $30M. Working prototype, alpha customers. Example: Amazon hardware lab (Kindle, Echo, Ring pre-launch)
Product-market fit signals (customers willing to pay? engagement high?), unit economics path (margins achievable at scale?), competitive response time (how fast can incumbents copy?)
Advance 30% to Pilot (3 projects). Kill 70% (poor PMF, bad economics, easy to replicate). Phase-gated investment = real options—only fund winners
Pilot (3 projects)
$10-50M each. Total $90M. Limited commercial launch, 10K+ users. Example: Google Fiber (Kansas City 2012), Waymo (Phoenix 2018)
Retention (>40% monthly), NPS (>30), CAC payback (<24 months), operational scalability (can we 10× without breaking?). Real market validation, not lab results
Advance 1-2 to Scale ($100M+ investment). Others: maintain as options (revisit if market shifts) or shut down. Total R&D pipeline: $25M discovery + $30M prototype + $90M pilot = $145M. 1-2 breakthroughs justify entire budget
Your product exceeds customer needs (Ferrari when they need Camry). Customers pay for features they don't use. Disruptor enters with "good enough" product at 50% price
Survey customers: "Would you pay less for fewer features?" If >30% say yes, market ready for low-end disruption. Launch fighter brand (Canon vs. Nikon strategy) or risk losing to startup
New Market Foothold
Startup serves non-consumers (people who couldn't use existing products due to cost, complexity, access). Example: Uber (non-taxi users—too expensive, inconvenient), Airbnb (non-hotel users—budget travelers, long stays)
Don't dismiss as "not our customer." Today's non-consumer = tomorrow's mainstream. Netflix started with non-Blockbuster users (mail-order DVDs for rural customers). Expanded upmarket, displaced Blockbuster. R&D should pilot low-end offerings targeting non-consumers
Technology Trajectory Crossover
Inferior technology improving faster than your sustaining curve. Hard drives: 100% annual density improvement (1990-2005), then 10% (2005-2015). SSDs: 50% annual improvement (2010-2020), crossing over on price/performance
Plot improvement rates: current tech vs. alternatives. If alternative improving 3-5× faster, will crossover within 3-5 years. Intel CPUs vs. ARM: x86 slowing (5-10% gains), ARM accelerating (30% gains from mobile investment). R&D hedged with ARM server chips (2018+)
Practical R&D Exercise—Disrupt Yourself: Quarterly exercise: "If we were a startup with $10M funding, how would we attack our core business?" Constraints: (1) Can't use our brand/distribution/sales force, (2) Must achieve profitability within 3 years, (3) Must target our customers (not different segment). Output: 3-5 disruption vectors. Pick most credible threat, launch internal skunkworks to build it before external startup does. Amazon: launched Prime (2005) to disrupt own e-commerce (free 2-day shipping cannibalized expedited shipping revenue). Better to cannibalize yourself than let competitor do it.
Platform Team: Two-Sided Market Operations
Core Mandate: Balance supply and demand dynamically, solve chicken-egg cold starts in new markets, and prevent multihoming through exclusivity incentives—not just marketplace operations.
Fill rate (% buyer requests matched, target >80%), wait time (minutes to match, <5 min ideal), seller earnings ($ per hour, must exceed minimum wage + 30% for sustainability)
Excess Supply (Sellers > Buyers)
Increase demand: (1) Lower buyer prices (discounts, promotions, free trials), (2) Marketing spend (CAC justified if LTV positive), (3) Reduce seller onboarding (pause recruitment, increase approval standards). DoorDash: too many restaurants ? pause new merchant signups, focus on consumer growth
Seller utilization (% time active, target 50%+), earnings per seller (must beat alternative income source), churn rate (sellers leaving due to low volume, <10% monthly)
Geographic Density Challenges
Liquidity varies by market. Urban = high density (NY, SF), rural = low density (Wyoming, North Dakota). Platform teams must segment: (1) Dense markets: optimize pricing/quality, (2) Sparse markets: subsidize heavily OR exit. Uber: exited 20+ small cities (2019-2020) because couldn't achieve critical mass
Liquidity by geography (matches per hour per market), burn rate by market (subsidy cost), path to profitability (when does market break even?). Exit markets where 5-year breakeven unlikely
Cold Start Playbook for New Markets: (1) Weeks 1-4: Recruit supply first (harder to acquire—drivers, hosts, sellers need income guarantee). Target 100+ active suppliers before launch. (2) Weeks 5-8: Launch demand side (easier—consumers respond to discounts, promotions). Subsidize heavily (50%+ discounts) to achieve initial liquidity. (3) Weeks 9-16: Reduce subsidies gradually as network effects kick in (more supply ? shorter wait times ? more demand ? higher supplier earnings ? more supply). Target 50% supplier utilization by Week 16—indicator of self-sustaining marketplace. (4) Month 6+: Optimize pricing (reduce discounts, increase take rate), expand geographically within metro, replicate playbook in next city.
2. Multihoming Strategy (Laws: Multihoming Costs, Data Network Effects)
Reducing Supply-Side Multihoming:
Tactic
Mechanism
Implementation Example
Exclusive Volume Incentives
Reward suppliers who single-home (only use your platform). Lower commission rates, priority placement, marketing support. Punish multihoming (higher fees, lower visibility)
Amazon Brand Registry: exclusive sellers pay 10% vs. 15% for multihomers. DoorDash DashPass: restaurants in subscription program must prioritize DoorDash orders (exclusivity requirement). Uber Pro: drivers who maintain 85%+ Uber trips get rewards (healthcare, tuition)—disincentivizes Lyft multihoming
Operational Lock-In
Make your platform the "system of record"—suppliers manage inventory, customer relationships, payments through your tools. Switching = rebuilding infrastructure elsewhere (high friction)
Shopify: merchants build entire store (product catalog, customer database, order management). Could also sell on Amazon, but Shopify = primary system, Amazon = distribution channel. Salesforce: CRM houses all customer data, workflows, integrations. Switching to HubSpot = migrating years of data, rebuilding automations
Data-Driven Differentiation
Use proprietary data to provide better outcomes than competitors. Suppliers single-home because your platform generates more sales/earnings (data network effects ? better matching/recommendations)
Airbnb Smart Pricing: hosts who use algorithmic pricing earn 20% more than manual pricing. Data advantage (10 years of booking data) ? better pricing model ? higher host earnings ? hosts prioritize Airbnb over Vrbo. LinkedIn Recruiter: better candidate matching (900M profile data) ? recruiters pay $120/month vs. Indeed $50/month despite multihoming
When to Accept Multihoming: Food delivery, ridesharing, freelance marketplaces = high multihoming (supply commoditized). Platform teams should accept reality, compete on: (1) Consumer lock-in instead (loyalty programs, better UX, faster service), (2) Share-of-wallet (even if multihoming, win 60%+ of supplier's volume through better demand generation), (3) Operational excellence (lower costs, faster payments, better support). DoorDash doesn't prevent restaurant multihoming—competes by delivering fastest (optimized logistics), paying most reliably (weekly vs. monthly), and driving highest order volume (largest consumer base).
Engineering Team: Scalable Architecture for Exponential Growth
Core Mandate: Build systems that scale exponentially (Moore's Law), generate valuable data (network effects), and maintain platform resilience (multihoming, envelopment threats)—not just ship features.
1. Moore's Law Architecture (Laws: Moore's Law, Experience Curve)
Cloud-Native Design for Cost Deflation:
Architecture Decision
Moore's Law Implication
Cost Impact (5-Year Horizon)
Cloud vs. On-Premise
AWS pricing drops 50% every 3 years (Moore's Law + competition). On-premise: locked into 5-year depreciation cycles, can't access cost deflation
Cloud total cost 2026: $10M ? 2031: $2.5M (75% reduction from deflation + efficiency). On-premise: $15M ? 2031: $12M (only 20% reduction from optimization). Cloud 5× cheaper in 5 years
Serverless vs. EC2
Serverless (Lambda, Cloud Functions): pay per execution, scales to zero. EC2: always-on servers, pay for idle capacity. Serverless benefits from Moore's Law directly (execution time decreases, cost per execution decreases)
Serverless: cost per request drops 50% every 3 years (faster CPUs = shorter execution time). EC2: cost per instance drops 30% (pricing reductions only, not utilization gains). Serverless 2× better cost trajectory
Monolith vs. Microservices
Microservices: independent scaling (scale expensive ML services separately from cheap CRUD APIs). Monolith: scale everything together (waste resources). Moore's Law amplifies microservices advantage—cheap compute makes overhead negligible
Microservices: scale only bottlenecks (10% of services consume 90% of resources). Optimize high-cost services, let cheap ones scale freely. 40-60% cost reduction vs. monolith (Netflix savings: $100M+ annually from microservices architecture)
Engineering Principle—Build for Tomorrow's Costs, Not Today's: 2026 GPU compute: $0.50/hour. 2029 GPU compute (projected): $0.10/hour (80% reduction from Moore's Law + AI chip competition). Architectural decisions should assume exponential cost deflation—don't optimize for current constraints (will be obsolete within 3 years). Example: Netflix built entire infrastructure on cloud (2008), seemed expensive vs. data centers. By 2024, cloud 10× cheaper than on-premise equivalents—architecture decision justified by cost trajectory, not day-1 economics.
2. Data Infrastructure for Network Effects (Laws: Data Network Effects, Experience Curve)
More users ? more events ? better models ? better recommendations ? more engagement ? more users. Flywheel starts with comprehensive event logging. Engineers must instrument every interaction
Feature Store (Data Accessibility)
Centralized repository of ML features (user embeddings, item attributes, behavioral signals). Uber Michelangelo, Airbnb Zipline, LinkedIn Pro-ML. Reduces feature engineering from weeks to hours
Faster ML iteration = more experiments = better models. Spotify: 10,000+ ML models in production (playlists, recommendations, ads). Feature store enables rapid experimentation—quality compounds through iteration velocity
A/B Testing Infrastructure
Run 100+ experiments simultaneously. Google: 10,000+ A/B tests annually on Search. Facebook: 1,000+ tests weekly on News Feed. Statistical rigor (p<0.05, 95% CI) automated
A/B testing = evolutionary algorithm for product improvement. More users ? more statistical power ? detect smaller improvements ? compound gains. LinkedIn: 0.1% CTR improvement = $10M annual revenue. Infrastructure finds those micro-optimizations
Data Moat vs. Data Liability: Not all data creates moats. Moat data: improves core product (search queries ? better results, viewing history ? better recommendations, driving patterns ? better routes). Liability data: privacy risk, storage cost, no product improvement (raw logs, PII, obsolete features). Engineering teams should ruthlessly prune liability data (GDPR compliance, cost reduction) while scaling moat data (ML training sets, behavioral signals). Example: Google deletes search logs after 18 months (privacy compliance), but aggregates into ranking signals (preserved indefinitely). Balance privacy/cost with network effects.
Abstract infrastructure (Kubernetes, Terraform). Run on AWS + Azure + GCP. Spotify: runs on Google Cloud but designed for portability (can migrate to AWS in 6-12 months if Google turns hostile)
Prevents platform envelopment by cloud provider. AWS could bundle competing music service with Prime—Spotify's multi-cloud architecture reduces dependence. Negotiating leverage: "We can leave" = better pricing
API-First Design (Integration Ecosystem)
Expose APIs before building UI. Stripe, Twilio, Plaid = API-first. Developers integrate into products (code dependencies = switching costs). Platform envelopment requires rewriting customer code
Developer ecosystem = moat. Stripe: 1M+ developers integrated. Even if Square offers better pricing (platform envelopment attempt), migration cost = rewriting payment flows across entire codebase. API lock-in stronger than UI lock-in
Data Portability (GDPR, Regulatory Defense)
Enable data export (GDPR requirement). But design export format to minimize multihoming (lossy conversions, proprietary schemas). LinkedIn: exports data in JSON (technically compliant) but loses graph structure, recommendations (non-portable)
Satisfy regulators (data portability), preserve moats (export ? useful elsewhere). Facebook exports posts/photos (text/images portable) but not social graph integrity (relationships, Edgerank scores). Exported data useless on competitors' platforms
Engineering Principle—Build Interoperability, Maintain Moats: Integrate with everyone (Zoom on Teams, Slack, Google Meet), but design integration to preserve differentiation. Zoom video quality better than competitors—integrating doesn't commoditize superior codecs, latency optimization, bandwidth efficiency. Engineering maintains technical lead through R&D (AV processing, network protocols), not closed ecosystem. Open integrations increase distribution, technical excellence creates defensibility.
Challenge: Innovation laws span functions. S-curve transitions require Strategy + R&D + Engineering. Platform launches need Product + Platform + Growth. Data network effects need Engineering + Data Science + Product. Siloed execution fails.
Solution—Quarterly Innovation Councils:
Council Focus
Participants
Output
Technology Roadmap
CTO, Head of Strategy, Head of R&D, Engineering Leads
S-curve audit (current tech maturity, transition timing), portfolio allocation (sustaining vs. disruptive R&D), architecture decisions (cloud, ML infrastructure). Deliverable: 3-year technology roadmap with investment priorities
Platform Strategy
Head of Product, Platform Team, Growth, Pricing
Supply-demand balance review, cold start playbooks for new markets, multihoming analysis, pricing optimization. Deliverable: Platform health scorecard (liquidity, utilization, burn rate by geography)
Data & ML
Head of Engineering, Data Science, Product, Privacy/Legal
Data network effects assessment (which data creates moats?), ML roadmap (models to build), privacy compliance (GDPR, CCPA). Deliverable: Data strategy balancing network effects with regulatory risk
Innovation Council Anti-Patterns to Avoid: (1) PowerPoint strategy: Councils produce decks, no execution. Fix: Every council must output resource allocation decisions (budgets, headcount, roadmap priorities), not just recommendations. (2) Consensus paralysis: All functions must agree before acting. Fix: Assign DRI (Directly Responsible Individual)—one executive owns decision, councils advise. Amazon's Jeff Bezos: "Disagree and commit" culture—debate fully, then execute decisively even if not unanimous. (3) Quarterly theater: Councils meet quarterly, ignored between meetings. Fix: Monthly working groups execute council priorities, quarterly councils review progress and adjust strategy.
Final Team Applications Guidance: The 11 innovation and platform laws aren't abstract concepts—they're operational realities shaping daily work across Strategy, R&D, Product, Platform, and Engineering teams. Strategy teams time S-curve transitions and manage innovation portfolios. R&D teams balance sustaining vs. disruptive bets. Product teams design for network effects and platform economics. Platform teams solve chicken-egg problems and balance two-sided markets. Engineering teams build for exponential scale and data moats. Cross-functional coordination through Innovation Councils ensures laws applied holistically, not in silos. Companies that institutionalize these practices (Amazon, Google, Microsoft, Meta) achieve sustained innovation leadership—those that don't (Nokia, BlackBerry, Yahoo) fail despite resources and talent. The difference is systematic application of innovation economics across all teams.
Conclusion & Next Steps
Innovation and platform economics are reshaping competitive advantage in the digital age. Understanding disruptive innovation, platform dynamics, and ecosystem orchestration allows you to navigate technological disruption, build digital moats, and create sustainable competitive positions. But even the strongest platform can fail without skillful negotiation, risk management, and strategic flexibility in uncertain environments.
The next guide explores how to structure deals, manage uncertainty, and build optionality into strategic decisions.