We use cookies to enhance your browsing experience, serve personalized content, and analyze our traffic.
By clicking "Accept All", you consent to our use of cookies. See our
Privacy Policy
for more information.
Core Market Fundamentals: 11 Economic Laws for Pricing & Investment
January 24, 2026Wasil Zafar50 min read
Master the foundational economic principles that drive pricing strategies, demand forecasting, investment decisions, and resource allocation across every business function. Part 1 of our 8-part Economics for Business Strategy series.
Introduction: The Foundation of Business Economics
Every pricing decision, every investment choice, every resource allocation—these fundamental business activities are governed by core economic laws that have shaped markets for centuries. Yet many executives operate on intuition rather than economic principles, missing opportunities to optimize decisions and predict market responses.
This guide explores the 11 most essential economic laws that every business leader must master: from supply-demand dynamics that determine market equilibrium, to price elasticity that predicts customer response, to comparative advantage that guides build-vs-buy decisions. These aren't abstract theories—they're practical frameworks used daily by Amazon (dynamic pricing), Apple (premium positioning), Tesla (vertical integration), and Netflix (subscription economics).
Market Dynamics: How to predict demand shifts, optimize pricing, and forecast revenue using supply-demand equilibrium and elasticity analysis
Investment Decisions: When to invest, when to wait, and how to evaluate opportunity costs across competing projects
Resource Allocation: Where diminishing returns kick in, when to reallocate budgets, and how to maximize marginal productivity
Strategic Positioning: How comparative advantage determines make-vs-buy, outsourcing decisions, and partnership strategies
Risk Management: How to balance risk-return tradeoffs, avoid sunk cost fallacies, and structure flexible decision-making
Let's begin with the most fundamental law in all of economics: supply and demand.
1. Law of Demand & Supply: The Foundation of Pricing
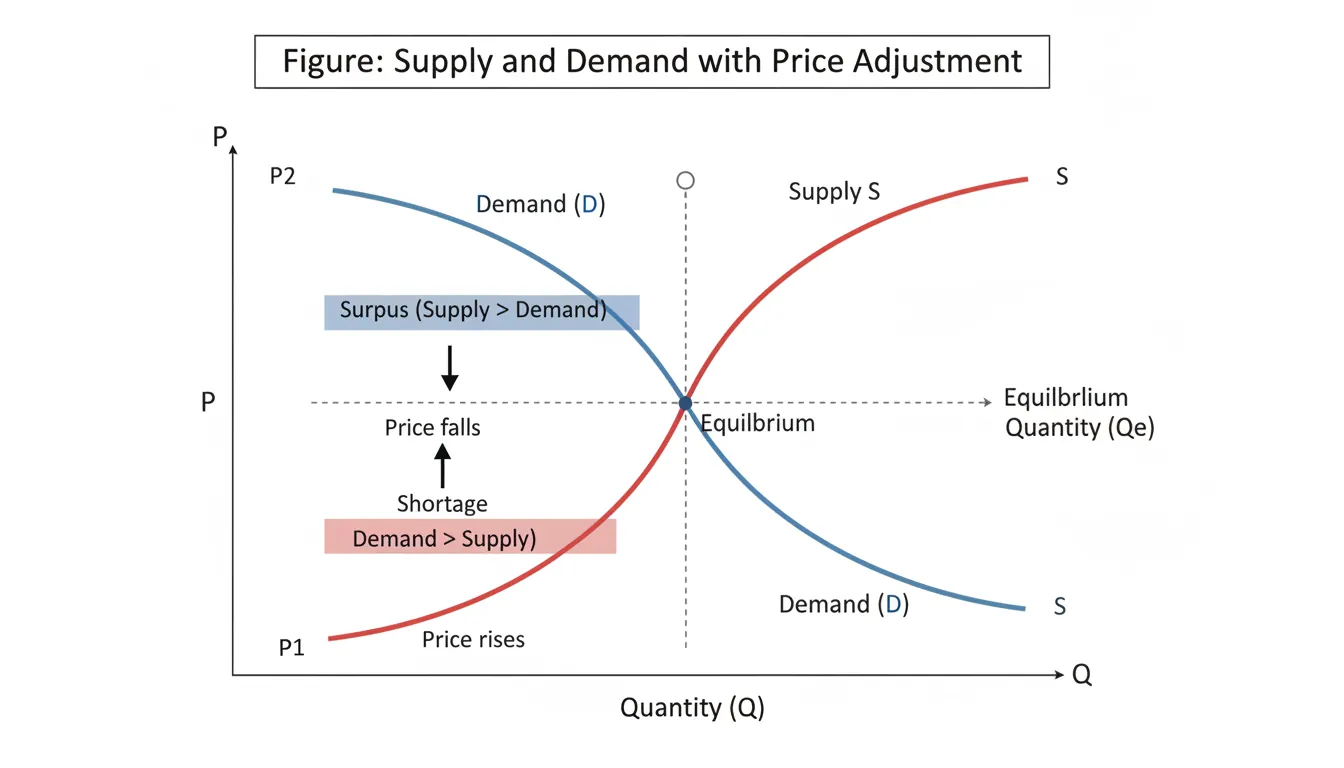
Core Principle: When supply exceeds demand, prices fall. When demand exceeds supply, prices rise. The equilibrium price occurs where supply equals demand.
Figure: Supply and demand curves intersecting at the market equilibrium price, showing how price adjusts when supply exceeds or falls below demand.
Real-World Application: Airline Dynamic Pricing
Case Study
Delta Airlines: Demand-Based Revenue Management
Challenge: Fixed capacity (seats per flight) with fluctuating demand patterns
Strategy: Dynamic pricing based on real-time demand signals:
Low demand periods (Tuesday 2pm): Prices drop 40-60% to fill empty seats
High demand (Friday evening, holidays): Prices surge 200-300%
Advance booking: Lower prices when demand uncertainty is high
Last-minute booking: Premium prices for urgent business travel
Result: Revenue per available seat mile (RASM) increased 15-20% through demand-based pricing algorithms
Demand & SupplyPrice Elasticity
Business Applications
For Product Teams: Use A/B testing to find demand curves—test price points to identify where revenue maximizes (price × quantity). Don't assume lower prices always increase total revenue.
For Marketing Teams: Demand generation shifts the demand curve right (more willing buyers at every price). Focus on creating urgency and scarcity when supply is genuinely limited.
For Finance Teams: Model scenario planning around supply shocks (raw material shortages) and demand shocks (competitor moves, economic downturns). Build pricing flexibility into contracts.
Common Mistake: Ignoring supply constraints when stimulating demand. Marketing campaigns that succeed too well can destroy customer satisfaction if you can't fulfill orders. Amazon's early lesson: Don't promote what you can't ship in 2 days.
Amazon's Supply-Demand Mastery
Strategic Example
Amazon Web Services (AWS): Elastic Supply Model
Innovation: Created infinite supply elasticity through cloud infrastructure
Traditional hosting: Fixed capacity = supply shortages during traffic spikes
AWS auto-scaling: Supply expands/contracts with demand in real-time
Pricing model: Pay-per-use eliminates waste from over-provisioning
Business Impact: AWS became a $90B business by solving the supply-demand mismatch in computing
2. Law of Diminishing Returns: When More Becomes Less
Core Principle: Adding more of one input (while holding others constant) eventually yields smaller marginal increases in output. The first engineer adds huge value; the 50th adds incrementally less.
Real-World Application: Startup Hiring Mistakes
Case Study
Scaling Too Fast: The 2021 Tech Hiring Bubble
Context: Tech startups raised massive rounds in 2020-2021 and hired aggressively
Engineers 51-100: 20% productivity (bureaucracy, duplicated work, communication chaos)
2022-2023 Reality Check: Meta, Amazon, Google, Twitter cut 10-20% of workforce—recognizing diminishing returns had set in
Lesson: Growth in headcount ? growth in output. Organizational complexity grows faster than linear headcount.
Diminishing ReturnsEconomies of Scale
Business Applications
For Operations Teams: Measure marginal productivity. If adding the 5th person to a project doesn't increase output by at least the cost of their salary, you've hit diminishing returns. Use small, autonomous teams (Amazon's "two-pizza teams").
For Marketing Teams: Track cost per acquisition (CPA) by channel. The first $100K in Google Ads might yield $500K revenue; the next $100K might only yield $120K. Know when to stop scaling a channel and diversify.
For Finance Teams: Model marginal ROI for capital investments. A factory expansion might have 30% ROI, but the second expansion might only yield 12%. Compare to alternative uses of capital.
Setup: 2016-2017, Uber aggressively recruits drivers in major cities. San Francisco: first 5,000 drivers = 95% utilization (high rider demand, instant pickup). Added 5,000 more drivers (10,000 total) = 70% utilization (more competition for rides). Added another 10,000 (20,000 total) = 40% utilization (drivers waiting 30+ minutes between rides).
Diminishing Returns Impact: First 5,000 drivers: each earns $30/hour (busy constantly). Next 5,000: each earns $20/hour (more idle time). Next 10,000: each earns $12/hour (barely above minimum wage). Marginal productivity declining sharply—too many drivers chasing same rider demand. Driver churn spikes from 15% monthly to 40% monthly as earnings drop.
Key Insight: Adding more supply (drivers) hits diminishing returns when demand (riders) doesn't scale proportionally. Uber learned to model "optimal driver density" per market—beyond this point, adding drivers hurts both driver income and company efficiency (paying incentives to recruit drivers who then quit due to low earnings).
Quantifying Diminishing Returns Formula: Marginal Product = Change in Output ÷ Change in Input Decision Rule: Continue adding resources while Marginal Revenue > Marginal Cost Warning Sign: When marginal product falls below average product, you're over-investing
3. Law of Opportunity Cost: The Hidden Price of Every Decision
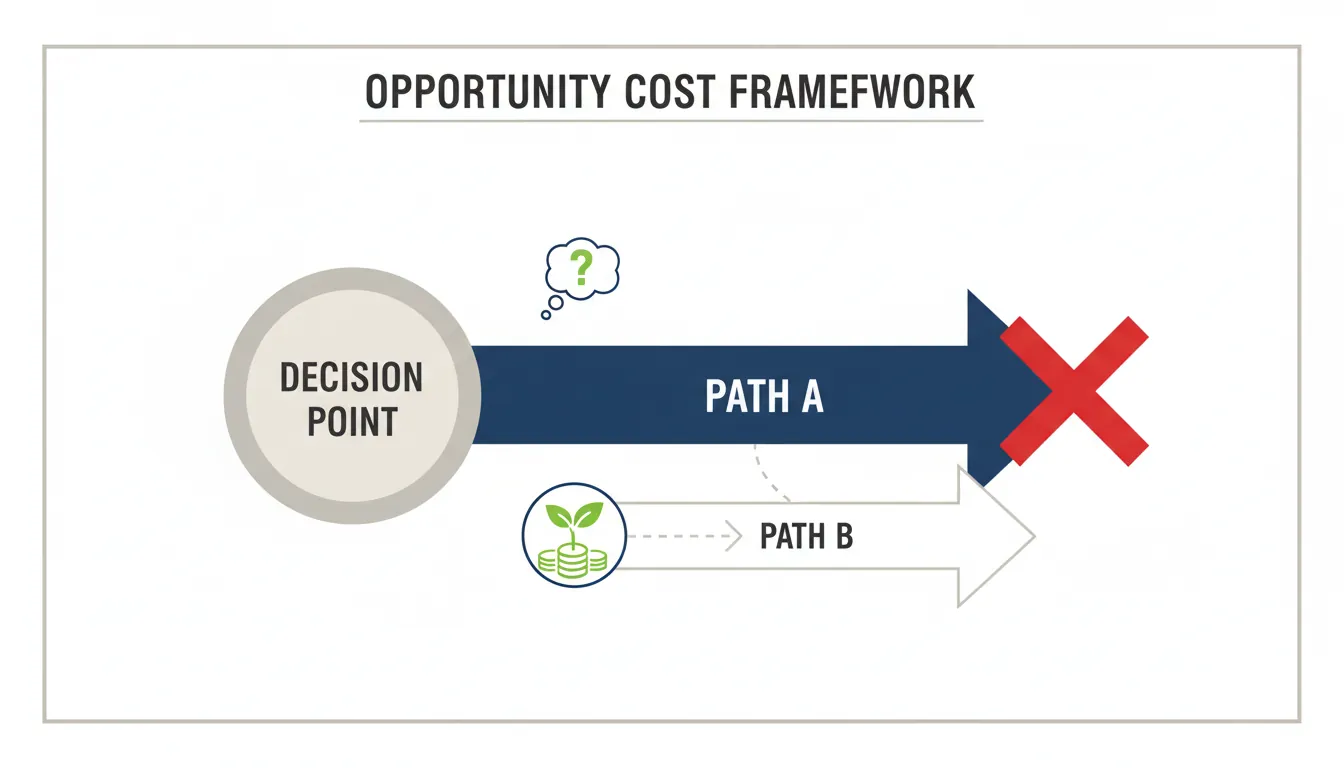
Core Principle: The true cost of any choice is what you give up by not choosing the next-best alternative. Money spent on Project A cannot be spent on Project B.
Figure: Opportunity cost framework showing how choosing one path means sacrificing the next-best alternative.
2005 Decision: Launch Prime with free 2-day shipping for $79/year
Opportunity Cost Analysis:
What Amazon gave up: $1-2 billion in annual shipping revenue
Alternative use of capital: Could have built 10 new fulfillment centers
Short-term impact: Profit margins compressed 3-5%
What Amazon Gained:
200M+ Prime members paying $139/year = $28B recurring revenue
Prime members spend 2-3x more than non-Prime customers
Customer lifetime value increased 5-10x
Lesson: Bezos chose long-term customer lock-in over short-term profits. The opportunity cost was worth it.
Opportunity CostTime Value of Money
Business Applications
For Strategy Teams: Every "yes" to a new initiative is a "no" to something else. Use a decision matrix that explicitly lists trade-offs. Ask: "What are we NOT doing because we're doing this?"
For Product Teams: Feature prioritization is opportunity cost management. Building Feature A means delaying Feature B. Use ROI ranking: Value ÷ (Cost + Opportunity Cost).
For HR Teams: Hiring one VP of Sales means you can't hire a VP of Product this quarter. Model the revenue impact of each role's first year. Choose the higher NPV option.
Executive Decision Framework
Before any major decision, answer three questions:
What is the explicit cost? (Money, time, resources)
What is the opportunity cost? (Next-best alternative foregone)
What is the total cost? (Explicit + Opportunity)
Only proceed if Total Value > Total Cost
4. Law of Price Elasticity: Understanding Pricing Power
Core Principle: Elasticity measures how much quantity demanded changes when price changes. High elasticity = price-sensitive customers (commodities). Low elasticity = pricing power (luxuries, necessities).
Real-World Application: Luxury vs. Budget Airlines
Comparative Analysis
Inelastic Demand: Business Class Travel
Elasticity: -0.3 (relatively inelastic)
10% price increase: Only 3% decrease in bookings
Why: Corporate travelers don't pay out-of-pocket, value comfort/time
Result: Airlines can charge $3,000 for a seat that costs $400 in economy
Margin: Business class generates 50-70% of airline profits despite 10% of passengers
Elastic Demand: Budget Airlines (Spirit, Ryanair)
Elasticity: -2.5 (highly elastic)
10% price increase: 25% decrease in bookings
Why: Leisure travelers extremely price-sensitive, have alternatives (driving, trains)
Strategy: Ultra-low base fares + ancillary fees (bags, seats, snacks)
Result: Can't raise prices without losing customers—must compete on cost efficiency
Price ElasticityCompetition
Factors That Reduce Elasticity (Increase Pricing Power)
For Pricing Teams: Segment customers by elasticity. Charge high prices to inelastic segments (enterprise), low prices to elastic segments (SMBs). Use versioning (Basic/Pro/Enterprise) to capture both.
For Marketing Teams: Reduce elasticity through differentiation. Generic product = high elasticity. Branded product with unique features = low elasticity. Invest in branding to reduce price sensitivity.
For Sales Teams: Identify switching costs. If a prospect has high switching costs from their current vendor, you must offer 30-50% more value to justify the change. Conversely, defend your own customers by increasing switching costs (integrations, custom features, data lock-in).
Setup: Starbucks operates 35,000+ stores globally with regional pricing power. US market: premium positioning (coffee + "third place" experience), price inelastic. Emerging markets (China, India): more price sensitive, elastic demand.
Elasticity Test Results: US stores: 2018-2023 raised prices 5% annually (accumulated 28% increase over 5 years). Customer count declined 2% total (very inelastic, elasticity = -0.07). Revenue per store increased 25% (price increases > volume declines). China stores: 2019 test 8% price increase ? 12% traffic decline (elastic, elasticity = -1.5). Revenue declined 5% (price increases < volume losses). Reversed price increase, focused on store expansion instead.
Strategic Implication: Same brand, different elasticity by market. US: brand loyalty, lack of substitutes (independent coffee shops closed during COVID), habit formation = inelastic. Can raise prices aggressively. China: intense competition (Luckin Coffee 10,000+ stores, cheaper alternative), emerging middle class price-sensitive = elastic. Must compete on value. Starbucks adapts pricing strategy to local elasticity: US focus on price realization (raise prices, premiumize), China focus on volume growth (affordable pricing, rapid expansion to 9,000 stores by 2025).
Testing Price Elasticity Formula: Elasticity = (% Change in Quantity) ÷ (% Change in Price) Elastic (>1): Revenue falls when price rises ? lower prices to maximize revenue Inelastic (<1): Revenue rises when price rises ? raise prices to maximize revenue Unit Elastic (=1): Revenue unchanged when price changes ? optimize for other factors
5. Cross Elasticity of Demand: Understanding Product Substitution
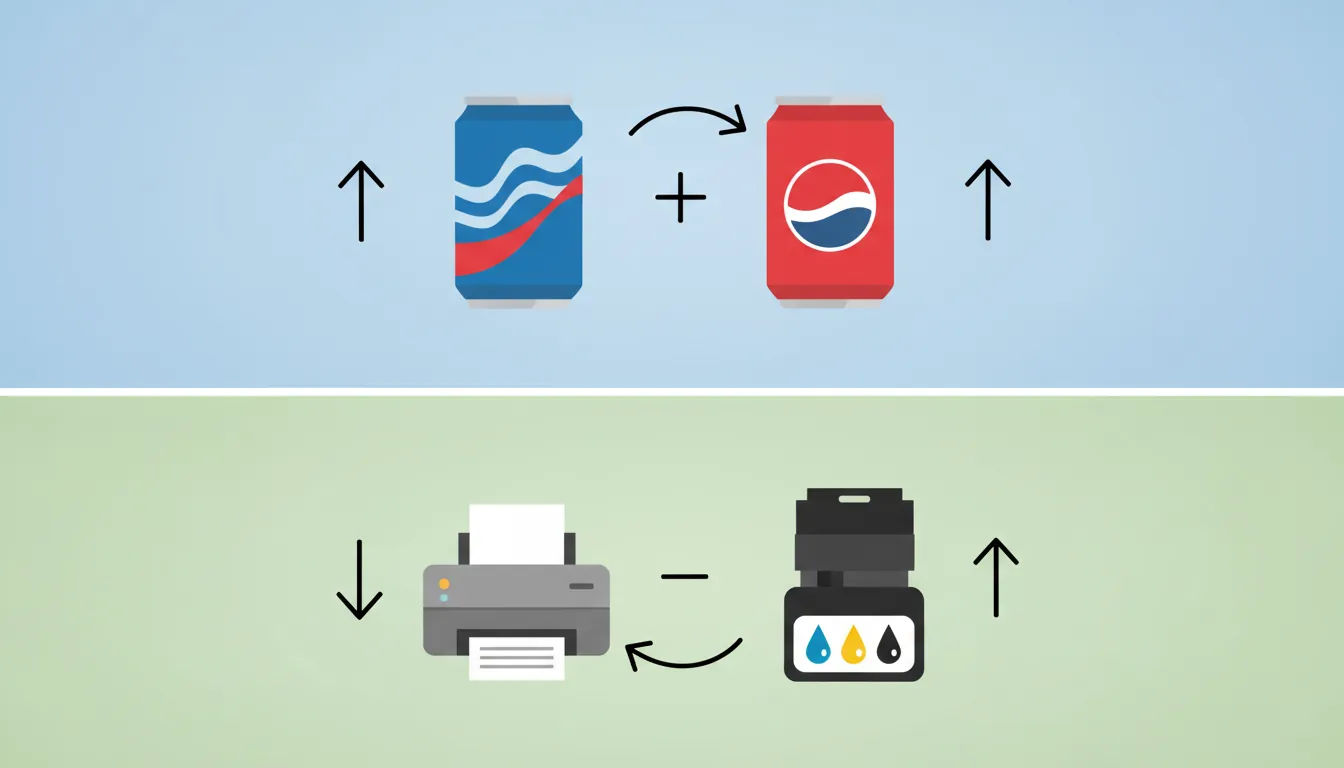
Core Principle: Cross elasticity measures how demand for Product A changes when the price of Product B changes. Positive cross elasticity = substitutes (Coke vs. Pepsi). Negative cross elasticity = complements (printers vs. ink).
Figure: Cross elasticity of demand illustrating positive elasticity for substitutes (Coke vs. Pepsi) and negative elasticity for complements (printers vs. ink).
When Disney+ launched at $6.99: Netflix saw 15% churn increase in households with children
Why: Both offer streaming video, similar content types, easy to switch
Business Impact: Netflix had to invest billions in original content to differentiate
Result: Price war—Netflix couldn't raise prices without losing customers to Disney+
Low Substitution: Spotify vs. Apple Music
Cross Elasticity: +0.3 (weak substitutes)
Why low: Playlists, algorithms, social features create switching costs
User behavior: Once users invest time curating Spotify, they stay despite price increases
Strategic lesson: Build features that reduce cross elasticity with competitors
Cross ElasticityCompetition
Business Applications
For Product Teams: Build features that reduce substitutability. Proprietary data formats, integrations, network effects—anything that makes switching costly. Salesforce's AppExchange (10,000+ apps) makes it hard to switch to competitors.
For Pricing Teams: Monitor competitor pricing closely when cross elasticity is high. In commodity markets (gasoline, airline tickets), match competitor price changes within hours or lose share immediately.
For Strategy Teams: Map your competitive landscape by cross elasticity. High cross elasticity = intense price competition. Low cross elasticity = pricing power. Invest in differentiation to reduce cross elasticity.
Cross Elasticity Decision Framework Formula: Cross Elasticity = (% Change in Qty of A) ÷ (% Change in Price of B) Substitutes (Positive): When competitor raises price, your demand increases Complements (Negative): When complement's price rises, your demand falls Example: When gas prices rise, demand for SUVs falls (complements)
6. Income Elasticity of Demand: Economic Cycles & Consumer Behavior
Core Principle: Income elasticity measures how demand changes when consumer income changes. Normal goods (elasticity > 0) see demand rise with income. Inferior goods (elasticity < 0) see demand fall as income rises.
Real-World Application: Recession-Proof vs. Cyclical Businesses
2021 Recovery: Revenue surged 60% as incomes rebounded
Strategic implication: Luxury brands are highly cyclical—need cash reserves for downturns
Staples: Low Income Elasticity (+0.2)
Example: Walmart, Dollar General, generic brands
2008 Recession: Walmart revenue grew 7% while Target fell 3%
Why: People still need groceries, household goods regardless of income
Strategic advantage: Recession-resistant business model attracts stable investors
Inferior Goods: Negative Income Elasticity (-0.5)
Example: Instant ramen, used cars, public transportation
Recession boom: Nissin (instant noodles) revenue up 25% in 2008-2009
Recovery decline: As incomes recovered, consumers switched to fresh food
Income ElasticityMarket Cycles
Business Applications
For Finance Teams: Use income elasticity to forecast revenue during economic cycles. High elasticity = volatile revenue, need larger cash reserves. Low elasticity = stable revenue, can operate with higher leverage.
For Strategy Teams: Portfolio diversification by income elasticity. Luxury conglomerate LVMH owns both high-elasticity brands (Louis Vuitton) and low-elasticity brands (Sephora cosmetics) to smooth revenue cycles.
For Marketing Teams: Adjust messaging by economic climate. Recession: emphasize value, durability, necessity. Boom: emphasize status, aspiration, premium features.
Income Elasticity Strategy Matrix
Product Category
Income Elasticity
Recession Strategy
Luxury (+2 to +4)
Very High
Build cash reserves, cut costs fast, focus on ultra-wealthy
Normal Goods (+0.5 to +1.5)
Moderate
Shift to value messaging, introduce economy tiers
Necessities (0 to +0.5)
Low
Maintain prices, gain market share from premium brands
Inferior Goods (-0.5 to -2)
Negative
Increase production, recession is growth opportunity
7. Law of Scarcity: Artificial Limits & Psychological Value
Core Principle: Scarcity increases perceived value. Limited availability creates urgency and demand, even when artificial. Humans value rare items more than abundant items, regardless of utility.
Drop model: New items every Thursday, sell out in minutes
Limited quantities: Typical drop = 300-500 units per item (vs. 100,000+ for normal retail)
No restocks: Once sold out, item never returns
Result: $20 t-shirt resells for $200+ on secondary market
Business Impact:
Brand value: Supreme sold to VF Corp for $2.1B (2020)
Margin: 60-70% gross margin (vs. 40% for normal apparel)
No discounting: Items never go on sale—scarcity maintains value
Free marketing: Scarcity creates FOMO, drives organic social buzz
ScarcityPricing Power
Types of Strategic Scarcity
Scarcity Type
Example
Business Mechanism
Quantity Scarcity
Limited editions, numbered prints
Nike's limited sneaker drops, Hermès Birkin bags
Time Scarcity
Flash sales, seasonal items
Amazon Prime Day, McDonald's McRib
Access Scarcity
Waitlists, invite-only
Gmail beta (2004), Clubhouse invites (2020)
Geographic Scarcity
Regional exclusives
Tesla only in select cities initially
Business Applications
For Product Teams: Design scarcity into product launches. Gmail's invite-only beta (2004-2007) created massive demand despite free alternatives (Yahoo, Hotmail). Scarcity = exclusivity = desirability.
For Marketing Teams: Use countdown timers, "Only X left in stock," and limited-time offers. Booking.com's "Only 1 room left!" messaging increases conversion 15-25% through urgency.
For Sales Teams: Create artificial scarcity through limited allocations. SaaS companies use "Limited beta slots available" to speed up enterprise sales cycles from 9 months to 3 months.
Scarcity Warnings & Best Practices Ethical Use: Don't fake scarcity—customers will discover truth and backlash (e.g., fake countdown timers that reset) Product-Market Fit First: Scarcity amplifies desire for good products, doesn't create demand for bad ones Balance: Too much scarcity = lost revenue (Supreme leaves money on table). Too little = no urgency Best Formula: Produce 70-80% of potential demand to create scarcity without maximizing revenue loss
8. Comparative Advantage: Specialize in What You Do Best
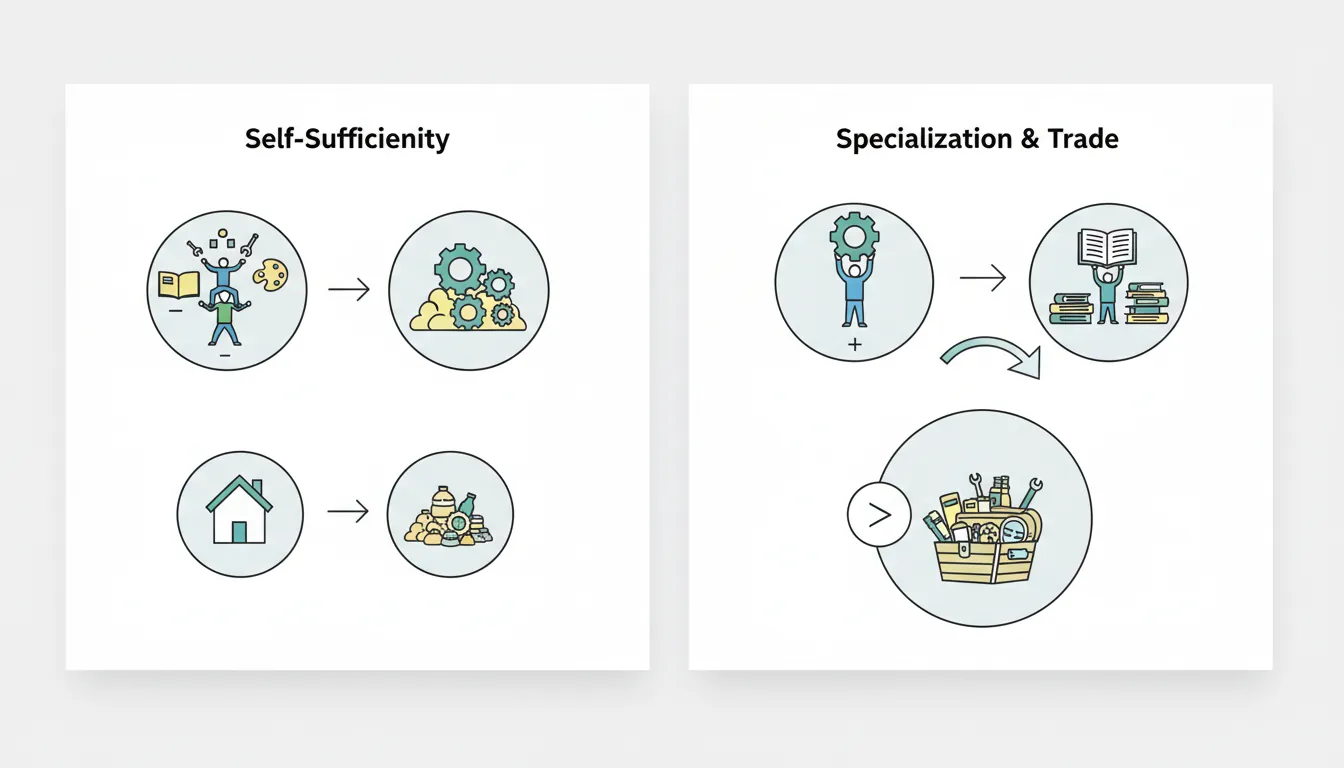
Core Principle: Even if you're better than everyone else at everything (absolute advantage), you should still specialize in what you do relatively best (comparative advantage) and trade for the rest. Opportunity cost determines specialization, not absolute productivity.
Figure: Comparative advantage model demonstrating how specializing in what you do relatively best and trading for the rest creates more value than self-sufficiency.
Real-World Application: Amazon's Build vs. Buy Strategy
Strategic Framework
What Amazon Builds (Core Comparative Advantage)
Logistics & Fulfillment: Core to 2-day delivery promise, $100B+ invested in proprietary warehouse/delivery network
AWS Infrastructure: Cloud computing became $90B business, proprietary tech no vendor could match
Alexa/AI: Voice shopping = strategic future ($10B+ invested), builds in-house for control
What Amazon Buys/Outsources
Manufacturing: Outsources to Foxconn, Pegatron—no comparative advantage in hardware production
Payment Processing: Uses Visa/Mastercard networks—cheaper than building from scratch
Last-Mile Delivery: Partnerships with UPS, USPS, third-party drivers—scales faster than building entire fleet
Decision Framework: Build if (1) core to competitive advantage, (2) proprietary IP matters, (3) cheaper at scale. Otherwise buy—specialization beats vertical integration.
Setup (March 2018): Trump imposed 25% tariffs on steel imports, 10% on aluminum, citing national security. Classical comparative advantage predicts specialization: China has comparative advantage in steel (lower labor costs, economies of scale), US has comparative advantage in tech, aerospace, finance. Free trade = both countries gain. Tariffs = reject comparative advantage, force domestic production regardless of efficiency.
Metric
Impact (2018-2020)
Steel Import Volume
Down 15%
Domestic Steel Prices
Up 30%
Jobs Protected (steel/aluminum)
+8,700 jobs
Jobs Lost (downstream manufacturing)
-75,000 jobs (autos, construction, machinery)
Consumer Impact
+$900/household/year (higher car, appliance, construction costs)
Trade Diversion
40% of lost Chinese imports shifted to Vietnam, Mexico (not US production)
Retaliation
China, EU, Canada targeted $13B US exports (agriculture, motorcycles)
Economic Analysis: Deadweight loss $7.2B annually. Terms of trade manipulation failed—US consumers/manufacturers paid 92%+ of tariff cost, not Chinese exporters (inelastic demand for steel inputs). Job opportunity cost: $900,000 per steel job saved (could've retrained workers for $50K each). Key insight: Protectionism violates comparative advantage = both countries worse off. Short-term visible gains (steel jobs) masked larger invisible costs (downstream job losses, consumer harm).
2025-2026 Tariff Escalation: January 2025, Trump's second term resumed aggressive protectionist policy. China tariffs escalated to 60% baseline (up from 25%), applied to $500B+ in goods. EU faced new 20% auto tariffs + 10% general tariffs ($200B+ goods). Mexico threatened 25% tariffs unless border cooperation improved ($400B+ goods). Universal baseline 10% tariff on ALL imports from ALL countries proposed ($3 trillion in global trade affected). Consumer burden: $2,100/household annually (vs. $1,277 in 2018-20). Net GDP impact: -0.8% growth (2025-26).
2025 TariffsTrade WarPolicy Failure
9. Law of Diminishing Marginal Utility: Why More Isn't Always Better
Core Principle: The satisfaction (utility) gained from each additional unit of consumption decreases. First slice of pizza = amazing. Fifth slice = less enjoyable. Tenth slice = negative utility (pain).
Real-World Application: SaaS Pricing Tiers
Pricing Strategy
How Slack Captures Value Through Marginal Utility
Free Tier: High marginal utility per feature
10,000 searchable messages: Huge value for small teams
SAML SSO, compliance exports: Zero value for SMBs, critical for enterprise
24/7 support: Most users never need, but enterprises require
Strategy: Price on willingness-to-pay, not utility (enterprise can afford it)
Marginal UtilityPrice Discrimination
Business Applications
For Product Teams: Design good/better/best tiers based on marginal utility curves. Front-load high-utility features in basic tier to drive adoption. Reserve low-utility features for premium tiers—charge high prices because alternatives are expensive (build custom SSO vs. pay for Business+ tier).
For Marketing Teams: Message marginal benefits correctly. Don't oversell features with low marginal utility—customers won't pay. Focus messaging on high-utility differentiators.
For Finance Teams: Revenue optimization = maximize area under marginal utility curve. Tiered pricing captures different utility segments—free tier (first units, high utility), pro tier (middle units, moderate utility), enterprise tier (last units, low utility but high willingness-to-pay).
Diminishing Marginal Utility in Action Freemium Model: Gives away high-marginal-utility features free ? customers hooked ? pay for moderate-utility features Subscription Fatigue: 15th streaming service has near-zero marginal utility ? churn increases Decision Rule: Stop adding features when marginal cost > marginal utility for target customer
10. Sunk Cost Fallacy: When to Cut Your Losses
Core Principle: Sunk costs are past expenses that cannot be recovered. Rational decision-making ignores sunk costs and focuses only on future costs/benefits. Yet humans irrationally factor sunk costs into decisions ("I've already invested so much...").
Figure: Sunk cost fallacy illustration contrasting rational decision-making (ignore sunk costs) with irrational behavior (continuing to invest based on past expenditures).
Real-World Application: Google Glass & Strategic Pivots
Failure Analysis
When Google Fell for Sunk Cost Fallacy (Initially)
2012-2014: Sunk Costs Accumulate
R&D Investment: $500M+ in hardware, software, partnerships
Team Size: 50+ engineers, designers, product managers
Marketing: Super Bowl ads, celebrity endorsements
Market signal: Terrible reception—called "Glassholes," privacy concerns, no product-market fit
Pivoted to enterprise: Refocused on warehouses, factories (actual use case)
Key insight: Ignored sunk costs, made decision based on future prospects
Contrast: If trapped by sunk costs, would've poured another $500M into doomed consumer product
Sunk Cost FallacyStrategic Pivots
Common Sunk Cost Traps in Business
Business Context
Sunk Cost Trap
Rational Response
Failed Product
"We've spent $10M building this, we can't give up now"
If future expected value < future costs, shut it down regardless of past spend
Underperforming Employee
"We invested 2 years training them, can't fire now"
Past training is sunk. If current output < current cost, replace
Bad Acquisition
"We paid $1B, must make it work"
Acquisition price is sunk. If integration costs > expected value, divest
Legacy Tech Stack
"We've customized this CRM for 10 years"
Past customization is sunk. If migration cost < (old TCO - new TCO), migrate
Business Applications
For Strategy Teams: Quarterly portfolio review—ask "If we were starting today, would we invest in this project?" If no, shut it down regardless of sunk costs. Amazon's "two-way door" framework: easily reversible decisions should be made fast, ignoring sunk costs.
For Finance Teams: Use incremental analysis for go/no-go decisions. Only factor in future cash flows. Spreadsheet discipline: never include past expenditures in NPV calculations for continuing projects.
For Product Teams: Feature deprecation based on future maintenance cost vs. future value, not past development cost. Slack sunset Slack Connect features that cost $5M to build but had low engagement—right call despite sunk cost.
Setup: 2011 Netflix: 24M DVD subscribers, $2B invested in DVD distribution (58 fulfillment centers, automated sorting, logistics). DVD highly profitable: $3.2B revenue, 52% operating margins. But streaming emerging: 22M streaming subscribers, growing 60% annually.
Sunk Cost Decision: Reed Hastings faces choice: (1) Protect DVD business (slow streaming investment, maximize cash from existing infrastructure), or (2) Cannibalize DVD, accelerate streaming (write off $2B infrastructure, invest heavily in streaming). Wall Street pressures DVD protection. Hastings chooses cannibalization despite massive sunk costs.
Execution: 2011: Netflix splits DVD/streaming ($15.98/month combined ? $7.99 each). Customer backlash: 800K cancel (stock drops 75%). Strategy: force streaming adoption, starve DVD business. 2012-2016: DVD subscribers decline 20M ? 3M. Netflix deploys $15B into streaming content (House of Cards, international expansion).
Result: 2024: Netflix 260M streaming subscribers, $33B revenue, $280B market cap. DVD shut down July 2023. Key lesson: Hastings ignored sunk costs ($2B DVD infrastructure) to capture streaming future. Blockbuster made opposite choice—protected $6B retail store infrastructure (sunk cost fallacy), refused to cannibalize. Result: bankruptcy (2010). Sunk cost discipline = competitive advantage.
Sunk Cost Decision Framework Question: "If I had not already invested X, would I invest it now?" If Yes: Continue project (but base decision on future prospects, not past investment) If No: Exit project immediately (sunk costs are irrelevant) Red Flag: Phrases like "We've come too far to quit now" or "Can't waste what we've invested"
11. Risk-Return Tradeoff: No Free Lunch in Finance
Core Principle: Higher potential returns require taking higher risk. Low-risk investments offer low returns. Cannot have both high returns and low risk—markets are efficient at pricing risk.
Real-World Application: Startup vs. Corporate Job
Career Decision
The Risk-Return Spectrum of Career Paths
Low Risk, Low Return: Corporate Job at Fortune 500
Salary: $120K base + $30K bonus = $150K total comp
10-year outcome: $1.5M-$2M total earnings, high certainty
High Risk, High Return: Early-Stage Startup
Salary: $80K base + 0.5% equity = expected value ~$100K year 1
Risk: 90% chance of failure (startup fails, equity worthless)
10-year outcome: 90% chance = $800K total earnings. 10% chance of $10M+ (IPO/acquisition)
Expected value: (0.9 × $800K) + (0.1 × $10M) = $1.72M (similar to corporate, but much higher variance)
Risk-ReturnExpected Value
Business Applications
For Finance Teams: Capital allocation by risk-return profile. Conservative companies (utilities, banks) invest in low-risk, low-return projects (bonds, blue-chip stocks). Growth companies (tech startups) swing for high-risk, high-return bets (R&D, acquisitions).
For Strategy Teams: Portfolio approach to risk. Don't bet entire company on one high-risk project—70% low-risk projects (sustaining innovations), 20% medium-risk (adjacent markets), 10% high-risk (breakthrough innovations). Google's "70-20-10" rule.
For Investors: Startup investing requires power law thinking. Most investments fail (0x return), few succeed (3-5x), rare home runs (100x+). Need portfolio of 20+ investments to achieve statistical edge. Single high-risk bet = gambling, not investing.
Risk-Return Matrix for Business Decisions
Risk Level
Expected Return
Example Investment
Low Risk
5-8% annual
Treasury bonds, savings accounts, core business operations
Medium Risk
10-15% annual
S&P 500 index, adjacent market expansion, product line extensions
High Risk
20-30%+ annual (or total loss)
Startups, new product categories, international expansion, M&A
The 11 laws in this foundational chapter don't operate in isolation—they form an interconnected system for strategic decision-making. Understanding how these principles interact enables executives to diagnose market dynamics, anticipate competitive responses, and design sustainable business models.
The Strategic Decision Cascade
Strategic Framework
How the 11 Laws Connect in Real Business Decisions
Example: Launching a New Product
Step 1: Demand & Supply Analysis (Law 1)
Identify demand curve: How many customers at different price points?
Map supply constraints: Can we scale production to meet demand?
Find equilibrium: Where does supply meet demand profitably?
Step 2: Elasticity Assessment (Laws 4, 5, 6)
Price Elasticity: Will 10% price cut drive 20% volume increase? (Business class vs. economy dynamics)
Cross Elasticity: How will competitors respond? Are we substitutes or complements?
Income Elasticity: Is this luxury (+2.5) or necessity (+0.2)? Plan for economic cycles accordingly
Step 3: Opportunity Cost Evaluation (Law 3)
What are we NOT doing by pursuing this? (Amazon Prime's strategic tradeoff)
Expected value calculation: (Probability × Outcome) across scenarios
Downside protection: Can we survive worst-case scenario?
Step 7: Avoid Sunk Cost Trap (Law 10)
"If we hadn't already invested $X, would we invest it now?"
Kill projects failing product-market fit tests (Google Glass, Netflix DVD)
Pivot discipline: incremental analysis, not sunk cost justification
Integrated Strategic Analysis: AWS Case Study
Amazon Web Services: All 11 Laws in Action
Demand & Supply: Identified latent demand for elastic compute (startups needed servers but couldn't afford upfront CapEx). Supplied via cloud model with instant scalability.
Diminishing Returns: AWS avoided by platform model—each new customer added with near-zero marginal cost (software scales infinitely).
Opportunity Cost: Chose to cannibalize potential server sales to retailers (opportunity cost) to capture $90B cloud market (realized gain).
Cross Elasticity: AWS + complementary services (Lambda, S3, RDS) reduced cross-elasticity with competitors—switching costs from integrated ecosystem.
Income Elasticity: Enterprise cloud adoption accelerated during 2008 recession (companies cut CapEx, shifted to OpEx)—normal good behavior (+0.8 income elasticity).
Scarcity: Avoided artificial scarcity (infinite digital supply)—competed on abundance and elasticity instead.
Comparative Advantage: Built data centers (core competency from retail infrastructure) but outsourced chip manufacturing to Intel/AMD (no advantage).
Marginal Utility: Freemium tier (free trials) provided high marginal utility to startups—hooked customers, upsold to enterprises later.
Sunk Cost: Amazon wrote off $billions in failed AWS experiments (SimpleDB, CloudFront CDN early versions)—pivoted based on customer feedback, not sunk costs.
Risk-Return: AWS was high-risk bet (90% chance of failure per internal estimates)—but potential $100B+ return justified risk. Portfolio approach: AWS = 10% moonshot alongside 70% retail optimization.
Executive Decision-Making Checklist
Use this framework to analyze major strategic decisions through the lens of all 11 market fundamentals:
Law
Key Question
Decision Implication
Demand & Supply
Where is the market equilibrium?
Price too high = lost volume. Too low = foregone profit. Find clearing price.
Diminishing Returns
At what scale do marginal gains turn negative?
Stop hiring/investing when marginal cost > marginal benefit.
Opportunity Cost
What's the next-best alternative?
Say yes to higher-value opportunities, no to lower-value.
Front-load high-utility features in base tier. Reserve low-utility for premium.
Sunk Cost
Would we invest this money again knowing what we know now?
Kill projects that fail this test. Pivot based on forward-looking analysis.
Risk-Return
Does expected return justify the risk?
Portfolio approach: diversify risk across multiple bets with different profiles.
Common Pitfalls When Applying These Laws
Pitfall 1: Analyzing Laws in Isolation
Don't just check demand-supply and stop. Price elasticity might suggest cutting prices, but income elasticity (recession-resistant product) might argue for maintaining margins. Consider all interactions.
Pitfall 2: Ignoring Time Horizons
Diminishing returns apply in short-term (adding 100th developer to 6-month project). But long-term, network effects or experience curves may enable increasing returns. Specify timeframe for each analysis.
Pitfall 3: Confusing Correlation with Causation
High prices AND high demand doesn't mean demand is inelastic—might be signaling quality (luxury goods). Test with controlled price changes, not just observations.
Pitfall 4: Sunk Cost Fallacy in Disguise
"We've invested so much in building this in-house, we can't outsource now" violates comparative advantage AND sunk cost discipline. Forward-looking analysis only.
Pitfall 5: Applying Static Models to Dynamic Markets
Elasticities change over time (Netflix became less elastic as competitors emerged). Comparative advantages shift (AWS started with advantage, now commoditized). Re-evaluate quarterly.
Team Applications: Finance, Marketing & Strategy
Different functions within your organization can apply these 11 market fundamentals to their daily work. Here's how Finance, Marketing, and Strategy teams should operationalize these economic principles.
Finance Team Applications
Finance & FP&A
Revenue Forecasting & Capital Allocation
1. Use Elasticities for Demand Modeling (Laws 4, 5, 6)
Price Elasticity: Model revenue impact of pricing changes. If elasticity = -1.5, a 10% price increase causes 15% volume drop ? net revenue declines 6.5%. Build elasticity assumptions into FP&A models.
Income Elasticity: Forecast cyclical revenue swings. Luxury goods (+2.5 elasticity): recession = -35% revenue. Build cash reserves = 18 months runway to survive downturns. Staples (+0.2): stable revenue, can operate with higher leverage.
Track marginal ROI by budget tier: First $1M marketing spend = 5× ROAS. Next $1M = 3× ROAS. Stop at 1× ROAS breakeven.
Sales hiring: Plot revenue per rep vs. team size. When marginal rep generates <$500K (below cost), stop hiring and optimize existing team.
R&D allocation: Don't fund projects where marginal $1M yields <$3M NPV (below hurdle rate). Reallocate to higher-return opportunities.
3. Use Risk-Return Portfolio Theory (Law 11)
Capital Allocation Framework: 70% low-risk projects (core product optimization, proven channels), 20% medium-risk (adjacent markets, new features), 10% high-risk (breakthrough innovations, new business models).
Expected Value Analysis: Don't just forecast base case. Model 3 scenarios: (0.6 × $10M base) + (0.3 × $20M upside) + (0.1 × -$5M downside) = $12.5M expected value.
Startup vs. Corporate Risk Profiles: Early-stage = accept high variance for high expected return. Mature company = prioritize consistent returns, avoid binary bets.
4. Avoid Sunk Cost Traps in Capital Planning (Law 10)
Incremental Analysis: "We've spent $5M on this project, should we spend $2M more to finish?" Wrong question. Right question: "Knowing what we know now, is $2M the best use of capital? What's the NPV of completing vs. alternative projects?"
Write-Down Discipline: If project NPV turns negative, write off sunk costs immediately. Don't throw good money after bad (Google Glass, Netflix DVD infrastructure).
Regular Portfolio Reviews: Quarterly re-evaluation of all projects. Kill bottom 10% by NPV, reallocate capital to top opportunities.
5. Comparative Advantage in Build vs. Buy (Law 8)
Decision Matrix: Build if (1) core to strategy, (2) cheaper at scale, (3) proprietary IP matters. Otherwise buy/outsource. Finance should model total cost of ownership (TCO) over 5 years, not just upfront cost.
Example: Cloud infrastructure—AWS costs $1M/year, building data center costs $10M upfront + $500K/year. TCO over 5 years: AWS = $5M, build = $12.5M. Unless strategic (data sovereignty), choose AWS.
Price Elasticity Testing: A/B test pricing in small segments. Raise prices 10% for cohort A, measure volume change. If volume drops <10%, you have pricing power (inelastic). If >10%, elastic demand—compete on value, not premium pricing.
Segment-Specific Pricing: Business travelers (inelastic, -0.3) pay $800 for last-minute flights. Leisure travelers (elastic, -2.1) pay $200 for advance booking. Same product, different elasticities = dynamic pricing opportunity.
Cross-Elasticity Positioning: High cross-elasticity = emphasize differentiation. "We're not just another CRM" (reduce substitutability). Low cross-elasticity = emphasize category leadership. "Industry-standard solution."
2. Scarcity & Urgency Tactics (Law 7)
Limited Availability: Supreme model—drop 300 units, create waitlists. Convert FOMO into organic buzz. But don't fake scarcity (customers discover truth ? backlash).
Optimal Scarcity Level: Produce 70-80% of potential demand. Creates urgency without excessive revenue loss. Too much scarcity (50%) = money left on table. Too little (95%) = no urgency.
3. Marginal Utility in Product Tiering (Law 9)
Good/Better/Best Tiers: Free tier = high marginal utility features (Slack 10K messages, 10 integrations). Pro tier = moderate marginal utility (unlimited messages, $7.25/user). Enterprise = low marginal utility (SAML SSO, compliance) but high willingness-to-pay.
Front-Load Value: Give away high-utility features free to drive adoption. Reserve low-utility features for premium tiers—charge high because alternatives expensive (building custom SSO vs. paying for Business+ tier).
Avoid Over-Tiering: 5+ tiers = decision paralysis. 3 tiers optimal—customers choose middle tier 60% of time ("Goldilocks effect").
4. Demand Forecasting with Income Elasticity (Law 6)
Recession-Proof Messaging: Staples/necessities (+0.2 income elasticity) emphasize value and reliability during downturns. "Keep your business running." Walmart's 2008 recession playbook.
Boom-Time Messaging: Luxury goods (+2.5 income elasticity) emphasize status and aspiration during growth periods. "You've earned this." LVMH's 2021 recovery marketing.
Portfolio Diversification: Mix high and low income-elasticity products to smooth revenue cycles. LVMH: Louis Vuitton (luxury +2.5) + Sephora cosmetics (normal +0.8) = balanced portfolio.
5. Comparative Advantage Positioning (Law 8)
Build-vs-Buy Messaging: If you're the build option: "Custom solution, full control, perfect fit." If you're the buy option: "Fast deployment, proven solution, lower TCO." Match messaging to customer's comparative advantage calculation.
Specialization Story: "We focus 100% on X so you don't have to." Salesforce: "We only do CRM—our comparative advantage." Amazon logistics: "We're best at fulfillment—your comparative advantage is your product."
Equilibrium Shifts: Map external forces shifting curves. COVID-19 shifted demand curve right for Zoom (remote work), left for WeWork (office space). Strategy = anticipate shifts before competitors.
2. Opportunity Cost Framework (Law 3)
Strategic Tradeoffs: Amazon Prime free shipping (opportunity cost: $2B margin) vs. customer lifetime value gain ($3B incremental revenue). Chose higher-value opportunity.
Resource Allocation: Saying yes to Project A means saying no to Project B. Rank all opportunities by NPV, fund down the list until capital exhausted. Explicit opportunity cost analysis prevents "yes to everything" trap.
Focus Discipline: Apple's "1,000 things we said no to" philosophy. Opportunity cost of complexity = distraction, brand dilution, operational inefficiency.
3. Build Core Competencies via Comparative Advantage (Law 8)
Moat Assessment: What can we do better than anyone else? Amazon logistics, Google search algorithms, Tesla battery manufacturing. Build these. Everything else = outsource/partner.
Vertical Integration Decisions: Integrate when (1) strategic control matters, (2) you have comparative advantage, (3) cheaper at scale. Otherwise rely on specialists. Apple: designs chips (comparative advantage in integration) but outsources manufacturing to TSMC (no advantage in fabs).
Market Entry Risk Assessment: Startup vs. corporate career path analysis applies to market entry. Entering mature market (telecom) = low-risk, low-return. Entering emerging category (AI agents) = high-risk, high-return. Choose based on risk tolerance and competitive position.
5. Kill Projects via Sunk Cost Discipline (Law 10)
Regular Portfolio Review: Quarterly "kill meeting" where bottom 10% of projects by forward-looking NPV get shut down. Don't ask "How much have we spent?" Ask "Knowing what we know now, would we fund this?"
Pivot Framework: Netflix DVD ? streaming pivot. Wrote off $2B infrastructure, cannibalized 24M subscribers. Forward-looking analysis said streaming worth $200B+ long-term. Sunk cost discipline enabled $280B market cap.
Two-Way Door Decisions: Amazon's framework—reversible decisions (two-way doors) = move fast. Irreversible decisions (one-way doors) = analyze deeply. Don't let sunk costs turn two-way doors into one-way prisons.
Cross-Elasticity Mapping: Identify which competitors are close substitutes (high cross-elasticity = price wars likely) vs. differentiated (low cross-elasticity = coexistence possible). Spotify vs. Apple Music (+0.3 weak substitutes due to playlists/algorithms) vs. streaming video services (different category, no cross-elasticity).
Income Elasticity Planning: Build recession playbooks for cyclical businesses (+1.5+ income elasticity). Cash reserves, cost structure flexibility, counter-cyclical M&A opportunities. LVMH: 2008 recession acquired smaller luxury brands at discounts (counter-cyclical strategy).
Cross-Functional Collaboration
These 11 laws work best when teams collaborate:
Finance + Marketing: Elasticity testing requires Finance to model revenue impact and Marketing to execute A/B tests. Joint ownership of pricing strategy.
Strategy + Finance: Opportunity cost analysis needs Strategy to identify alternatives and Finance to model NPV of each option. Joint capital allocation decisions.
Marketing + Strategy: Scarcity tactics require Marketing to execute campaigns and Strategy to set supply targets (70-80% of demand). Joint demand planning.
All Teams: Sunk cost discipline requires cultural shift—Finance tracks investments, Strategy reviews portfolio, Marketing pivots messaging based on learnings. No function can solve alone.
Conclusion & Next Steps
These 11 fundamental economic laws form the foundation of sound business decision-making. From pricing strategies driven by supply-demand equilibrium and elasticity analysis, to investment decisions guided by opportunity cost and risk-return tradeoffs, to strategic positioning based on comparative advantage—mastering these principles gives executives a systematic framework for optimizing every major business choice.
But market fundamentals are only the beginning. To build sustainable competitive advantage, you need to understand how production scales, how organizations align incentives, and how competition shapes market structure.