We use cookies to enhance your browsing experience, serve personalized content, and analyze our traffic.
By clicking "Accept All", you consent to our use of cookies. See our
Privacy Policy
for more information.
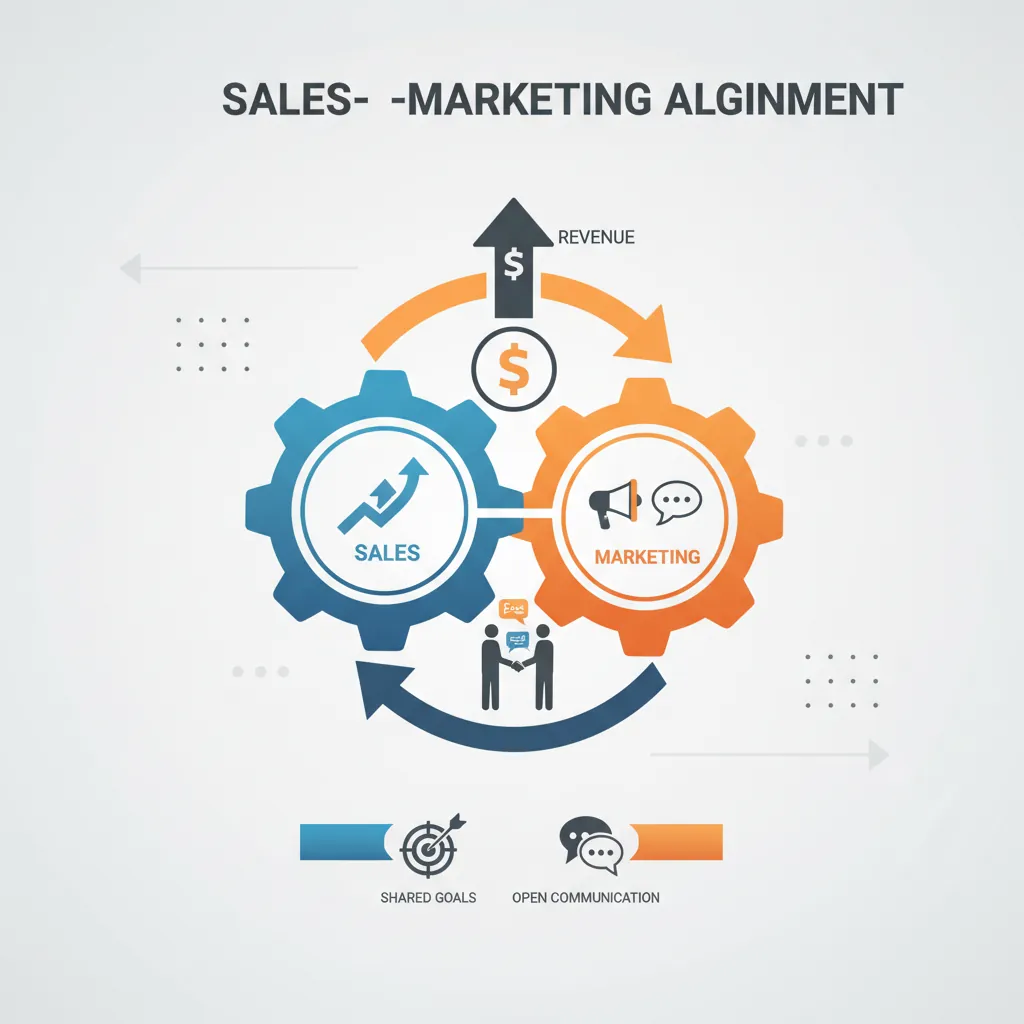
Sales and marketing alignment—sometimes called "Smarketing"—is when both teams share goals, communicate openly, and work together to drive revenue. Misalignment creates lead leakage, finger-pointing, and revenue loss. Alignment creates a unified revenue engine.
Figure 1: Sales-marketing alignment — building a unified revenue engine with shared goals and open communication
The Alignment Imperative
Companies with strong sales-marketing alignment achieve 208% higher marketing revenue contribution (Marketo) and 36% higher customer retention (Aberdeen). Misaligned companies waste 60-70% of marketing content that sales never uses.
Signs of Misalignment
Symptom
Marketing Says
Sales Says
Lead Quality
"We send quality leads, sales doesn't follow up"
"Marketing sends junk leads that never convert"
Content Usage
"Sales doesn't use our content"
"Content doesn't address customer objections"
Pipeline Blame
"We hit our MQL targets"
"MQL numbers mean nothing—we need revenue"
Targeting
"Our campaigns reach the right audience"
"Wrong titles, wrong companies, wrong stage"
Attribution
"Deal came from our campaign"
"Deal came from my relationship"
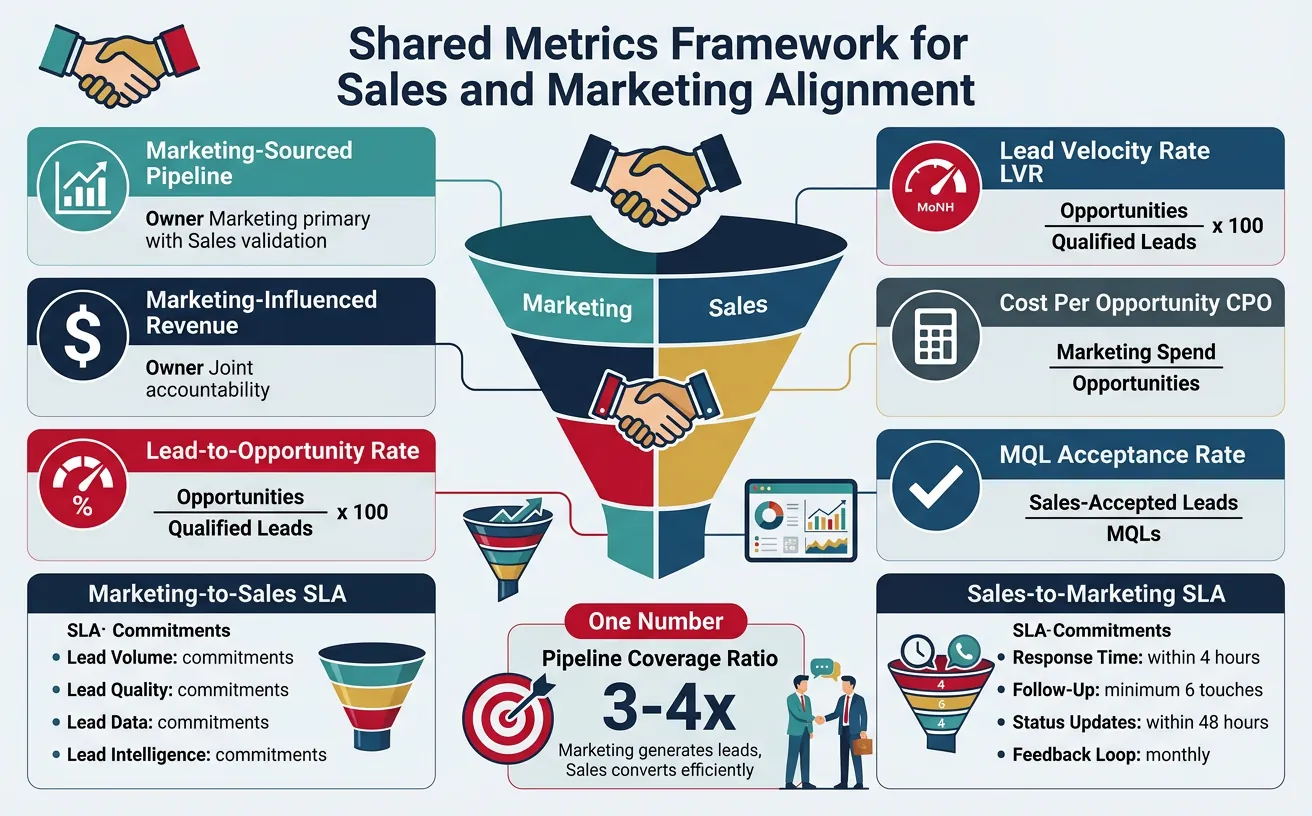
Shared Metrics
Unified metrics bridge the sales-marketing divide. Instead of marketing owning "leads" and sales owning "revenue," both teams share accountability for the full funnel.
Figure 2: Shared metrics framework — unified accountability across the full revenue funnel
The Revenue Metrics Stack
Metric
Formula
Owner
Marketing-Sourced Pipeline
Total pipeline from marketing touches
Marketing (primary), Sales (validation)
Marketing-Influenced Revenue
Revenue where marketing touched the deal
Joint accountability
Lead-to-Opportunity Rate
Opportunities ÷ Qualified Leads × 100
Joint accountability
Cost Per Opportunity (CPO)
Marketing Spend ÷ Opportunities Created
Marketing (efficiency)
Lead Velocity Rate (LVR)
(This Month Leads - Last Month) ÷ Last Month × 100
Joint (growth indicator)
MQL Acceptance Rate
Sales-Accepted Leads ÷ MQLs × 100
Joint (quality indicator)
The "One Number" Approach
Pipeline Coverage Target
Many aligned organizations use a single shared goal: Pipeline Coverage Ratio.
Target: Maintain 3-4x pipeline coverage at all times.
Marketing's job: Generate enough qualified leads to feed pipeline
Sales' job: Convert pipeline efficiently to maintain ratio
Joint responsibility: When coverage drops, both teams troubleshoot
This eliminates the "lead quality" argument—what matters is: Do we have enough qualified pipeline?
SLA Creation
A Service Level Agreement (SLA) formalizes the commitment each team makes to the other. It converts alignment goals into measurable, enforceable standards.
Marketing-to-Sales SLA
Commitment
Standard
Measurement
Lead Volume
Deliver X MQLs per month
CRM count, weekly review
Lead Quality
Y% must meet ideal customer profile
Sales acceptance rate
Lead Data
100% complete contact info
Data validation checks
Lead Intelligence
Behavioral data attached (pages, downloads)
Marketing automation sync
Sales-to-Marketing SLA
Commitment
Standard
Measurement
Response Time
Contact MQL within 4 hours
Time-to-first-touch tracking
Follow-Up
Minimum 6 touches before recycling
Activity logging in CRM
Status Updates
Update lead status within 48 hours
CRM reporting
Feedback Loop
Monthly feedback on lead quality
Structured feedback form
SLA Enforcement
SLAs only work when enforced. Build in consequences: leads recycled back to marketing if not contacted within SLA, marketing scores published monthly, executive reviews when SLAs consistently missed.
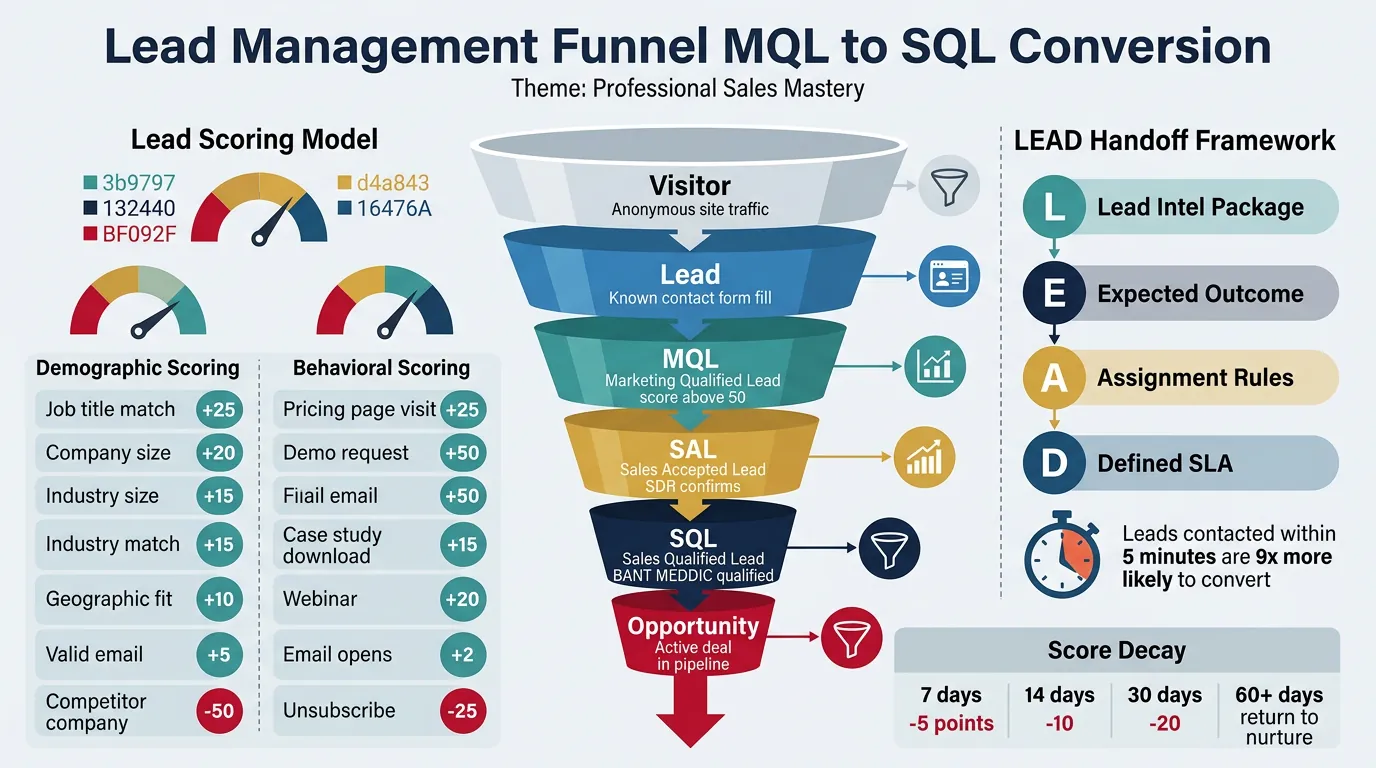
Lead Management
Lead management bridges the gap between marketing activity and sales action. The core concepts—MQL, SQL, and lead scoring—determine which leads sales should prioritize and when marketing should nurture.
Figure 3: Lead management funnel — MQL, SQL, and lead scoring for optimal sales-marketing handoff
Lead Stage Definitions
Stage
Definition
Criteria Example
Owner
Visitor
Anonymous site traffic
IP/cookie tracking only
Marketing
Lead
Known contact
Form fill, email provided
Marketing
MQL
Marketing Qualified Lead
Score > 50, right company size, engaged behavior
Marketing → Sales handoff
SAL
Sales Accepted Lead
SDR confirms qualification, schedules meeting
Sales (SDR)
SQL
Sales Qualified Lead
BANT/MEDDIC qualified, clear opportunity
Sales (AE)
Opportunity
Active deal in pipeline
Discovery complete, next steps defined
Sales (AE)
Lead Scoring
Lead scoring assigns numerical values based on demographics (who they are) and behaviors (what they do). High scores indicate sales-readiness; low scores trigger nurturing.
Scoring Model Components
Demographic/Firmographic Scoring
Who they are:
Job title matches ICP (+25)
Company size in target range (+20)
Industry match (+15)
Geographic fit (+10)
Valid business email (+5)
Personal email (-10)
Competitor company (-50)
Behavioral Scoring
What they do:
Pricing page visit (+25)
Demo request (+50)
Case study download (+15)
Multiple sessions (+10 each)
Email opens (+2 each)
Webinar attendance (+20)
Unsubscribe (-25)
30+ days inactive (-15)
Score Decay
Engagement fades. Build decay into your model to prevent stale leads from appearing hot.
7 days inactive: -5 points
14 days inactive: -10 points
30 days inactive: -20 points
60+ days inactive: Return to nurture sequence
Lead Handoff Process
The handoff from marketing to sales is where most leads die. A clean handoff means sales gets context, speed, and ownership clarity.
The L.E.A.D. Handoff Framework
Element
Description
Action
Lead Intel Package
All relevant context compiled
Company research, engagement history, pain indicators
Leads contacted within 5 minutes are 9x more likely to convert than those contacted after 30 minutes. Lead response time is the single biggest predictor of MQL-to-SQL conversion.
Lead Recycling
Not every MQL converts to SQL. Build recycling rules to return leads to marketing for continued nurturing.
Disqualified: Wrong company, no budget, bad timing → Return to nurture with "future" tag
Unresponsive: No contact after 6+ attempts → Return to nurture with "re-engage" tag
Not Ready: Interested but long timeline → Return with "check back Q3" tag
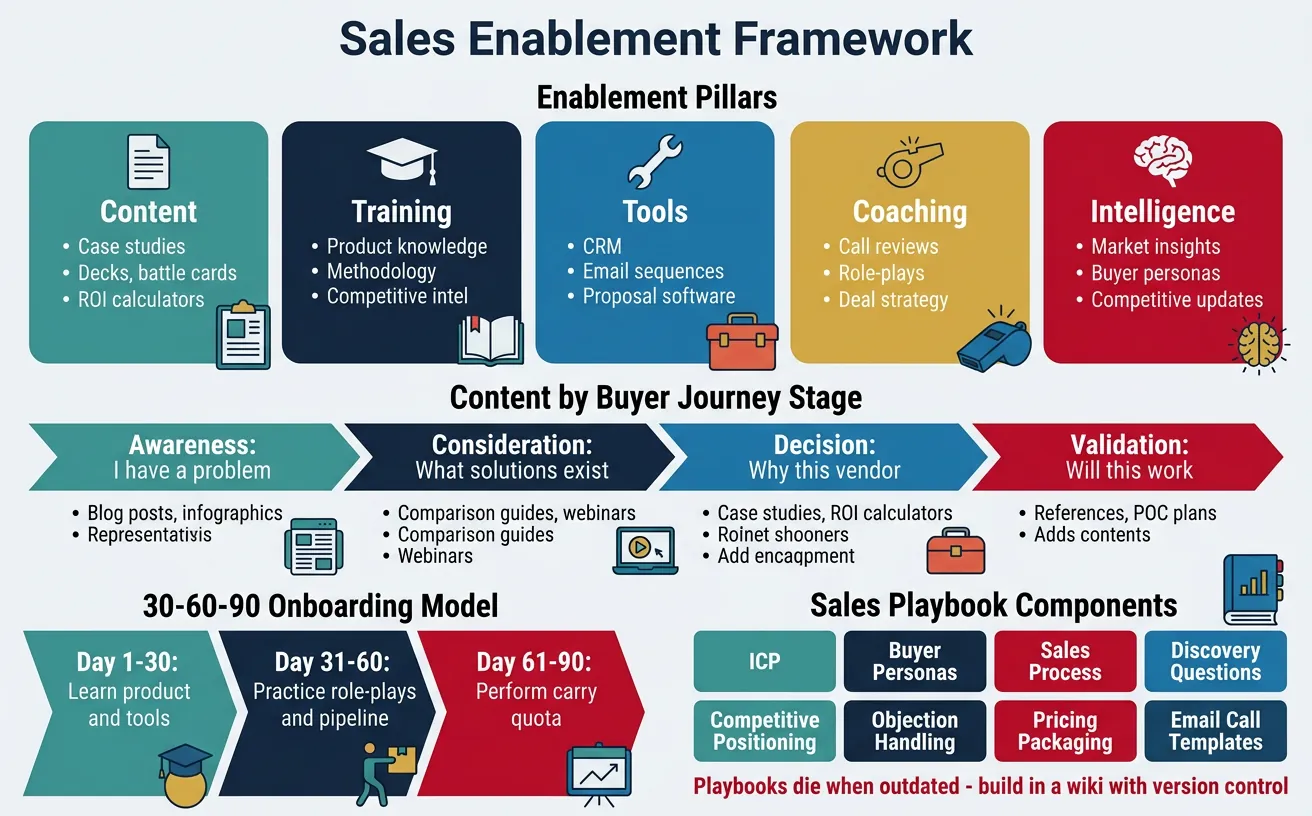
Sales Enablement
Sales enablement equips sellers with the content, tools, training, and intelligence they need to engage buyers effectively. The best enablement programs are built collaboratively between sales and marketing.
Figure 4: Sales enablement framework — equipping sellers with content, tools, training, and buyer intelligence
Sales Enablement Pillars
Pillar
What It Includes
Impact
Content
Case studies, decks, battle cards, ROI calculators
Playbooks die when they become outdated PDFs in a folder. Build playbooks in a wiki or knowledge base with version control, feedback mechanisms, and scheduled quarterly reviews.
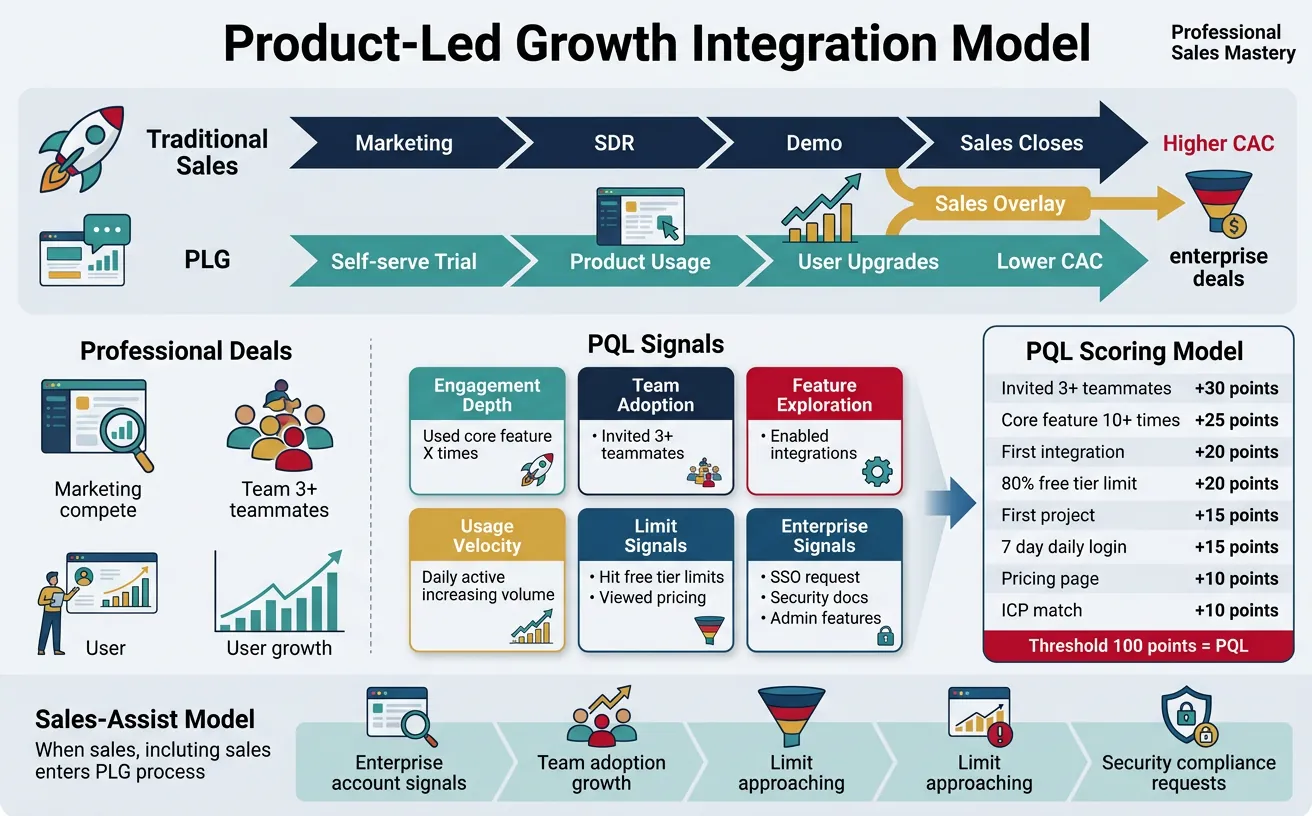
PLG Integration
Product-Led Growth (PLG) flips traditional sales—the product itself becomes the primary driver of acquisition, conversion, and expansion. Sales enters at strategic moments to accelerate or close enterprise deals.
Figure 5: PLG integration model — product-driven acquisition with strategic sales overlay for enterprise deals
PLG vs. Traditional Sales Models
Dimension
Traditional Sales
Product-Led Growth
First Touch
Marketing → SDR → Demo
Self-serve trial/freemium → Product
Qualification
Human (BANT, MEDDIC)
Product usage signals (PQLs)
Value Proof
Demo, POC, case studies
User experiences value firsthand
Conversion
Sales closes the deal
User upgrades via self-serve (assisted for enterprise)
CAC
Higher (sales-intensive)
Lower (product-intensive)
PQL Frameworks
Product Qualified Leads (PQLs) are users who have demonstrated buying intent through product usage. Unlike MQLs based on marketing engagement, PQLs signal actual value realization.
PQL Signals
Signal Type
Examples
What It Indicates
Engagement Depth
Used core feature X times
Finding value in product
Team Adoption
Invited 3+ team members
Organizational fit
Feature Exploration
Enabled integrations, tried advanced features
Expanding use case
Usage Velocity
Daily active use, increasing volume
Habit formation
Limit Signals
Hit free tier limits, viewed pricing
Ready to expand
Enterprise Signals
SSO request, security docs, admin features
Enterprise qualification
PQL Scoring Example
Sample PQL Score Model
Threshold: 100 points = PQL
Invited 3+ teammates (+30)
Used core feature 10+ times (+25)
Enabled first integration (+20)
Hit 80% of free tier limit (+20)
Created first project/workspace (+15)
Daily login for 7+ consecutive days (+15)
Viewed pricing page (+10)
Company matches ICP (+10)
Downloaded data export (+5)
Sales-Assist Models
Pure self-serve works for SMB, but enterprise deals often need human touch. Sales-assist models layer sales on top of PLG at strategic moments.
When to Engage Sales
Trigger
Sales Action
Enterprise domain detected
Assign dedicated rep, personalized welcome
Team size crosses threshold
Proactive outreach to discuss team plan
Security/compliance page viewed
Offer security review call
Stuck in onboarding
Success call to unblock adoption
Trial ending without conversion
Rescue call to understand blockers
Annual contract inquiry
Custom pricing discussion
Assisted vs. Automated
Rule of thumb: Self-serve for deals <$5K ACV, sales-assisted for $5K-$50K, full enterprise sales for $50K+. But calibrate based on your product complexity and buyer sophistication.
PLG Sales Roles
Role
Focus
Metrics
Growth Rep
SMB expansion, high-velocity deals
Conversions per day, expansion revenue
Product Specialist
Unblock stuck users, drive adoption
Activation rate, feature adoption
Enterprise Rep
Large accounts, complex deals
ACV, multi-year contracts
Alignment Strategy Canvas
Use this tool to document your sales-marketing alignment strategy, SLA commitments, and lead management approach.
Alignment Strategy Canvas
Design your sales-marketing alignment framework. Download as Word, Excel, PDF, or PowerPoint.
Draft auto-saved
All data stays in your browser. Nothing is sent to or stored on any server.
Exercises
Exercise 1: Lead Scoring Model Design
Objective: Create a lead scoring model for your product.
List 5-7 demographic/firmographic attributes that indicate fit
List 5-7 behavioral actions that indicate engagement
Assign point values to each (total: 100 = MQL threshold)
Define score decay rules for inactivity
Test model against last 20 closed deals—would they have scored as MQLs?
Exercise 2: SLA Negotiation Roleplay
Objective: Practice negotiating realistic SLAs.
Partner with someone from marketing (or simulate)
Draft your proposed Sales SLA commitments
Request specific Marketing SLA commitments
Negotiate measurement methods and review cadence
Document the final agreement
Exercise 3: PQL Signal Mapping
Objective: Identify the product usage signals that predict conversion.
Analyze your last 10 self-serve conversions
Identify common behaviors before conversion
List 5 signals that indicate expansion readiness
Design triggers for sales outreach
Test with a pilot group of high-usage accounts
Key Takeaways
Alignment = Revenue: Companies with strong sales-marketing alignment see 208% higher marketing revenue contribution and 36% higher retention.
Shared Metrics: Move beyond "MQL targets" to joint metrics like pipeline coverage, marketing-sourced revenue, and lead velocity.
SLAs are Contracts: Formal SLAs with enforcement mechanisms convert alignment theory into operational reality.
Lead Scoring Matters: Combine demographic fit with behavioral engagement, and include decay for inactive leads.
Speed Wins: Leads contacted within 5 minutes convert 9x better than 30-minute responses.
Enablement is Partnership: Build playbooks, training, and content collaboratively with input from both teams.
PLG Changes the Game: In product-led models, PQLs (product usage signals) are more predictive than MQLs.
Calibrate Sales-Assist: Self-serve for low ACV, sales-assist for mid-market, full sales for enterprise.