We use cookies to enhance your browsing experience, serve personalized content, and analyze our traffic.
By clicking "Accept All", you consent to our use of cookies. See our
Privacy Policy
for more information.
Part 12 of 21: Building on growth hacking from Part 11, this article explores B2B marketing—the strategies, tactics, and frameworks for marketing to businesses and complex buying organizations.
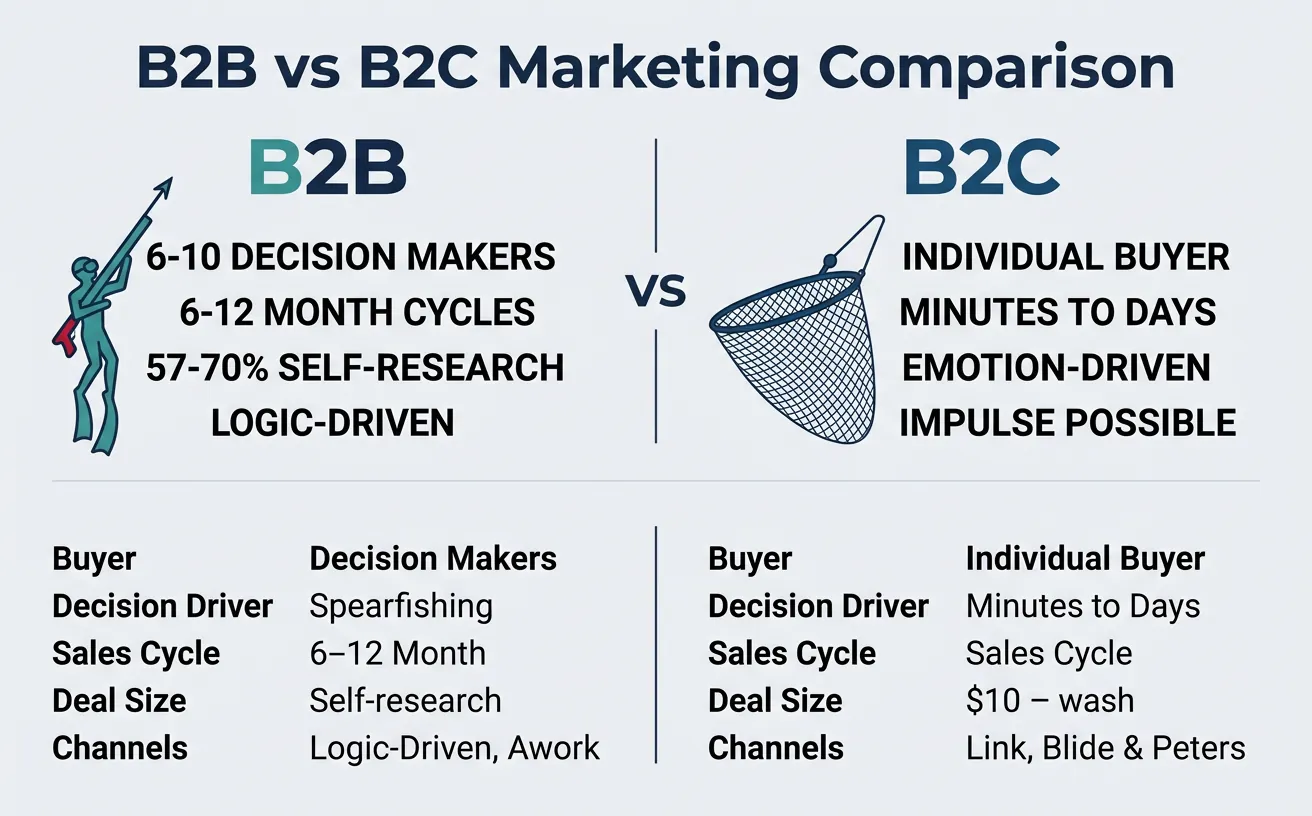
If B2C marketing is like fishing with a wide net — casting broadly and hoping for many catches — then B2B marketing is like spearfishing: you identify a specific, high-value target and pursue it with precision, patience, and a deep understanding of its behavior.
B2B vs B2C marketing: longer sales cycles, buying committees of 6-10 people, and ROI-driven decisions define enterprise marketing
The B2B Reality: In B2B, you're not selling to a person — you're selling to an organization. The average B2B purchase involves 6-10 decision-makers (Gartner), takes 6-12 months, and the buyer is typically 57-70% through the buying journey before even contacting sales (Forrester). Your marketing must educate, build trust, and align multiple stakeholders simultaneously.
Dimension
B2C Marketing
B2B Marketing
Buyer
Individual consumer
Buying committee (6-10 people)
Decision Driver
Emotion, brand, convenience
ROI, risk reduction, business impact
Sales Cycle
Minutes to days
3-18 months
Deal Size
$10-$500
$10K-$10M+
Relationship
Transactional
Long-term partnership
Content
Entertaining, aspirational
Educational, evidence-based
Channels
Social media, TV, retail
LinkedIn, events, direct outreach
Enterprise Buying Journey
The enterprise buying journey is rarely linear. Gartner research shows that B2B buyers loop through six jobs simultaneously, not sequentially. It's more like a maze than a funnel.
Buying Job
Buyer Question
Marketing Response
Content Type
Problem Identification
"Do we even have a problem?"
Thought leadership, industry reports
Blog posts, research reports
Solution Exploration
"What solutions exist?"
Category education, use cases
Webinars, guides, comparison pages
Requirements Building
"What do we need specifically?"
RFP support, needs assessment tools
Checklists, calculators, templates
Supplier Selection
"Who can deliver best?"
Proof points, competitive positioning
Case studies, testimonials, demos
Validation
"Can we trust this choice?"
Risk reduction, social proof
References, analyst reports, POC
Consensus Creation
"Can we all agree?"
Internal champion enablement
Executive summaries, ROI decks
Buying Committee Dynamics
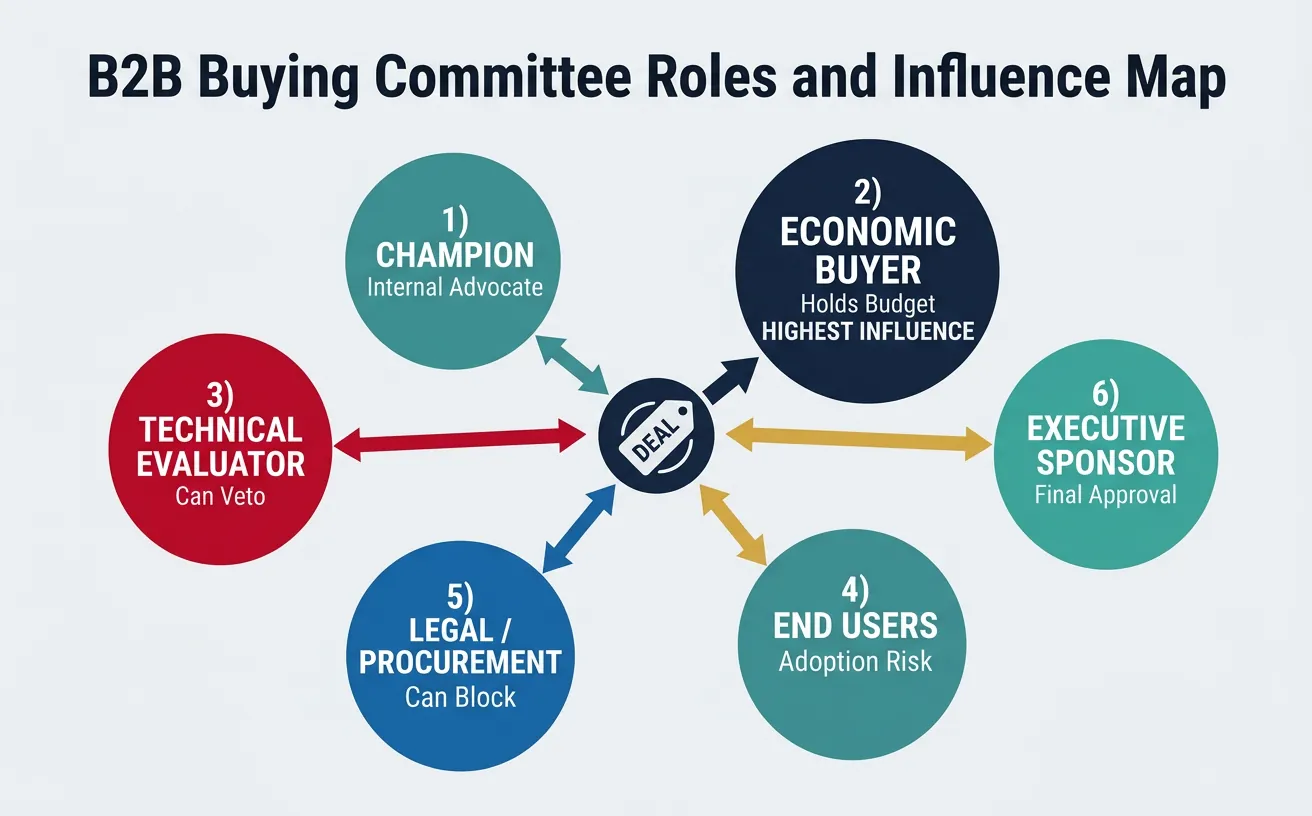
Every enterprise deal has a buying committee — a group of stakeholders who collectively influence the purchase decision. Think of it like a jury: you need to convince multiple people with different perspectives, priorities, and concerns.
The enterprise buying committee: champion, economic buyer, technical evaluator, end users, legal/procurement, and executive sponsor each require tailored engagement
Role
Their Priority
Influence Level
How to Engage
Champion
Solving their team's pain
High (internal advocate)
Arm with ROI data and internal pitch decks
Economic Buyer
Budget, ROI, risk
Highest (holds budget)
Executive briefings, financial models
Technical Evaluator
Integration, security, specs
High (can veto)
Technical docs, architecture reviews, POC
End Users
Ease of use, daily workflow
Medium (adoption risk)
Product demos, trial access, training
Legal/Procurement
Terms, compliance, vendor risk
Medium (can slow/block)
Standard contracts, compliance docs
Executive Sponsor
Strategic alignment
Highest (final approval)
Board-level reports, strategic vision
Case Study: HubSpot's Buyer Committee Strategy
B2B SaaS$2B+ Revenue
Challenge: HubSpot needed to move upmarket from SMBs to enterprise while keeping their product-led bottom-up motion.
Strategy: They created role-specific content hubs: separate messaging for CMOs (strategy + ROI), marketing managers (execution + features), and developers (APIs + integration). Each persona received a tailored buying journey with content mapped to their specific concerns.
Execution: Free CRM as the PLG wedge → users → data → identify accounts with multiple users → trigger ABM campaigns to the buying committee → enterprise sales team engages the economic buyer.
Results: Average deal size increased from $6K to $40K+ for enterprise deals. Multi-product adoption rate rose to 35%. Revenue grew from $883M (2020) to $2.17B (2023) — largely driven by moving upmarket with buying committee-aware strategy.
Account-Based Marketing
ABM Strategy
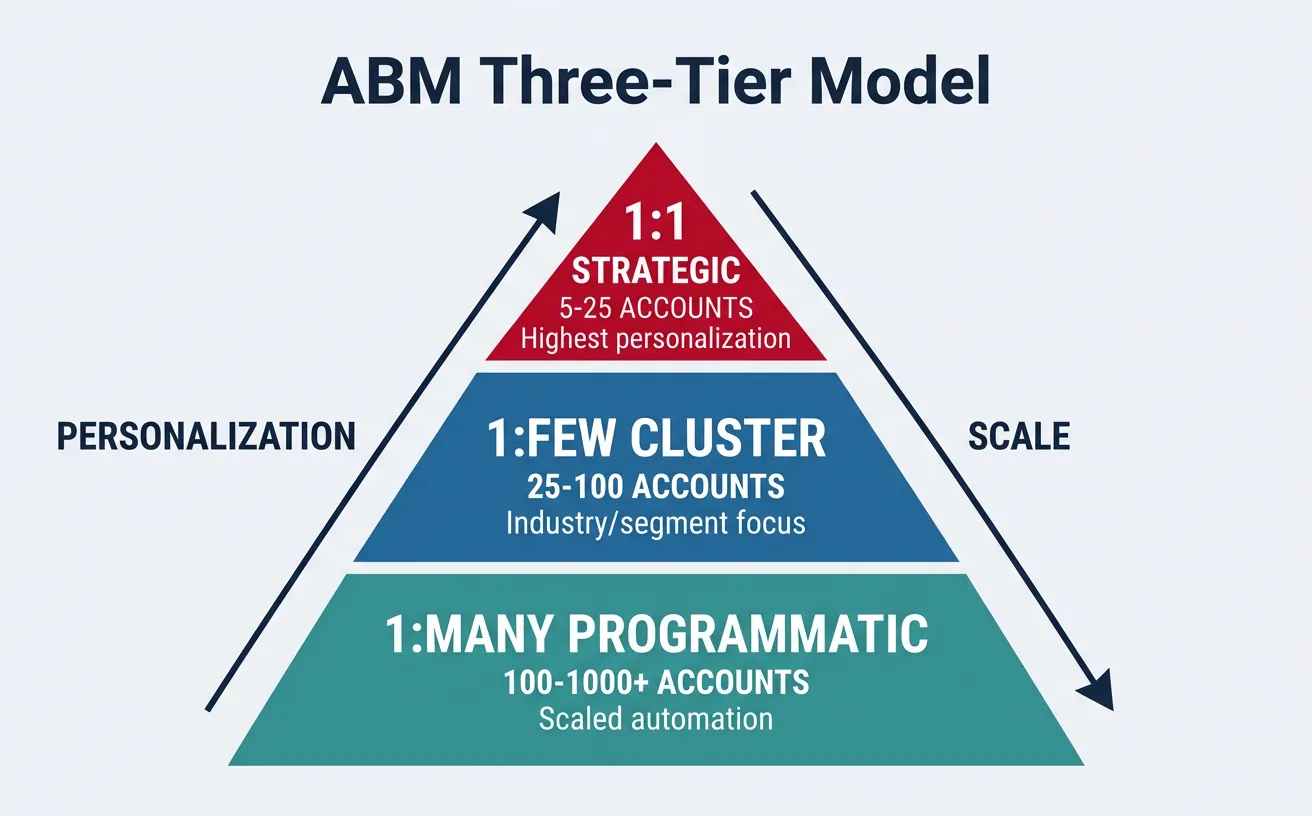
If demand generation is like fishing with bait — attracting anyone who bites — then ABM is like hunting with a target list: you know exactly which accounts you want and you pursue them with personalized precision. ABM flips the funnel: instead of generating leads and qualifying them, you start with your ideal accounts and work to engage them.
The ABM pyramid: 1:1 strategic (5-25 accounts), 1:Few cluster (25-100), and 1:Many programmatic (100-1,000+) tiers
ABM Tier
Accounts
Personalization
Investment
Best For
1:1 (Strategic)
5-25 accounts
Fully custom campaigns per account
$50K-$200K per account/year
Enterprise deals >$500K ACV
1:Few (Cluster)
25-100 accounts
Industry/segment-specific campaigns
$5K-$25K per account/year
Mid-market $50K-$500K ACV
1:Many (Programmatic)
100-1,000+ accounts
Technology-driven personalization
$500-$5K per account/year
SMB/commercial $5K-$50K ACV
ABM ROI Reality: According to ITSMA, 87% of marketers report ABM delivers higher ROI than any other marketing strategy. Companies with mature ABM programs generate 73% of total revenue from ABM-targeted accounts. But 1:1 ABM requires commitment — you need executive sponsorship, sales alignment, and 6+ month patience before seeing pipeline impact.
Account Selection & Prioritization
The most critical step in ABM isn't the campaign — it's choosing the right accounts. A brilliant campaign targeting the wrong accounts wastes resources. Account selection combines your Ideal Customer Profile (ICP) with data signals.
Selection Signal
Data Source
Weight
Example
Firmographic Fit
ZoomInfo, LinkedIn, D&B
30%
Industry, revenue, employee count, geography
Technographic Fit
BuiltWith, HG Insights
20%
Uses Salesforce, AWS, competitor tools
Intent Signals
Bombora, G2, TrustRadius
25%
Researching your category, visiting review sites
Engagement History
CRM, MAP, website analytics
15%
Past webinar attendees, content downloaders
Relationship Strength
Sales team intelligence
10%
Existing champions, warm introductions, alumni
ABM Execution
Case Study: Snowflake's ABM Engine
Account-Based Marketing$2.8B Revenue (FY2024)
Challenge: Snowflake needed to win Fortune 500 data platform deals against established competitors like Oracle, Teradata, and AWS Redshift.
ABM Strategy: They built a 3-tier ABM program — 1:1 for the top 50 enterprise accounts (custom microsites, executive dinners, bespoke ROI analyses), 1:Few for 200 mid-enterprise accounts grouped by industry, and 1:Many for 2,000+ commercial accounts using programmatic display + personalized email sequences.
Key Tactic: For 1:1 accounts, Snowflake created dedicated account pages showing custom benchmarks: "Companies in your industry using legacy data warehouses spend 3.2x more on maintenance than Snowflake customers." Each page was personalized with the prospect's company name, industry metrics, and competitor comparison.
Results: Net Revenue Retention Rate of 131% (existing customers expanded). 573 customers spending $1M+ annually. Pipeline from ABM accounts closed 2.4x faster than non-ABM pipeline.
ABM Channel
Tactic
Personalization Level
Typical Cost
Account-Based Advertising
Display ads targeting specific company IPs/accounts
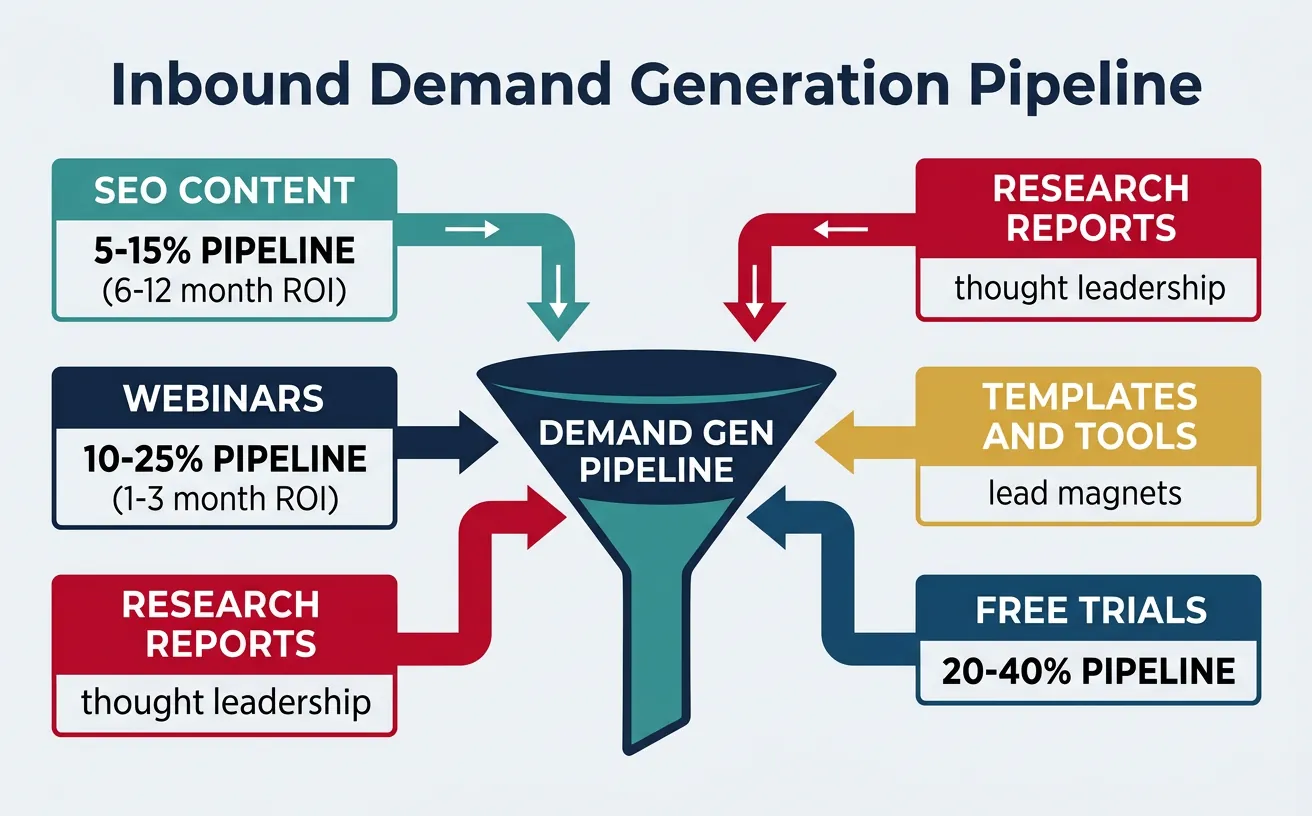
Inbound demand generation is like planting an orchard: it takes time to grow, but once mature, it produces fruit season after season with decreasing marginal effort. The goal is to create such valuable content and experiences that your ideal buyers come to you.
Inbound demand generation tactics and their pipeline impact: SEO (5-15%), webinars (10-25%), and free trials (20-40%) of qualified pipeline
Inbound Tactic
Funnel Stage
Expected Pipeline Impact
Time to ROI
SEO + Blog Content
Top of Funnel (TOFU)
5-15% of qualified pipeline
6-12 months
Webinars
Middle of Funnel (MOFU)
10-25% of qualified pipeline
1-3 months
Research Reports
TOFU-MOFU
5-10% of qualified pipeline
3-6 months
Gated Templates/Tools
MOFU
8-20% of qualified pipeline
2-4 months
Free Product / Trial
Bottom of Funnel (BOFU)
20-40% of qualified pipeline
1-3 months
The Dark Funnel: Up to 70% of the B2B buyer journey is invisible to your analytics (Forrester). Buyers research on podcasts, Slack communities, peer conversations, and private forums before ever visiting your website. This is the "dark funnel" — activity that influences decisions but can't be tracked. Smart demand gen creates ungated thought leadership that circulates in these dark channels, building brand preference before the buyer raises their hand.
Outbound Strategy
Outbound is the accelerant to inbound's foundation. While inbound builds long-term pipeline, outbound creates pipeline on demand. The best B2B companies run both in parallel.
Outbound Channel
Average Reply Rate
Best Practice
Tools
Cold Email
3-8%
Personalized first line, <130 words, clear CTA
Apollo, Outreach, Salesloft
LinkedIn Outreach
10-25%
Engage with content first, then connect with context
LinkedIn Sales Navigator
Cold Calling
2-5% connect rate
Call within 5 min of trigger event, use multi-touch
Challenge: Salesforce needed to maintain 20%+ growth while expanding from SMB to enterprise across 15+ product lines.
Demand Gen Architecture: Salesforce runs the most sophisticated multi-channel demand engine in SaaS. Their approach combines massive content production (Salesforce+, Trailhead, annual State of reports), events at scale (Dreamforce with 170K+ attendees), and programmatic ABM across thousands of target accounts.
Lead Scoring Innovation: They pioneered Einstein Lead Scoring — using AI to score leads based on behavioral and firmographic signals rather than arbitrary point systems. High-scoring leads are routed to AEs within minutes; lower-scoring leads enter nurture streams auto-personalized by industry and product interest.
Results:150,000+ customers, pipeline conversion rate improved 30% after deploying AI lead scoring. Trailhead alone created a community of 4M+ learning paths completed, generating inbound pipeline at near-zero marginal cost.
MQL vs SQL — The Great Debate: Traditional lead scoring passes leads from Marketing (MQL) to Sales (SQL) based on point thresholds. Modern B2B teams are moving toward buying group qualification — instead of scoring individual leads, they measure account-level engagement across the buying committee. An account becomes "qualified" when 3+ stakeholders from the buying committee show engagement signals within a 30-day window.
Sales Enablement
Content for Sales
Sales enablement content is the ammunition your sales team takes into battle. The best marketing teams don't just generate leads — they arm reps with the right content for every stage of the deal and every persona in the buying committee.
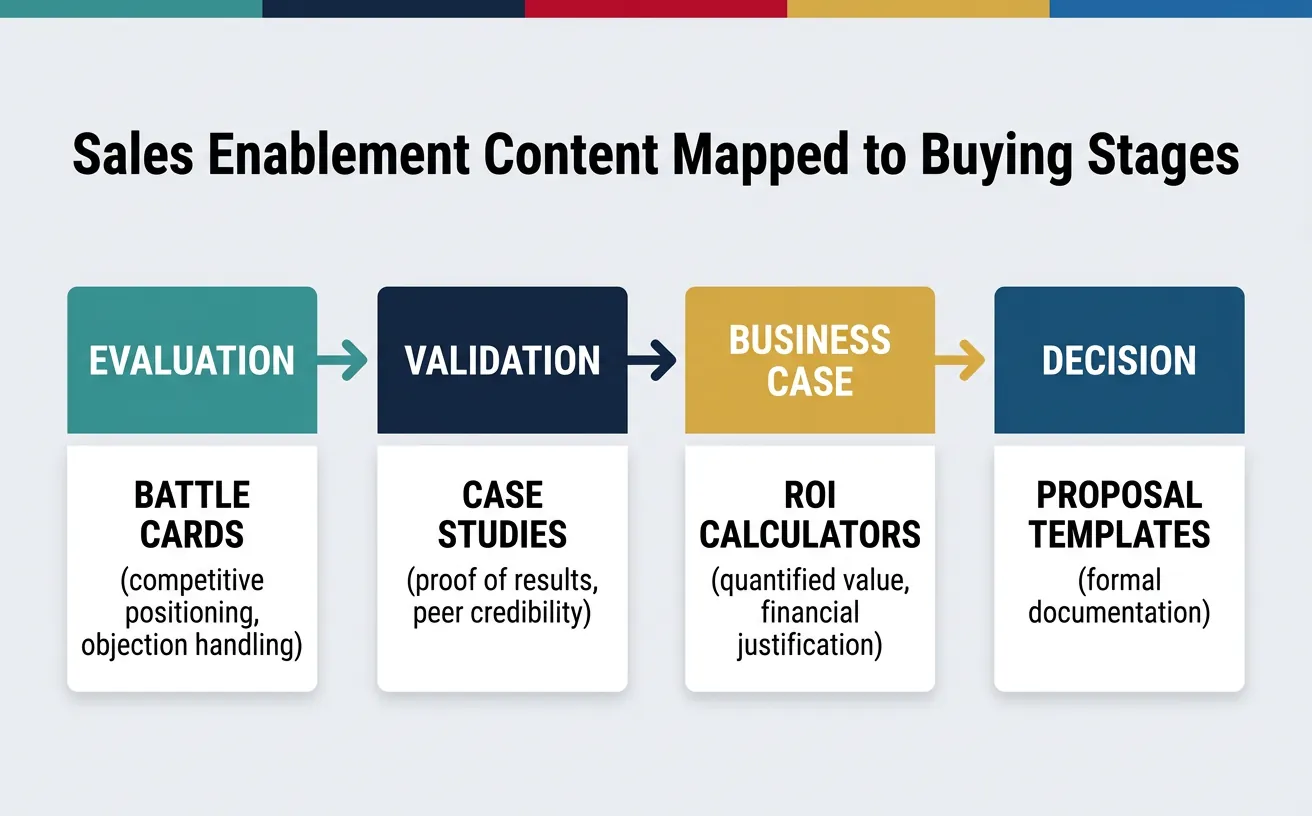
Sales enablement content mapped to buying stages: battle cards (evaluation), case studies (validation), ROI calculators (business case), and proposal templates (decision)
Content Type
Buying Stage
Target Persona
Usage
Battle Cards
Evaluation
Sales reps
Competitive positioning, objection handling
Case Studies
Validation
Champion + Economic Buyer
Proof of results, peer credibility
ROI Calculators
Business Case
Economic Buyer + CFO
Financial justification, budget approval
Technical White Papers
Requirements
Technical Evaluator
Architecture, security, integration details
Executive Summaries
Consensus
Executive Sponsor
1-page strategic value proposition
Proposal Templates
Decision
All stakeholders
Pricing, implementation plan, SLA
Marketing-Sales Alignment
The Alignment Gap: According to LinkedIn, 90% of sales and marketing professionals report misalignment across strategy, process, and content. This misalignment costs B2B companies an estimated 10% of revenue annually. The solution isn't just better communication — it's shared metrics, joint planning, and a service-level agreement (SLA) between the two teams.
Alignment Element
Marketing Commitment
Sales Commitment
Shared Metric
Lead Volume SLA
Deliver X qualified leads/month
Follow up within 4 hours
Lead-to-opportunity rate
Lead Quality SLA
Score leads using agreed criteria
Provide feedback on lead quality
SQL acceptance rate (%)
Content SLA
Update battle cards monthly
Report competitive intelligence
Content usage rate in deals
Pipeline SLA
Influence X% of pipeline
Attribute marketing touches
Marketing-sourced pipeline ($)
Revenue Operations
Revenue Operations (RevOps) is the operating system that unifies marketing, sales, and customer success into a single revenue engine. Instead of three separate departments with their own data, tools, and metrics, RevOps creates one shared view of the customer journey from first touch to renewal.
Case Study: Gong's RevOps-Driven Growth
Revenue Operations$7.2B Valuation
Challenge: Gong, the revenue intelligence platform, needed to practice what they preach — using data and alignment to drive their own growth from $50M to $250M ARR.
RevOps Model: Gong consolidated marketing ops, sales ops, and CS ops into a single RevOps team reporting to the CRO. They built a unified data model connecting all customer touchpoints — from first website visit through contract renewal — in a single Salesforce + Gong pipeline view.
Key Innovation: Using their own product, they analyzed millions of sales calls to identify winning patterns. Insights flowed from RevOps → marketing (for content creation) → sales (for coaching) → CS (for expansion playbooks). The entire organization operated from the same data and definitions.
Results:4,000+ customers, including 65% of the Fortune 500. Win rates improved 25% year-over-year. Cross-sell revenue increased 40% through RevOps-identified expansion signals.
RevOps Pillar
Pre-RevOps
With RevOps
Data
Siloed in MAP, CRM, CS tools
Unified data model, single source of truth
Process
Independent handoffs with gaps
Seamless journey, automated routing
Metrics
MQLs (mktg), ARR (sales), NPS (CS)
Shared revenue metrics: pipeline, net revenue retention
Tech Stack
50+ tools with manual integration
Integrated platform with automated data flow
Reporting
Each team reports different numbers
One dashboard, one truth, one forecast
Tools & Practice
B2B Strategy Canvas
Use this canvas to plan your B2B marketing strategy. Download as Word, Excel, PDF, or PowerPoint for your sales and marketing toolkit.
B2B Marketing Strategy Canvas
Design your B2B go-to-market engine and sales enablement plan. Download as Word, Excel, PDF, or PowerPoint.
Draft auto-saved
All data stays in your browser. Nothing is sent to or stored on any server.
Practice Exercises
Exercise 1: Buying Committee Mapping
Choose a B2B product you know well (CRM, cloud platform, security tool). Map the buying committee for a $200K enterprise deal:
Identify 6+ stakeholder roles and their specific priorities
Create a contact matrix showing which marketing channels reach each stakeholder
Design 3 pieces of role-specific content for the Champion, Economic Buyer, and Technical Evaluator
Define the "consensus creation" strategy — how does the champion sell internally?
Exercise 2: ABM Campaign Design
Design a 90-day 1:Few ABM campaign targeting 15 financial services companies for a compliance SaaS platform ($100K ACV):
Define the ICP with firmographic + technographic + intent signals
Select 5 ABM channels and design the specific tactic for each
Create a 12-touch multi-channel sequence spanning email, LinkedIn, direct mail, and events
Calculate conversion rates between each stage and identify the biggest drop-off
Propose 3 process changes that would improve the weakest conversion point
Key Takeaways
B2B is selling to committees, not individuals — map the 6-10 stakeholders and create role-specific messaging for each persona
ABM delivers the highest ROI — 87% of marketers report ABM outperforms all other strategies, but it requires 6+ months of patient execution
Intent data changes the game — combine firmographic fit with behavioral signals to identify accounts in active buying mode
The dark funnel is real — 70% of the buyer journey is invisible. Create ungated thought leadership that circulates in communities and peer networks
Qualification frameworks matter — MEDDIC improves enterprise win rates 15-20% vs basic BANT by forcing rigorous discovery
Content is sales enablement — battle cards, ROI calculators, and case studies are the ammunition that win deals, not just blog posts
Marketing-Sales alignment = 10% revenue — shared SLAs, joint metrics, and regular feedback loops close the alignment gap
RevOps unifies the engine — consolidating marketing ops, sales ops, and CS ops into one team with one data model eliminates silos and accelerates revenue
Continue the Series
Part 11: Growth Hacking & Experimentation
Apply growth tactics to B2B acquisition and activation.