We use cookies to enhance your browsing experience, serve personalized content, and analyze our traffic.
By clicking "Accept All", you consent to our use of cookies. See our
Privacy Policy
for more information.
Part 8 of 21: Building on email automation from Part 7, this article explores paid advertising—scaling acquisition through paid search, social advertising, programmatic buying, and account-based advertising strategies.
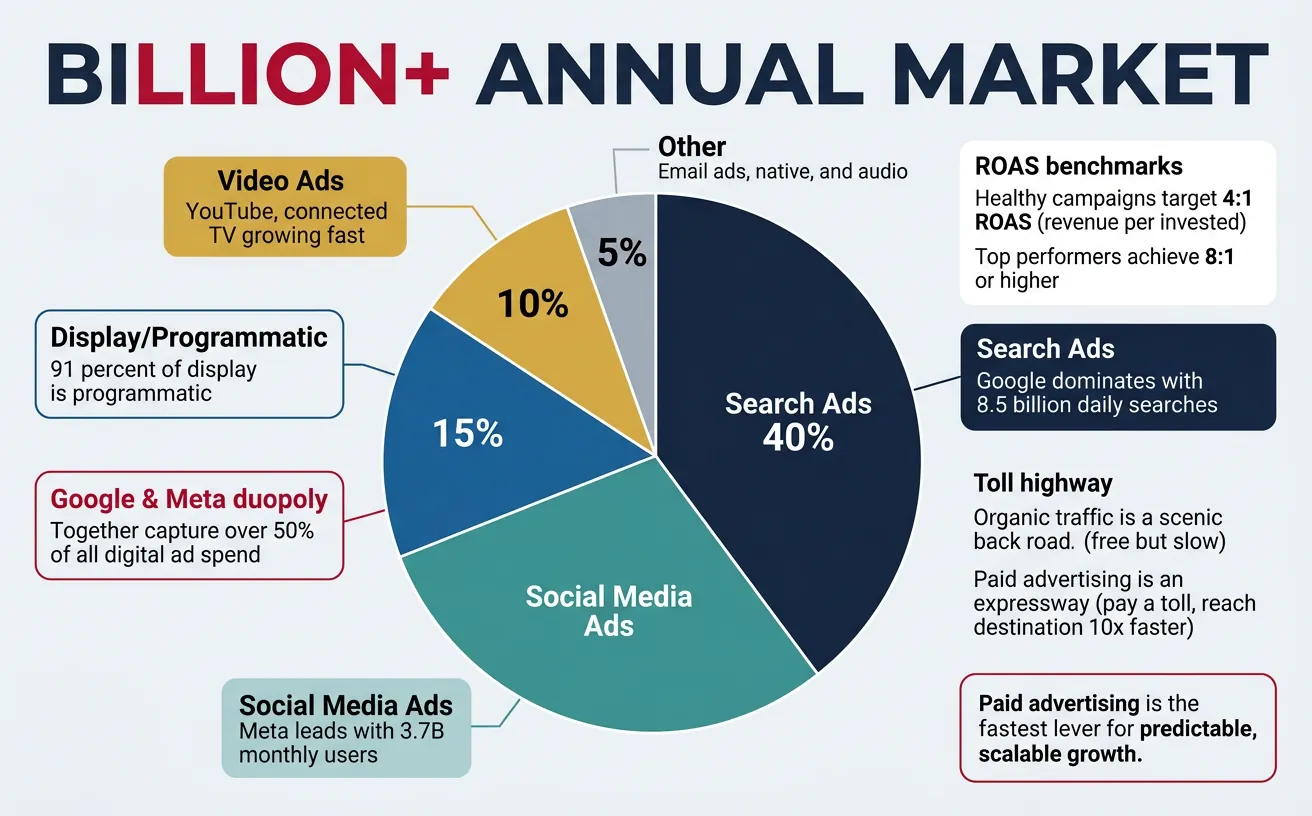
Think of paid advertising like a toll highway. Organic traffic is the scenic back road — free but slow. Paid advertising is the expressway — you pay a toll, but you reach your destination 10x faster. The skill is knowing which highway to take, when to accelerate, and how to avoid expensive dead ends.
The global digital advertising market exceeds $600 billion annually, with Google and Meta capturing over 50% of all digital ad spend. Understanding paid advertising isn't optional for marketers — it's the fastest lever for predictable, scalable growth.
The $600B+ digital advertising market: Google and Meta capture over 50% of total spend across search, social, and display
The ROAS Imperative: Every dollar you spend on advertising should generate measurable returns. The benchmark for healthy paid campaigns is a 4:1 ROAS (Return on Ad Spend) — $4 revenue for every $1 invested. Top performers achieve 8:1 or higher.
PPC Fundamentals & Auction Mechanics
Pay-per-click (PPC) advertising operates on an auction model. When a user searches for "best project management software," an instant auction determines which ads appear, in what order, and at what cost. Understanding this auction is the foundation of all paid advertising mastery.
Auction Factor
What It Measures
Impact
How to Optimize
Max Bid
Maximum you'll pay per click
30% of Ad Rank
Start low, increase based on conversion data
Quality Score
Ad relevance + CTR + landing page
50% of Ad Rank
Match keywords → ad copy → landing page
Expected CTR
Predicted click-through rate
Within Quality Score
Compelling headlines, relevant extensions
Ad Relevance
How closely ad matches search intent
Within Quality Score
Tight keyword-to-ad group matching
Landing Page
Experience quality and relevance
Within Quality Score
Fast load, mobile-friendly, relevant content
Ad Extensions
Additional info (sitelinks, callouts)
20% boost to Ad Rank
Use all relevant extension types
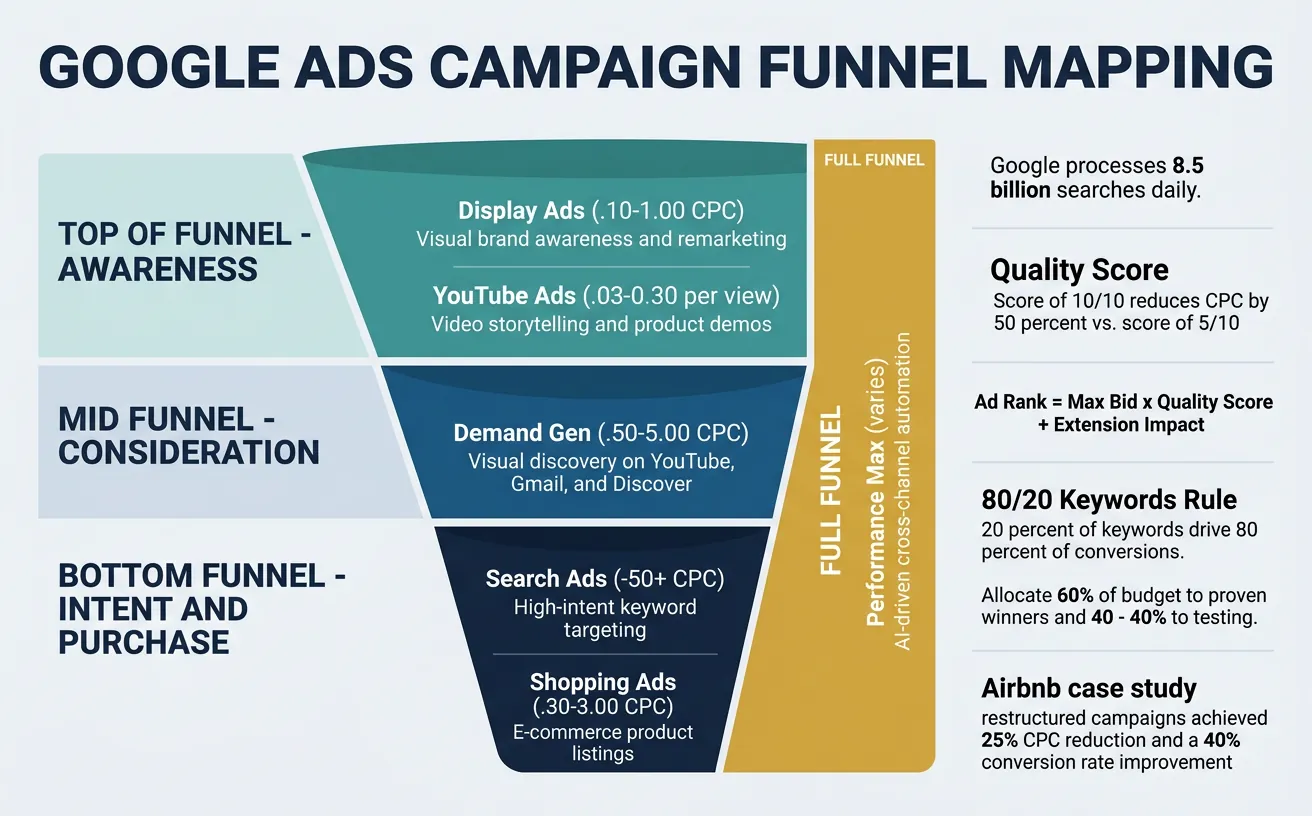
The Quality Score Multiplier: A Quality Score of 10/10 can reduce your CPC by 50% compared to a score of 5/10. Advertisers with high Quality Scores literally pay half the price for the same ad position. Ad Rank = Max Bid × Quality Score + Extension Impact. You win not by outbidding, but by out-relevancing.
Bidding Strategy Framework
Strategy
Best For
How It Works
Risk Level
Manual CPC
New campaigns, full control
You set each keyword bid manually
Low (but labor-intensive)
Enhanced CPC
Transitioning to automation
Google adjusts bids ±30% based on conversion likelihood
Medium
Target CPA
Conversion-focused campaigns
Bids auto-adjust to hit target cost per acquisition
Medium (needs 30+ conversions/month)
Target ROAS
E-commerce, revenue optimization
Bids optimized for revenue return target
High (needs 50+ conversions/month)
Maximize Conversions
Budget constraints, volume focus
Spends full budget maximizing conversion count
High (can exhaust budget quickly)
Google Ads
Google Ads is the world's largest advertising platform, processing over 8.5 billion searches daily. It offers campaign types for every stage of the marketing funnel — from awareness (Display, YouTube) to consideration (Search) to purchase (Shopping, Performance Max).
Google Ads campaign types mapped to funnel stages: Display and YouTube (awareness) → Search (consideration) → Shopping and Performance Max (purchase)
Campaign Type Architecture
Campaign Type
Funnel Stage
Best For
Avg. CPC Range
Search
Bottom (Intent)
High-intent keyword targeting
$1–$50+ (industry dependent)
Shopping
Bottom (Purchase)
E-commerce product listings
$0.30–$3.00
Display
Top (Awareness)
Visual brand awareness, remarketing
$0.10–$1.00
YouTube
Top–Mid (Consideration)
Video storytelling, product demos
$0.03–$0.30 per view
Performance Max
Full Funnel
AI-driven cross-channel automation
Varies by signal
Demand Gen
Mid (Engagement)
Visual discovery on YouTube, Gmail, Discover
$0.50–$5.00
Case Study: How Airbnb Restructured Google Ads
Paid Search$100M+ Annual Spend
Challenge: Airbnb's search campaigns were organized by location, creating thousands of overlapping ad groups with cannibalized keywords and inconsistent Quality Scores.
Strategy: They restructured campaigns using a SKAG-to-STAG migration (Single Keyword Ad Groups → Single Theme Ad Groups), grouping semantically related keywords. They also implemented Performance Max for cross-channel reach and used first-party data audiences for bid adjustments.
Results: 25% reduction in CPC, 40% improvement in conversion rate, and the ability to scale spend profitably across 200+ markets. Their Quality Score average improved from 6.2 to 8.4.
The 80/20 Keywords Rule: In most Google Ads accounts, 20% of keywords drive 80% of conversions. Identify your "hero keywords" early. Build dedicated landing pages for them. Allocate 60% of budget to proven winners and 40% to testing new opportunities.
Microsoft Ads (Bing)
Microsoft Ads reaches 63 million searchers not reached by Google. With lower competition and CPCs averaging 30–40% less than Google, it's often the highest-ROAS search platform for many advertisers.
Microsoft's Hidden Advantage: Bing users skew older (35–65), higher income, and more desktop-heavy than Google users. For industries like finance, insurance, healthcare, and B2B enterprise software, Microsoft Ads often delivers 2–3x better ROAS than Google at 40% lower CPCs. Plus, LinkedIn profile targeting (job title, company, industry) is exclusive to Microsoft Ads.
Social Advertising
Meta Ads (Facebook & Instagram)
Meta's advertising platform reaches 3.7 billion monthly active users across Facebook, Instagram, Messenger, and the Audience Network. Its strength lies in unparalleled audience targeting powered by behavioral data, interest graphs, and lookalike modeling.
Meta Ads campaign hierarchy: Campaign (objective) → Ad Set (targeting and budget) → Ad (creative execution)
Meta Ads Campaign Structure
Meta organizes campaigns in a three-tier hierarchy — Campaign → Ad Set → Ad. Think of it like a military structure: the Campaign is the mission objective, Ad Sets are the platoons (each with different targeting), and Ads are the individual soldiers executing tactics.
Campaign Objective
Funnel Stage
Best Formats
Typical CPM Range
Awareness
Top of Funnel
Video, Stories, Reels
$5–$15
Traffic
Mid Funnel
Link ads, Carousel, Collection
$8–$20
Engagement
Mid Funnel
Image, Video, Polls
$3–$10
Leads
Mid–Bottom Funnel
Lead forms, Messenger, Instant articles
$15–$40
Sales / Conversions
Bottom Funnel
Dynamic product ads, Collection
$15–$50
The Advantage+ Secret: Meta's AI-powered Advantage+ campaigns (formerly CBO + broad targeting) now outperform manual targeting for most advertisers. Instead of micro-targeting audiences, give Meta broad parameters and let its algorithm find converters. Advertisers using Advantage+ Shopping report 32% lower CPA on average.
Case Study: Dollar Shave Club's Meta Ads Playbook
Meta Ads$1B Acquisition by Unilever
Strategy: Dollar Shave Club built their entire subscriber base primarily through Facebook and YouTube ads. Their approach used a 3-phase creative testing system:
Phase 1 — Hook Testing: 10+ video hooks tested weekly, keeping only those with 3-second view rate >65%
Phase 2 — Body Optimization: Winning hooks paired with different value propositions
Phase 3 — Scale: Top 3 creatives scaled with broad targeting + lookalike audiences
Results: 3.2 million subscribers acquired before the Unilever acquisition. Their ad creative refresh cadence (weekly) prevented creative fatigue, maintaining 4.2x ROAS at scale.
LinkedIn Ads
LinkedIn is the #1 B2B advertising platform, with access to 1 billion professional profiles including job titles, company size, industry, seniority, and skills data unavailable on any other platform. CPCs are 3–5x higher than Meta, but conversion quality for B2B is unmatched.
Ad Format
Best For
Avg. CPC
Pro Tip
Sponsored Content
Thought leadership, brand awareness
$8–$15
Single image with hook outperforms carousel for CTR
Message Ads (InMail)
Direct outreach, event invites
$0.50–$1.00 per send
Keep under 500 characters, personalize first line
Lead Gen Forms
Whitepaper downloads, webinar signups
$30–$80 per lead
Pre-filled forms have 5x higher conversion rate
Document Ads
Case studies, playbooks
$6–$12
Gate after 3 pages — give value first
Conversation Ads
Multi-path engagement
$0.30–$0.50 per send
Use "choose your own adventure" CTAs (2-3 options)
LinkedIn Targeting Stack: The most powerful LinkedIn targeting combines Job Function + Seniority + Company Size + Industry. For enterprise B2B (selling to Fortune 500 CMOs), target: Marketing function + VP/C-Suite seniority + 10,000+ employee companies + your target industries. This creates laser-focused audiences of 5,000–50,000 decision-makers, delivering $50–$150 CPLs that close at 5–10x the rate of Google leads.
TikTok & Emerging Platforms
TikTok Ads reach 1.5+ billion users with the lowest CPMs in social advertising — often 50–70% cheaper than Meta. The platform's algorithm-driven distribution means creative quality matters more than audience targeting.
Platform
Unique Strength
Avg. CPM
Best For
TikTok
Algorithm-driven viral reach, Spark Ads
$3–$8
D2C brands, Gen Z/Millennial audiences
Reddit
Community-based, interest targeting
$2–$6
Tech, gaming, finance, niche interests
Pinterest
High purchase intent, visual discovery
$5–$12
Home decor, fashion, food, weddings
Snapchat
AR filters, young demographics
$2–$5
CPG, entertainment, mobile apps
X (Twitter)
Real-time conversation targeting
$6–$15
News, events, B2B thought leadership
TikTok's "Don't Make Ads, Make TikToks" Rule: Native-feeling content outperforms polished ads by 2.5x on TikTok. Use Spark Ads (boosting organic creator content) instead of traditional ad formats. The first 2 seconds determine everything — lead with conflict, surprise, or a bold claim. TikTok's Creative Center shows trending formats, sounds, and hooks updated daily.
Programmatic & Display
Programmatic Buying
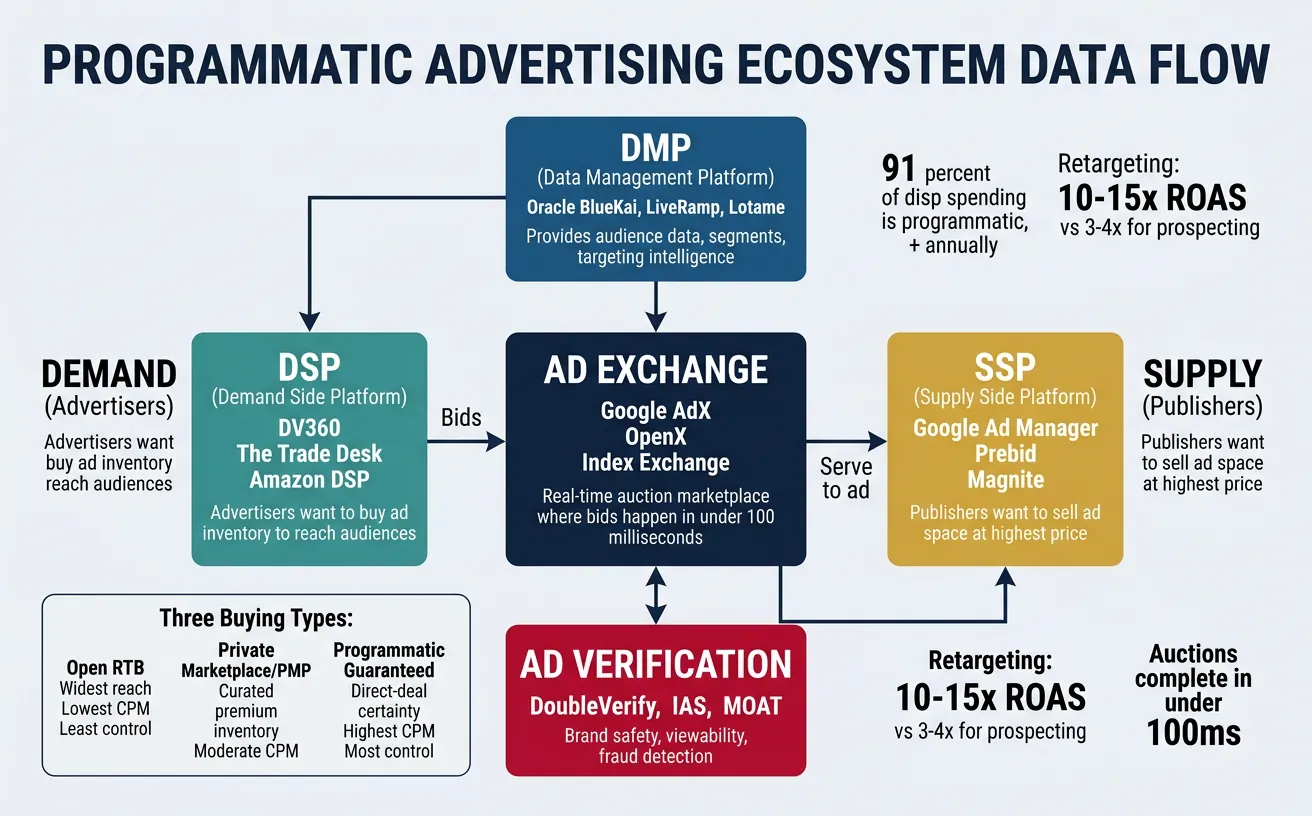
Think of programmatic advertising like a stock exchange for ad inventory. Instead of manually negotiating ad placements with publishers, algorithms buy and sell ad impressions in real-time auctions — each auction completing in under 100 milliseconds, before the webpage finishes loading.
Programmatic advertising accounts for 91% of display ad spending in the US, representing over $150 billion annually. Understanding the ecosystem is essential for any marketer managing significant display or video budgets.
The programmatic ecosystem: DSP (demand) ↔ Ad Exchange ↔ SSP (supply), with DMP providing audience data for targeting
The Programmatic Ecosystem
Component
What It Does
Key Players
Marketer Role
DSP (Demand-Side Platform)
Advertisers bid on ad inventory
DV360, The Trade Desk, Amazon DSP
Set targeting, budgets, bid floors
SSP (Supply-Side Platform)
Publishers sell their ad inventory
Google Ad Manager, Prebid, Magnite
Select quality publishers
Ad Exchange
Marketplace connecting DSPs and SSPs
Google AdX, OpenX, Index Exchange
Monitor fill rates and CPMs
DMP (Data Platform)
Manages audience data for targeting
Oracle BlueKai, LiveRamp, Lotame
Build and activate audience segments
Ad Verification
Ensures brand safety, viewability
DoubleVerify, IAS, MOAT
Set viewability and safety thresholds
RTB vs. Private Marketplace vs. Direct:Open RTB (Real-Time Bidding) gives widest reach at lowest CPMs but least control. Private Marketplaces (PMPs) offer curated inventory from premium publishers with fixed floor prices. Programmatic Guaranteed gives direct-deal certainty with programmatic efficiency. Start with PMPs for brand safety, then expand to open exchange for scale.
Retargeting & Remarketing
Retargeting converts warm visitors into buyers by showing ads to people who've already visited your website, opened your emails, or engaged with your content. It's the highest-ROAS tactic in digital advertising — typical retargeting campaigns achieve 10–15x ROAS compared to 3–4x for prospecting.
Retargeting Type
How It Works
Best Platforms
Typical ROAS
Pixel-Based
Cookie/pixel tracks site visitors
Google, Meta, LinkedIn
8–15x
List-Based
Upload email/phone lists to match
Meta Custom Audiences, Google Customer Match
10–20x
Dynamic Product
Shows exact products viewed/carted
Meta DPA, Google Dynamic Remarketing
12–25x
Sequential
Story-based ad sequence over time
YouTube, Meta, DV360
5–10x
Cross-Device
Follows users across mobile/desktop
The Trade Desk, DV360
6–12x
The Frequency Cap Rule: Showing retargeting ads more than 7–10 times per user per week leads to ad fatigue and brand damage. Set frequency caps: 3–5 per day for awareness, 1–2 for retargeting. Rotate creative every 7–14 days. Use recency windows — users who visited 1–3 days ago convert at 3x the rate of those from 14+ days ago.
Native Advertising
Native ads match the look, feel, and function of the media format they appear in. They generate 53% higher engagement than traditional display ads because they feel like content rather than interruptions.
Native Format
Where It Appears
Key Platforms
Avg. CTR
In-Feed Ads
Within content feeds (news, social)
Taboola, Outbrain, Meta
0.3–0.8%
Content Recommendation
"You May Also Like" widgets
Taboola, Outbrain, Revcontent
0.1–0.4%
Sponsored Content
Publisher editorial sections
Forbes BrandVoice, NYT T Brand Studio
1.0–3.0%
Search Native
Promoted search results
Google, Amazon, App Store
2.0–5.0%
The Native Content Test: If you removed the "Sponsored" label, would a reader think the content was editorial? If yes, your native ad is working. The best native ads provide genuine value — they educate, entertain, or solve a problem first, then connect to the brand. Treat native advertising as content marketing with paid distribution.
Advanced Strategies
Account-Based Advertising
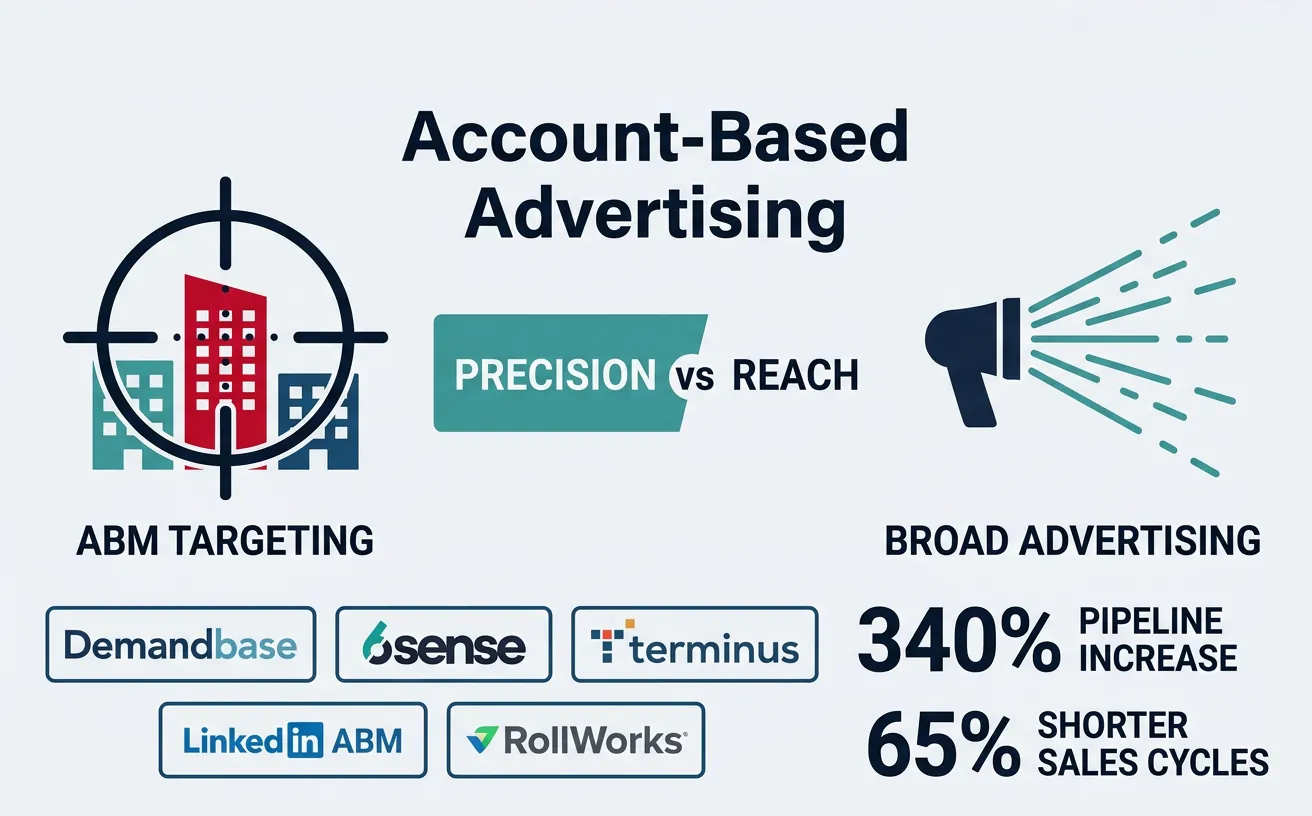
Account-Based Advertising (ABA) targets specific companies and decision-makers rather than broad demographics. It's the sniper rifle vs. the shotgun — you spend more per impression but achieve dramatically higher conversion rates because every impression reaches a named target account.
Account-based advertising targets named companies with personalized messaging — precision over volume for higher conversion rates
ABA Platform
Targeting Method
Best For
Min. Budget
Demandbase
IP-based, intent signals, firmographic
Enterprise ABM, display advertising
$3,000+/month
6sense
AI intent, predictive analytics
Enterprise with complex buying cycles
$5,000+/month
Terminus
Multi-channel ABM orchestration
Mid-market B2B, multi-touch campaigns
$2,000+/month
LinkedIn ABM
Company name, job title, matched audiences
All B2B, custom audience targeting
$500+/month
RollWorks
Firmographic + intent + engagement scoring
Growth-stage B2B, integrated ABM
$1,500+/month
Case Study: Snowflake's ABM Advertising Strategy
Account-Based$2.8B Revenue (2024)
Challenge: Snowflake needed to reach specific data engineering leaders at Fortune 2000 companies — a tiny audience but massive deal sizes ($200K–$5M+ ACV).
Strategy: They used a 3-tier ABM pyramid:
Tier 1 (Top 50 accounts): Fully personalized campaigns with custom landing pages, 1:1 display ads showing the target's company name, LinkedIn InMail from executive sponsors
Tier 2 (200 accounts): Industry-personalized content with company-level targeting via Demandbase and LinkedIn
Tier 3 (2,000 accounts): Programmatic display using firmographic and intent signals
Results: 340% increase in pipeline from target accounts, 65% shorter sales cycles, and 4.2x higher deal sizes compared to non-ABM sources. Their cost-per-opportunity was 60% lower than broad-based campaigns.
Cross-Channel Campaign Management
The average B2B buyer engages with 6–8 touchpoints before converting. Cross-channel advertising orchestrates a unified experience across search, social, display, video, and email to guide prospects through the funnel.
The Surround Sound Strategy: Instead of siloing budgets by channel, allocate based on funnel stage:
The difference between a 2x ROAS campaign and a 10x ROAS campaign isn't budget — it's systematic optimization. The top 10% of advertisers follow a weekly optimization cadence that compounds improvements over time.
The PACE Optimization Framework
P — Performance Audit: Weekly review of KPIs by campaign, ad set, and creative. Pause anything below 70% of target ROAS after 2 weeks of data.
A — Audience Refinement: Analyze converting audiences weekly. Build lookalikes from top 25% purchasers. Exclude converters from prospecting campaigns.
C — Creative Refresh: Replace bottom 25% performing creatives every 2 weeks. Test 2–3 new variations weekly. Creative fatigue sets in after 7–14 days at scale.
E — Expansion Testing: Allocate 20% of budget to test new channels, audiences, or formats. Graduate winners to core campaigns at 30-day cadence.
Key Optimization Metrics
Metric
Formula
Good Benchmark
Action If Below
CTR
Clicks ÷ Impressions
Search: 3–5%, Social: 0.8–1.5%
Improve ad copy, test new creative
CPC
Spend ÷ Clicks
Industry specific
Improve Quality Score, refine targeting
Conversion Rate
Conversions ÷ Clicks
Search: 3–5%, Social: 1–3%
Optimize landing page, refine audience
ROAS
Revenue ÷ Ad Spend
4x+ (target specific)
Shift budget to top performers
CPA / CAC
Total Spend ÷ Conversions
Below LTV/3
Pause low-performing ad sets
Impression Share
Your Impressions ÷ Total Available
Brand: 90%+, Non-brand: 60%+
Increase bids or budget
Tools & Practice
Ad Campaign Strategy Canvas
Use this canvas to plan your paid advertising strategy. Download as Word, Excel, PDF, or PowerPoint for your campaign toolkit.
Ad Campaign Strategy Canvas
Plan your cross-channel paid advertising strategy. Download as Word, Excel, PDF, or PowerPoint.
Draft auto-saved
All data stays in your browser. Nothing is sent to or stored on any server.
Practice Exercises
Exercise 1: Google Ads Campaign Architecture
Design a Google Ads account structure for a B2B SaaS company selling project management software at $49/month. Include:
3 campaign types (Search, Display, YouTube) with objectives
5 ad groups per search campaign with 3 keywords each
Bidding strategy selection with justification
Budget allocation across campaigns
3 ad extensions per campaign
Exercise 2: Multi-Platform Retargeting Sequence
Map a 30-day cross-channel retargeting sequence for an e-commerce brand selling athletic wear:
Day 1–3 messaging and creative strategy
Day 4–7 offer escalation plan
Day 8–14 platform-specific tactics (Meta, Google, TikTok)
Day 15–30 win-back sequence for non-converters
Frequency caps and creative rotation schedule
Exercise 3: Cross-Channel Budget Optimization
Given a $20,000/month paid media budget, design a cross-channel strategy for a D2C skincare brand:
Platform selection with percentage allocations and rationale
Campaign objectives by funnel stage (awareness → conversion)
ROAS targets by channel based on industry benchmarks
Monthly optimization cadence using the PACE framework
Quarterly review triggers for budget reallocation
Key Takeaways
Quality Score is king — a 10/10 Quality Score cuts CPC by 50%. Invest in relevance over bigger bids
Start with high-intent channels — Google Search captures demand; social creates demand. Build capture first
Creative beats targeting — on algorithm-driven platforms (TikTok, Meta Advantage+), creative quality determines 80% of results
Retargeting is your highest-ROAS lever — 10–15x ROAS vs. 3–4x for prospecting. Always fund retargeting first
The 70/20/10 Budget Rule — 70% proven channels, 20% scaling winners, 10% testing new platforms
Frequency caps prevent brand damage — 3–5 impressions/day max for retargeting, refresh creative every 7–14 days
Cross-channel attribution changes everything — no single platform gets full credit. Use multi-touch models (Part 9)
ABM for enterprise B2B — account-based advertising delivers 340% more pipeline at 60% lower cost per opportunity
Continue the Series
Part 7: Email Marketing & Automation
Master email strategy, automation workflows, and CRM integration.
Social Advertising
Meta Ads (Facebook & Instagram)
Meta's advertising platform reaches 3.7 billion monthly active users across Facebook, Instagram, Messenger, and the Audience Network. Its strength lies in unparalleled audience targeting powered by behavioral data, interest graphs, and lookalike modeling.
Meta Ads Campaign Structure
Meta organizes campaigns in a three-tier hierarchy — Campaign → Ad Set → Ad. Think of it like a military structure: the Campaign is the mission objective, Ad Sets are the platoons (each with different targeting), and Ads are the individual soldiers executing tactics.
Case Study: Dollar Shave Club's Meta Ads Playbook
Strategy: Dollar Shave Club built their entire subscriber base primarily through Facebook and YouTube ads. Their approach used a 3-phase creative testing system:
Results: 3.2 million subscribers acquired before the Unilever acquisition. Their ad creative refresh cadence (weekly) prevented creative fatigue, maintaining 4.2x ROAS at scale.
LinkedIn Ads
LinkedIn is the #1 B2B advertising platform, with access to 1 billion professional profiles including job titles, company size, industry, seniority, and skills data unavailable on any other platform. CPCs are 3–5x higher than Meta, but conversion quality for B2B is unmatched.
TikTok & Emerging Platforms
TikTok Ads reach 1.5+ billion users with the lowest CPMs in social advertising — often 50–70% cheaper than Meta. The platform's algorithm-driven distribution means creative quality matters more than audience targeting.