Pricing Fundamentals
Marketing & Strategy Mastery
Marketing Fundamentals & Strategic Foundations
Value creation, evolution, STP, 4Ps/7Ps, PMFConsumer & Buyer Psychology
Behavioral economics, cognitive biases, trustBrand Building & Positioning
Identity, architecture, storytelling, thought leadershipSEO & Search Marketing
Technical SEO, intent mapping, AI searchContent Marketing Mastery
Strategy, editorial systems, content ROISocial Media & Community Strategy
Platform strategies, influencer partnershipsEmail Marketing & Automation
Lifecycle, nurturing, CRM integrationPaid Advertising Systems
PPC, social ads, account-based advertisingAnalytics, Attribution & Marketing Science
Funnel analytics, attribution modelsConversion Rate Optimization (CRO)
Landing pages, A/B testing, UXGrowth Hacking & Experimentation
Growth loops, viral systems, PLGB2B Marketing & Enterprise Strategy
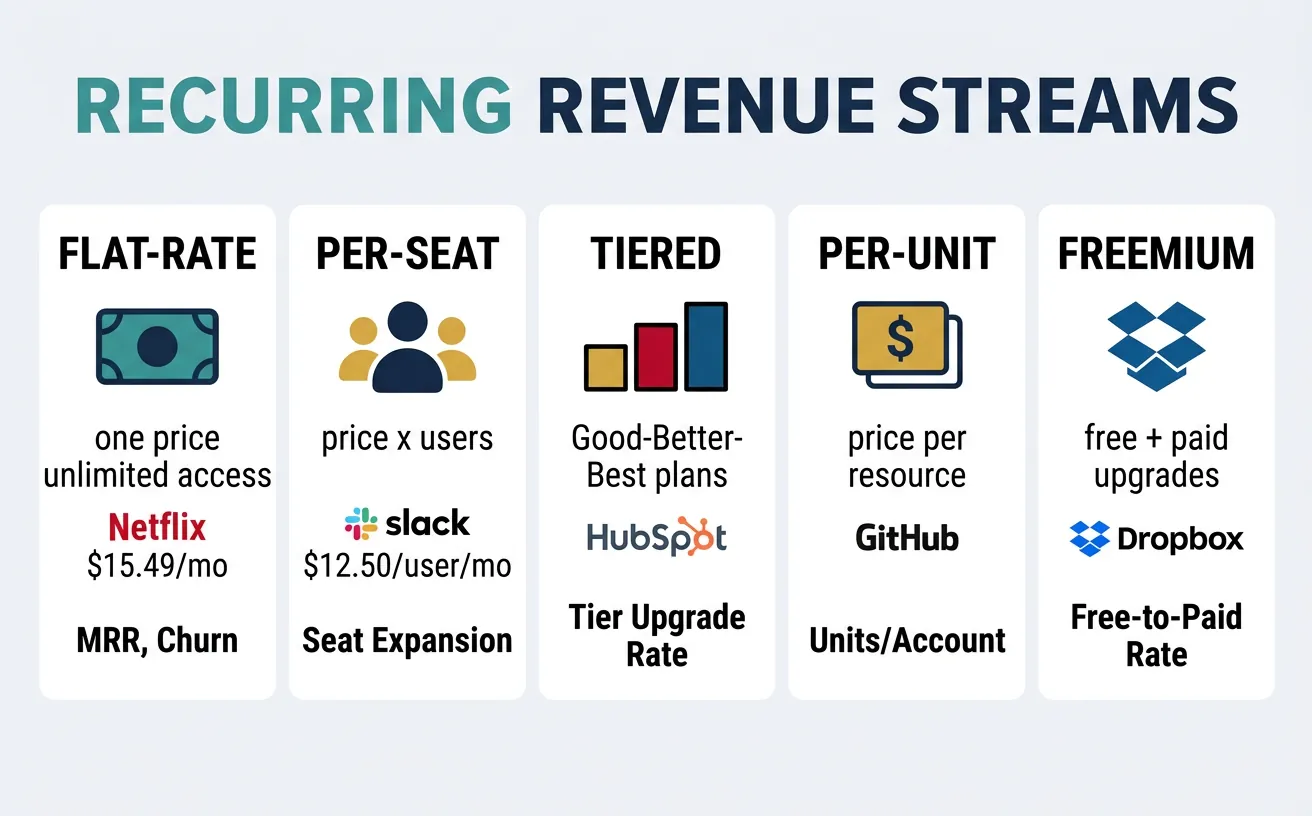
ABM, demand gen, sales enablementPricing Strategy & Revenue Models
Value-based pricing, SaaS tiers, bundlingDistribution Strategy
Channel strategy, affiliates, ecosystem positioningConsulting-Level Strategic Analysis
Porter's 5 Forces, SWOT, PESTLEProduct Marketing & Go-To-Market
Launch strategy, GTM frameworks, PMMMarketing Finance & Planning
Budget, CAC payback, ROI modelingPersonal Branding & Thought Leadership (B2P)
Authority, monetization, creator economicsOffline & Traditional Marketing
Events, PR, broadcast, direct mailScaling & Strategic Leadership
Global expansion, organizational designIntegrated Marketing Strategy Capstone
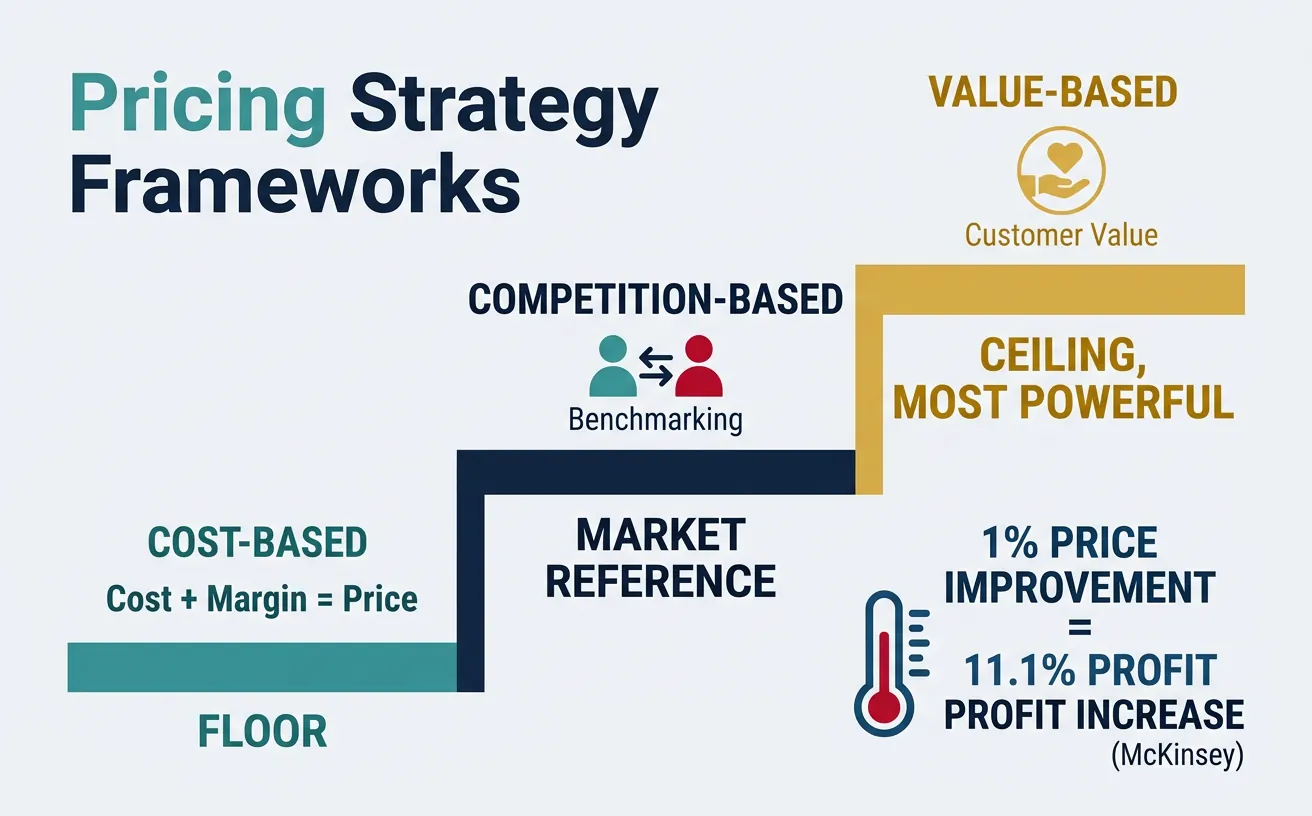
Full-stack case studies, playbooksPricing is the most powerful yet underutilized lever in business. If marketing is like a megaphone and product is like a magnet, pricing is like a thermostat — small adjustments create massive changes in the entire system's temperature (profitability).
| Pricing Framework | How It Works | Best For | Risk |
|---|---|---|---|
| Cost-Plus | Cost + target margin % = price | Commodities, manufacturing, government | Ignores customer value and willingness to pay |
| Competitive | Match or undercut competitor prices | Crowded markets, undifferentiated products | Race to the bottom, margin compression |
| Value-Based | Price based on customer's perceived value | Differentiated products, B2B, SaaS | Requires deep customer research |
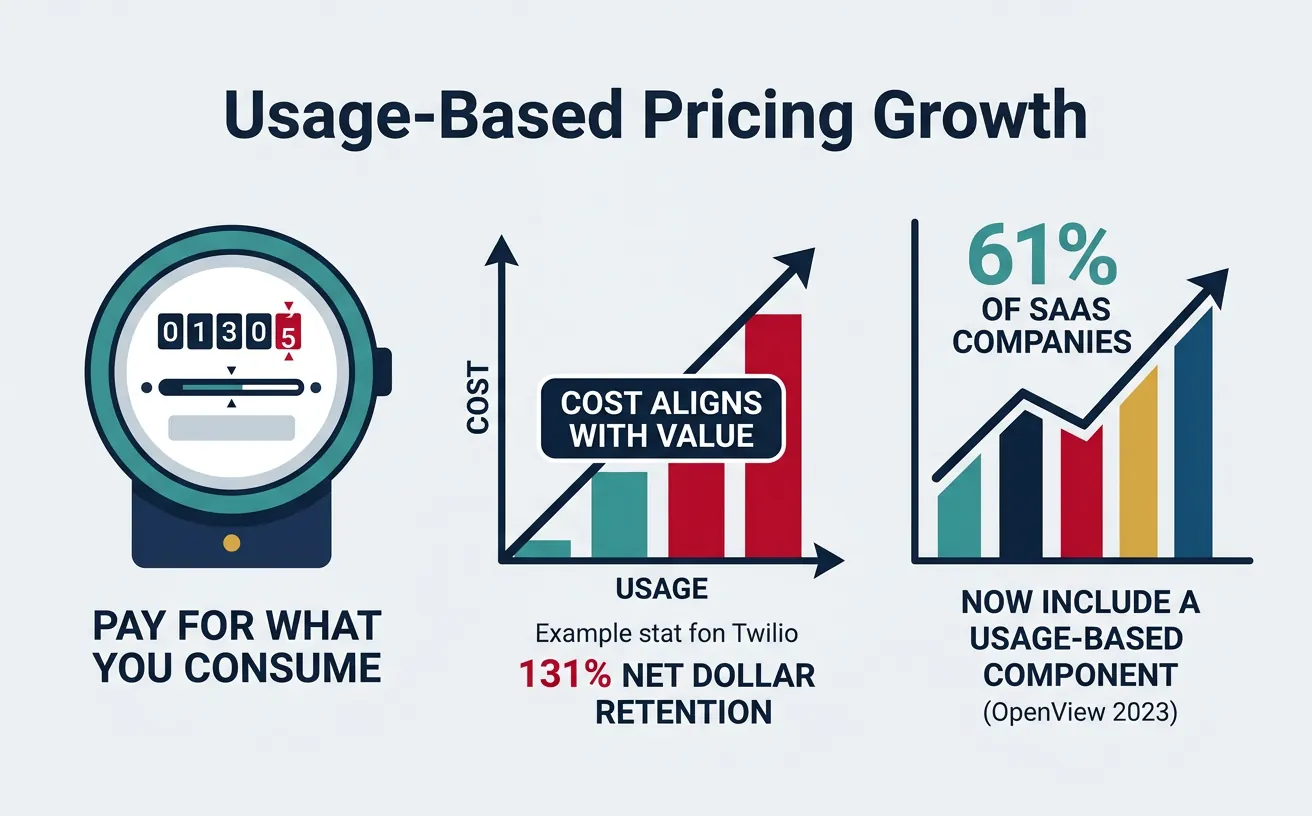
| Dynamic | Adjust prices in real-time based on demand | Airlines, hotels, ride-sharing, e-commerce | Customer backlash if perceived as unfair |
| Penetration | Launch at low price to gain market share | New markets, network effects, marketplaces | Hard to raise prices later |
| Skimming | Launch at high price, reduce over time | Innovation, luxury, tech hardware | Attracts competitors at lower price points |
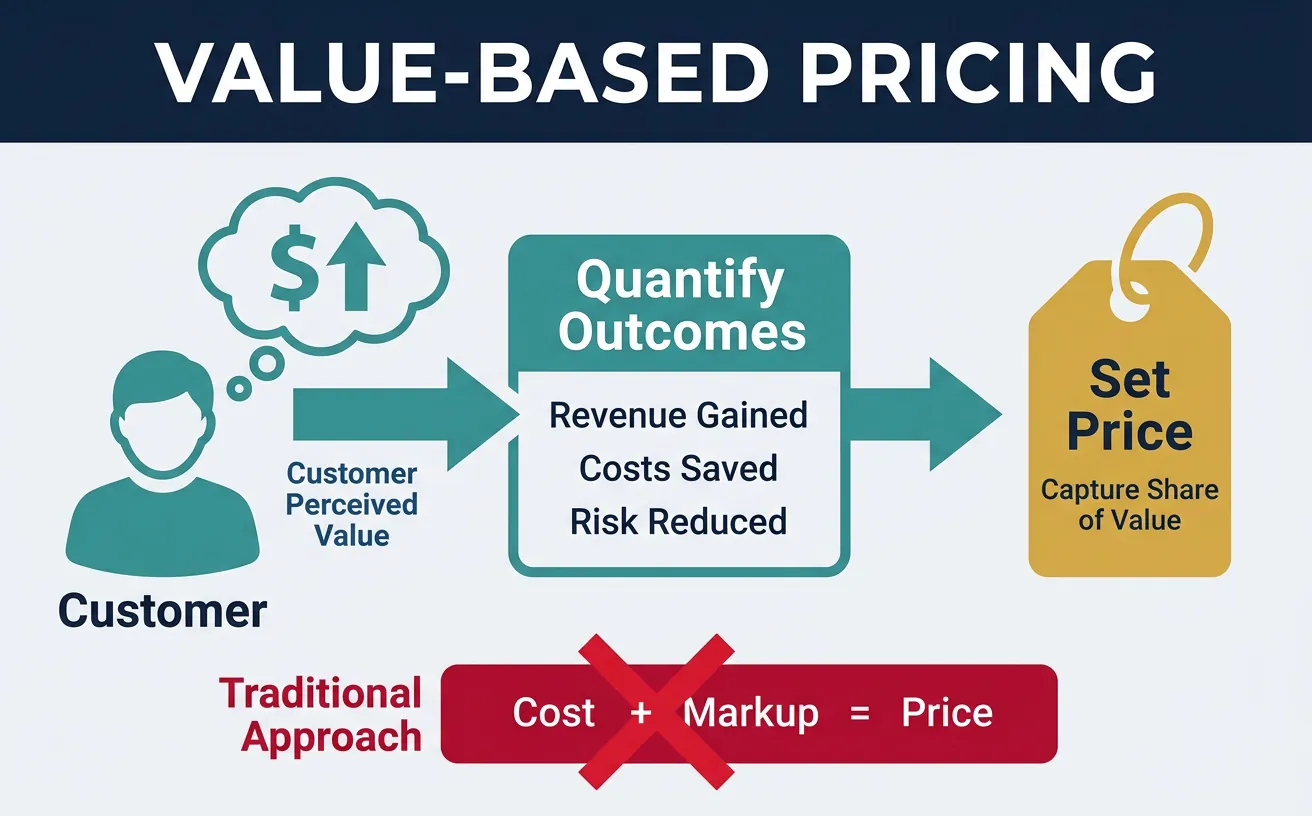
Value-Based Pricing
Value-based pricing flips the traditional approach: instead of asking "what does it cost us to make this?" you ask "what is this worth to the customer?" — then capture a share of that value. The key insight is that customers don't buy products; they buy outcomes.
Case Study: Salesforce's Value-Based Pricing Revolution
The Innovation: When Salesforce launched in 1999, the standard for CRM was $150,000+ for Siebel licenses plus $500K+ implementation. Salesforce didn't price based on cost (their cloud cost per user was pennies) or competition (undercut Siebel). Instead, they priced based on value per user per month — $50-$300/user/month.
The Value Metric: By choosing "per user" as the value metric, Salesforce aligned price with value: more users = more value from CRM = more revenue. This was brilliant because the metric scales naturally with company size and the value they receive.
The Result: The "No Software" model at $50/user/month made enterprise CRM accessible to SMBs while enterprise deals scaled to $1M+ ARR with 1,000+ users. Average ACV grew from $8K to $250K+ as they moved upmarket — all on the same per-user model.
Pricing Psychology
| Psychology Principle | How It Works | Example | Impact |
|---|---|---|---|
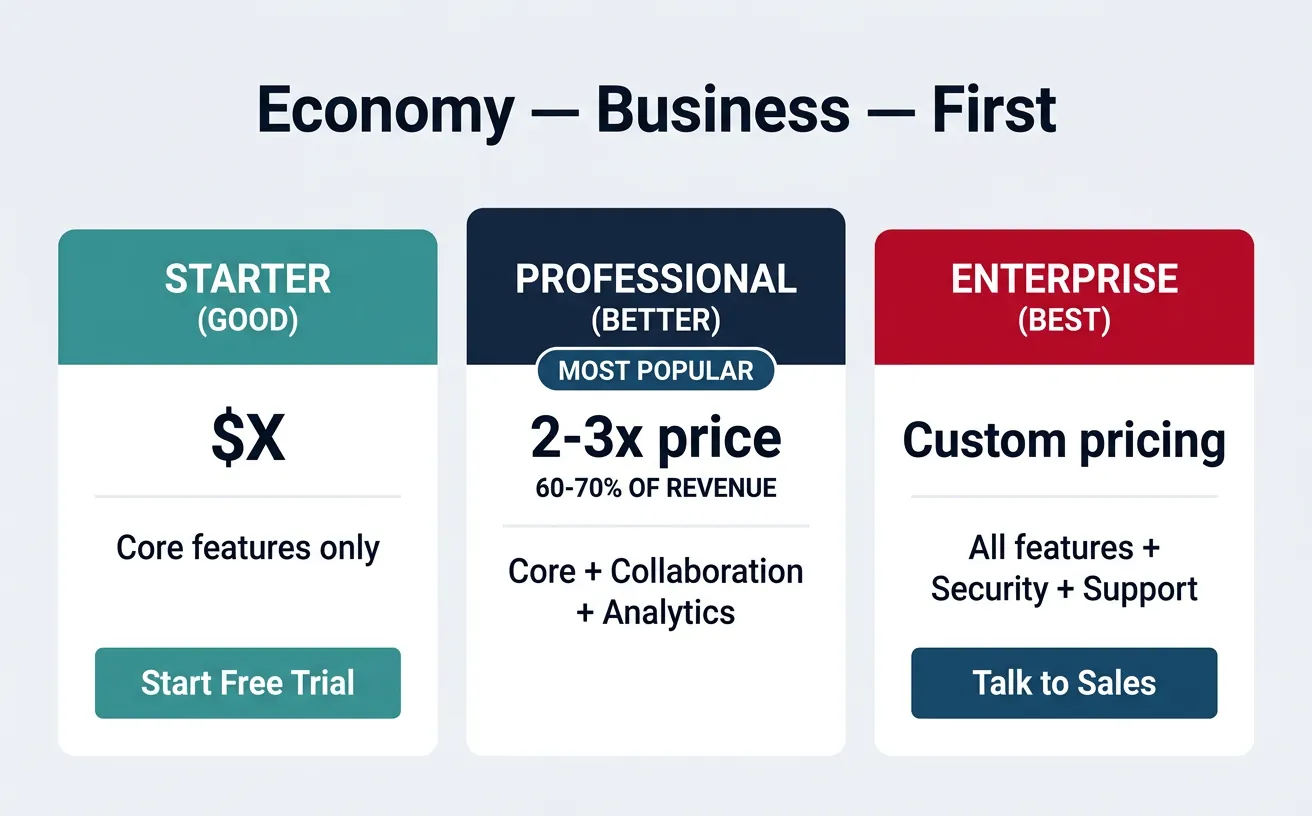
| Anchoring | First number seen becomes reference point | Show enterprise plan first ($999), making pro ($199) feel cheap | 20-30% increase in plan selection |
| Charm Pricing | Ending in 9 signals deal/value | $49 vs $50 — left-digit effect | 8-24% increase in conversions |
| Decoy Effect | Add an inferior option to make target look better | Small $5, Medium $7.50, Large $8 (medium = decoy) | 40-60% shift toward target option |
| Price Partitioning | Split price into smaller components | "Just $3.30/day" instead of "$99/month" | 15-25% higher conversion |
| Round vs Precise | Round for emotional, precise for rational | Luxury: $500. B2B: $497.50 | Precise prices feel more researched |
| Free (Zero Price Effect) | Free creates irrational demand | Freemium tiers drive adoption | 10x adoption vs $1 price |