Back to Business

Marketing & Strategy Series Part 11: Growth Hacking & Experimentation

February 12, 2026 Wasil Zafar 27 min read

Master growth loops, viral mechanics, product-led growth strategies, and rapid experimentation frameworks for scalable, sustainable growth.

Table of Contents

  1. Growth Fundamentals
  2. Growth Loops & Virality
  3. Product-Led Growth
  4. Rapid Experimentation
  5. Tools & Practice

Growth Fundamentals

Part 11 of 21: Building on CRO from Part 10, this article explores growth hacking—the mindset, frameworks, and tactics that drive exponential user acquisition and retention.

Marketing & Strategy Mastery

Your 21-step learning path • Currently on Step 11
Marketing Fundamentals & Strategic Foundations
Value creation, evolution, STP, 4Ps/7Ps, PMF
Consumer & Buyer Psychology
Behavioral economics, cognitive biases, trust
Brand Building & Positioning
Identity, architecture, storytelling, thought leadership
SEO & Search Marketing
Technical SEO, intent mapping, AI search
Content Marketing Mastery
Strategy, editorial systems, content ROI
Social Media & Community Strategy
Platform strategies, influencer partnerships
Email Marketing & Automation
Lifecycle, nurturing, CRM integration
Paid Advertising Systems
PPC, social ads, account-based advertising
Analytics, Attribution & Marketing Science
Funnel analytics, attribution models
Conversion Rate Optimization (CRO)
Landing pages, A/B testing, UX
11
Growth Hacking & Experimentation
Growth loops, viral systems, PLG
You Are Here
12
B2B Marketing & Enterprise Strategy
ABM, demand gen, sales enablement
13
Pricing Strategy & Revenue Models
Value-based pricing, SaaS tiers, bundling
14
Distribution Strategy
Channel strategy, affiliates, ecosystem positioning
15
Consulting-Level Strategic Analysis
Porter's 5 Forces, SWOT, PESTLE
16
Product Marketing & Go-To-Market
Launch strategy, GTM frameworks, PMM
17
Marketing Finance & Planning
Budget, CAC payback, ROI modeling
18
Personal Branding & Thought Leadership (B2P)
Authority, monetization, creator economics
19
Offline & Traditional Marketing
Events, PR, broadcast, direct mail
20
Scaling & Strategic Leadership
Global expansion, organizational design
21
Integrated Marketing Strategy Capstone
Full-stack case studies, playbooks

Traditional marketing is like filling a bathtub with buckets — you carry water one campaign at a time. Growth hacking is like connecting a fire hose — you build systems that generate compounding returns. The term was coined by Sean Ellis in 2010 to describe a person "whose true north is growth" — combining marketing, product, engineering, and data into a unified growth engine.

The Growth Mindset Shift: Traditional marketing asks "How do I reach more people?" Growth hacking asks "How do I build a system where users bring more users?" The fundamental difference is linear vs. compounding — paid ads create linear growth (spend stops, growth stops), while growth loops create compounding growth (each user generates fractional new users, creating exponential curves).

Growth Frameworks

Framework Stages Key Metrics Best For
AARRR (Pirate Metrics) Acquisition → Activation → Retention → Revenue → Referral CAC, activation rate, churn, ARPU, viral coefficient Startups, SaaS, consumer apps
Bullseye Framework Brainstorm 19 channels → Rank → Test top 3 → Focus on winner Channel CPA, scalability, time-to-results Finding initial traction channel
Growth Loops Input → Action → Output → Reinvested as Input Loop frequency, conversion at each step, payback period Building self-sustaining growth systems
ICE Scoring Impact × Confidence × Ease (each scored 1-10) Average ICE score per experiment Prioritizing growth experiments
RICE Scoring (Reach × Impact × Confidence) / Effort RICE score normalized across team Product-led experiment prioritization

Case Study: Dropbox's AARRR Optimization

Pirate Metrics 3,900% Growth in 15 Months

Challenge: Dropbox was spending $233-$388 per customer acquisition via Google Ads for a $99/year product — a clearly unsustainable CAC.

AARRR Diagnosis: Sean Ellis mapped the full funnel and discovered that Referral was the broken stage. Users loved the product (high retention) but had no incentive to share it.

Solution: Launched a double-sided referral program: both referrer and referee got 500MB free storage. The program was embedded directly into the onboarding flow (not a separate landing page).

Results: Referrals increased signups by 60%. Dropbox grew from 100K to 4M users in 15 months (3,900% growth). CAC dropped to nearly $0 for referred users. The referral program permanently increased signups by 60%, generating 2.8M direct referral invites per month.
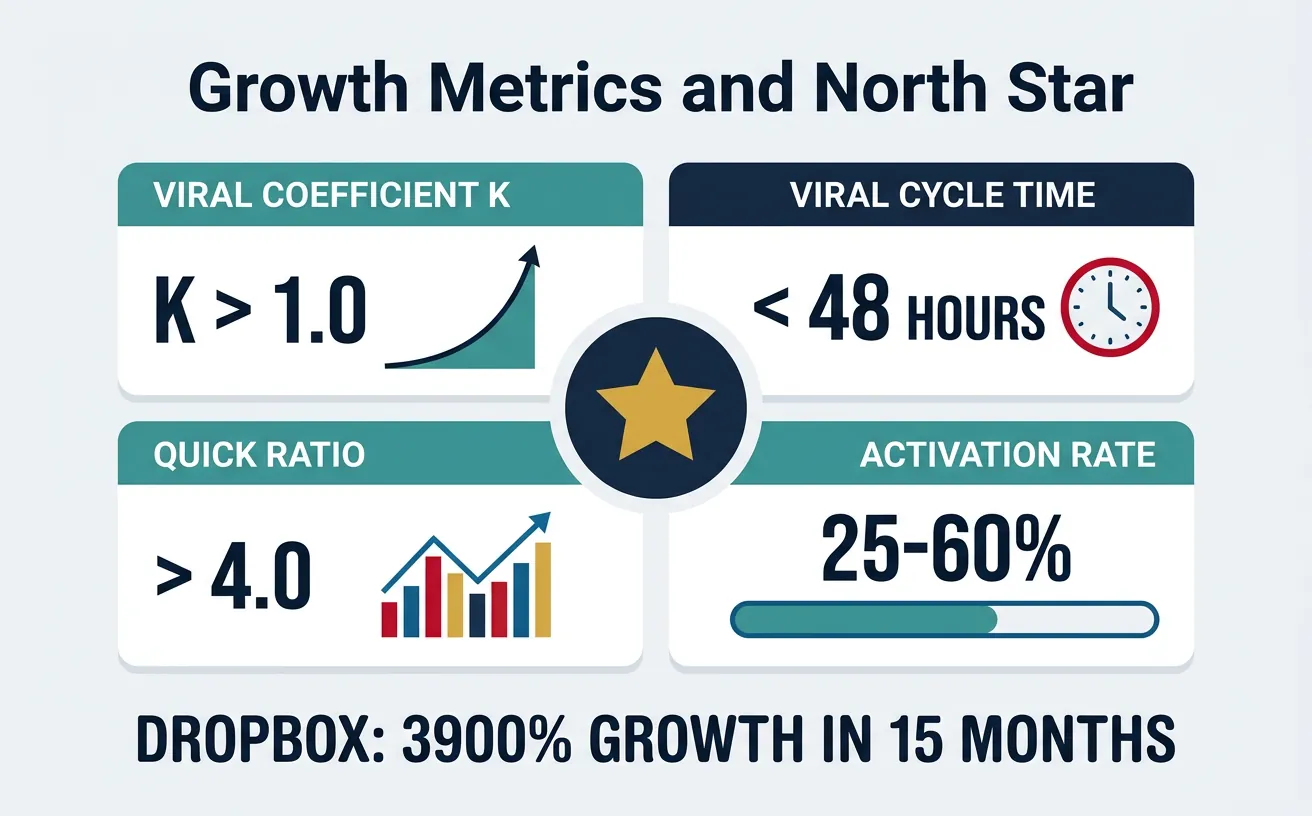
Growth Metrics

Metric Formula Benchmark Why It Matters
Viral Coefficient (K) Invites per user × Conversion rate K > 1.0 = viral growth Determines if product grows organically
Viral Cycle Time Time from signup → first referral invite < 48 hours ideal Faster cycles = exponential compounding
Quick Ratio (New + Reactivated) / (Churned + Contracted) > 4.0 = healthy SaaS Measures net user growth momentum
Activation Rate Users who reach "aha moment" / Total signups 25-60% depending on product Biggest leverage point in the funnel
Payback Period CAC / Monthly gross margin per customer < 12 months for SaaS How fast growth investment returns
The Retention Trap: No amount of growth hacking fixes a leaky bucket. If your 30-day retention is below 40% for consumer apps or 80% for SaaS, stop all acquisition experiments and fix retention first. Acquiring users who churn is just burning money faster. As Brian Balfour (ex-VP Growth, HubSpot) says: "Retention is the foundation. Without it, nothing else matters."

Growth Loops & Virality

Growth Loop Types

Growth loops replace the traditional funnel model. While funnels are linear (traffic → conversion → done), loops are circular — the output of each cycle becomes the input of the next, creating self-reinforcing growth systems.

Loop Type Mechanism Example Compounding Speed
Viral Loop User invites → New users → More invites WhatsApp: messaging requires both parties to have the app Fast (days)
Content Loop User creates content → Search discovers → New users Pinterest: pins → Google Images → new pinners Medium (weeks)
Paid Loop Revenue → Reinvested in ads → More revenue Dollar Shave Club: subscription revenue → Facebook ads → subscribers Fast (days, if LTV > CAC)
Data Network Loop Usage generates data → Better product → More usage Waze: drivers → traffic data → better routes → more drivers Slow (months) but defensible
Marketplace Loop More buyers → More sellers → More selection → More buyers Airbnb: hosts list → travelers book → revenue attracts more hosts Slow but winner-takes-most

Viral Mechanics

The Viral Growth Equation:

Users at time t = Users₀ × K^(t/cycle_time)

Where K = viral coefficient (invites × conversion rate) and cycle_time = time between signup and first invite. If K = 1.5 and cycle time = 2 days, 100 users become 150 → 225 → 337 → 506 in just 8 days. If K < 1.0, viral growth decays; if K > 1.0, it compounds. Even K = 0.7 is valuable — it means every 10 paid users generate 7 free users, reducing effective CAC by 41%.

Virality Type Mechanism K-Factor Range Example
Inherent Virality Product requires sharing to function 0.8 - 2.0+ Zoom: meetings require inviting others
Collaboration Virality Better with more people in the workspace 0.5 - 1.2 Notion, Slack: teams invite colleagues
Word-of-Mouth Users recommend because product is exceptional 0.2 - 0.6 Tesla: owners evangelize naturally
Incentivized Virality Rewards for sharing (both sides benefit) 0.3 - 1.0 Dropbox: 500MB per referral
Content Virality User-generated content surfaces in search/social 0.1 - 0.5 TikTok: creator content goes viral

Referral Programs

Case Study: PayPal's $60M Referral Bet

Referral 7-10% Daily Growth

Challenge: In 2000, PayPal needed rapid user growth to establish network effects before competitors. Traditional advertising was too slow.

Program: PayPal offered $20 for every new signup, plus $20 to the referrer. This cost $60-70M total but was strategically brilliant — they were buying network effects, not just users.

Why It Worked: The incentive was cash (universally valuable), the product had inherent virality (sending money requires a recipient), and the referral was embedded in the core use case (every payment was a potential referral).

Results: PayPal achieved 7-10% daily user growth, reaching 1 million users in the first 2 months, then 5 million by mid-2000. eBay acquired PayPal for $1.5B in 2002. The $60M spend generated billions in enterprise value.

Referral Design Element Best Practice Example
Incentive Structure Double-sided (both referrer and referee benefit) Uber: $20 ride credit for both parties
Timing Trigger after "aha moment," not during onboarding After first successful ride, first team project
Friction One-click sharing via native share, link, email Unique referral link with auto-filled message
Visibility Always accessible but not annoying; dashboard tracking Persistent "Invite friends" in settings + progress bar
Reward Alignment Reward should relate to core product value Dropbox: storage (product value) not cash

Product-Led Growth

PLG Strategy

Product-Led Growth (PLG) is a business strategy where the product itself is the primary driver of acquisition, conversion, and expansion. Instead of relying on sales teams to demo and close, PLG lets users experience value first and pay later. Think of it as the Costco free sample model applied to software — try it, love it, buy it.

Factor Sales-Led Growth Product-Led Growth
First Touch Marketing form → SDR call → Demo Free trial / freemium → Self-serve
Time to Value Days to weeks (sales cycle) Minutes to hours (instant access)
User Type Buyer (economic decision-maker) End user (actual user of the product)
CAC $5K-$50K+ (enterprise sales) $0-$500 (self-serve + ads)
Scaling Constraint Hiring sales reps Product infrastructure
Examples Salesforce, Oracle, SAP Slack, Zoom, Figma, Calendly

Case Study: Slack's Product-Led Dominance

PLG $27.7B Acquisition

PLG Engine: Slack's growth was almost entirely product-led. The product had inherent virality (messaging requires inviting teammates), bottom-up adoption (one person signs up, invites their team), and collaboration loops (more teammates = more valuable).

Key Metrics: Teams sending 2,000+ messages had a 93% conversion to paid. Slack tracked "messages sent" as their North Star, knowing that usage preceded payment. Their activation milestone was "2,000 team messages" — once a team crossed this threshold, they rarely churned.

Results: Slack grew from 0 to 10M daily active users without a traditional sales force. By the time enterprise companies discovered Slack, dozens of teams were already using it internally. Salesforce acquired Slack for $27.7B in 2021.

Freemium Models

Freemium Model Free Tier Limit Conversion Trigger Example
Feature-Limited Core features free, advanced locked Need for analytics, integrations, admin Trello: free boards, paid Power-Ups
Usage-Limited Free up to X users/actions/storage Hitting usage ceiling naturally Slack: free up to 10K messages searchable
Time-Limited (Trial) Full product for 7-30 days Trial expiration + embedded value Netflix: 30-day free trial
Audience-Limited Free for individuals, paid for teams Team collaboration needs Figma: free for individuals, paid for teams
Hybrid Combination of above Multiple upgrade paths Notion: free for personal, limited blocks for teams

Activation & Onboarding

The "Aha Moment" Framework: Every successful PLG product has an identifiable activation event that predicts long-term retention. Activation is the most important growth lever — a 25% improvement in activation rate typically has 3x more impact than a 25% improvement in acquisition.
Product Aha Moment Activation Metric Time to Activation
Slack First real-time team conversation 2,000 team messages sent ~1 week
Dropbox File syncs seamlessly across devices 1 file uploaded to 1+ devices ~1 day
Facebook Connecting with existing friends 7 friends in 10 days 10 days
Notion Building first useful workspace 3+ pages + 1 collaborator in 7 days ~1 week
Calendly First meeting scheduled without email back-and-forth 1 meeting booked via shared link ~1 day

Rapid Experimentation

Experiment Process

Growth teams run experiments like scientists run clinical trials — structured, measurable, and learning-oriented. The process follows a systematic loop: hypothesis → design → execute → analyze → document → iterate.

Phase Activity Duration Output
1. Ideation Generate hypotheses from data, user research, competitors Ongoing backlog Experiment cards with hypothesis + prediction
2. Prioritization Score ideas using ICE/RICE, select top 3-5 Weekly sprint planning Prioritized experiment queue
3. Design Define test variant, control, metrics, success criteria 1-2 days Experiment brief with sample size
4. Execute Build, QA, launch test to defined traffic split 2-5 days build + 1-4 weeks run Live experiment with data collection
5. Analyze Statistical validation, segment analysis, side effects 1-2 days Decision: ship, iterate, or kill
6. Document Record learnings, share with team, update mental models 30 minutes Learning repository entry
Experiment Velocity Rule: The best growth teams optimize for experiment velocity, not experiment success rate. Facebook's growth team ran 10,000+ experiments in a year with a ~10% win rate. That "low" success rate generated enormous growth because they ran experiments so fast that even a 10% hit rate at high volume created massive compounding wins. Target 2-3 experiments per week per growth team member.

Prioritization Frameworks

Framework Formula Best For Weakness
ICE (Impact + Confidence + Ease) / 3 Quick, simple team alignment Subjective scoring, no reach factor
RICE (Reach × Impact × Confidence) / Effort Product teams with data on reach Requires estimated reach data
PIE (Potential + Importance + Ease) / 3 CRO teams, page-level optimization Overlaps with impact/importance
North Star Alignment Does this move the North Star metric? Strategic filtering before scoring Binary (yes/no), not nuanced

Building Growth Teams

Case Study: Facebook's Growth Team Model

Growth Teams 0 → 2.9B Users

Structure: Facebook pioneered the modern growth team in 2007 when Chamath Palihapitiya was tasked with getting the next billion users. The team was cross-functional: product manager + data analyst + growth engineer + designer — all in one squad with a single North Star metric.

Key Discovery: The team found that users who added 7 friends in 10 days had dramatically higher retained engagement. This became their activation target, and every experiment was designed to help users reach this milestone faster.

Experiment Velocity: The growth team ran 10,000+ experiments per year, with a ~10% win rate. They optimized the friend suggestion algorithm, simplified the signup flow, added email contact importing, and created the "People You May Know" feature — each driven by data, not intuition.

Results: Facebook grew from 50M to 2.9B Monthly Active Users. The growth team model became the template adopted by every major tech company including Uber, Airbnb, LinkedIn, and Spotify.

Growth Team Role Responsibility Key Skills
Growth PM Strategy, prioritization, cross-functional alignment Data analysis, experiment design, stakeholder management
Growth Engineer Build experiments, implement winning variants Full-stack dev, A/B test frameworks, speed optimization
Data Analyst Define metrics, analyze experiments, build dashboards SQL, Python, statistical analysis, cohort modeling
Growth Designer UI/UX for experiments, onboarding flows, CRO Rapid prototyping, user research, conversion design
Growth Marketer Channel experiments, messaging tests, virality Paid acquisition, content, referral program design

Tools & Practice

Growth Strategy Canvas

Use this canvas to design your growth engine. Download as Word, Excel, PDF, or PowerPoint for your growth toolkit.

Growth Strategy Canvas

Design your growth engine and experiment roadmap. Download as Word, Excel, PDF, or PowerPoint.

Draft auto-saved

All data stays in your browser. Nothing is sent to or stored on any server.

Practice Exercises

Exercise 1: Growth Loop Design

Design 3 growth loops for a project management SaaS tool (like Asana or Monday.com):

  • One viral loop that leverages inherent product sharing
  • One content loop that drives organic discovery
  • One paid loop with reinvested revenue

For each loop, define: Input → Action → Output → Reinvestment. Calculate the theoretical K-factor for each.

Exercise 2: Referral Program Design

Design a referral program for a fitness app with 500K monthly active users:

  • Choose incentive type: product credit, premium features, or cash
  • Design double-sided rewards (what does referrer and referee each get?)
  • Define the trigger moment (when in the user journey do you ask for referrals?)
  • Calculate target K-factor and expected cost per acquired user
  • Plan 3 A/B tests to optimize the referral flow in the first 90 days

Exercise 3: Experiment Sprint Planning

You're the Growth PM at a B2B SaaS startup with 10K free users and 2% conversion to paid. Plan a 4-week growth sprint:

  • Generate 10 experiment ideas across acquisition, activation, and monetization
  • Score each using ICE (Impact × Confidence × Ease, 1-10 each)
  • Select top 5 and sequence them across 4 weeks
  • Define success criteria, sample size, and run time for each
  • Predict expected total impact on paid conversion rate

Key Takeaways

  1. Growth loops > funnels — build circular systems where output reinvests as input, creating compounding rather than linear growth
  2. K-factor matters even below 1.0 — a K of 0.5 means every 10 paid users generate 5 free users, reducing effective CAC by 33%
  3. Activation is the top lever — improving activation rate has 3x more impact than improving acquisition. Find your "aha moment" first
  4. PLG changes the cost structure — product-led companies have 5-10x lower CAC than sales-led, enabling faster scaling
  5. Velocity over perfection — run 2-3 experiments per week with a 10% win rate rather than 1 "perfect" experiment per month
  6. Retention before acquisition — if 30-day retention is below 40% (consumer) or 80% (SaaS), fix the bucket before filling it
  7. Referral timing is everything — ask for referrals after the aha moment, not during onboarding. Happy users refer naturally
  8. Cross-functional teams win — growth requires PM + engineer + analyst + designer working in sprint cycles, not siloed departments
Business