Robotics Startups
Robotics & Automation Mastery
Introduction to Robotics
History, types, DOF, architectures, mechatronics, ethicsSensors & Perception Systems
Encoders, IMUs, LiDAR, cameras, sensor fusion, Kalman filters, SLAMActuators & Motion Control
DC/servo/stepper motors, hydraulics, drivers, gear systemsKinematics (Forward & Inverse)
DH parameters, transformations, Jacobians, workspace analysisDynamics & Robot Modeling
Newton-Euler, Lagrangian, inertia, friction, contact modelingControl Systems & PID
PID tuning, state-space, LQR, MPC, adaptive & robust controlEmbedded Systems & Microcontrollers
Arduino, STM32, RTOS, PWM, serial protocols, FPGARobot Operating Systems (ROS)
ROS2, nodes, topics, Gazebo, URDF, navigation stacksComputer Vision for Robotics
Calibration, stereo vision, object recognition, visual SLAMAI Integration & Autonomous Systems
ML, reinforcement learning, path planning, swarm roboticsHuman-Robot Interaction (HRI)
Cobots, gesture/voice control, safety standards, social roboticsIndustrial Robotics & Automation
PLC, SCADA, Industry 4.0, smart factories, digital twinsMobile Robotics
Wheeled/legged robots, autonomous vehicles, drones, marine roboticsSafety, Reliability & Compliance
Functional safety, redundancy, ISO standards, cybersecurityAdvanced & Emerging Robotics
Soft robotics, bio-inspired, surgical, space, nano-roboticsSystems Integration & Deployment
HW/SW co-design, testing, field deployment, lifecycleRobotics Business & Strategy
Startups, product-market fit, manufacturing, go-to-marketComplete Robotics System Project
Autonomous rover, pick-and-place arm, delivery robot, swarm simBuilding a robotics company is like building a rocket while flying it — you're simultaneously solving deeply technical engineering problems and navigating the brutal realities of hardware business economics. Unlike software startups that can iterate with near-zero marginal cost, robotics ventures carry the weight of physical atoms: bill-of-materials, manufacturing tooling, inventory risk, and multi-year development timelines before a single unit ships.
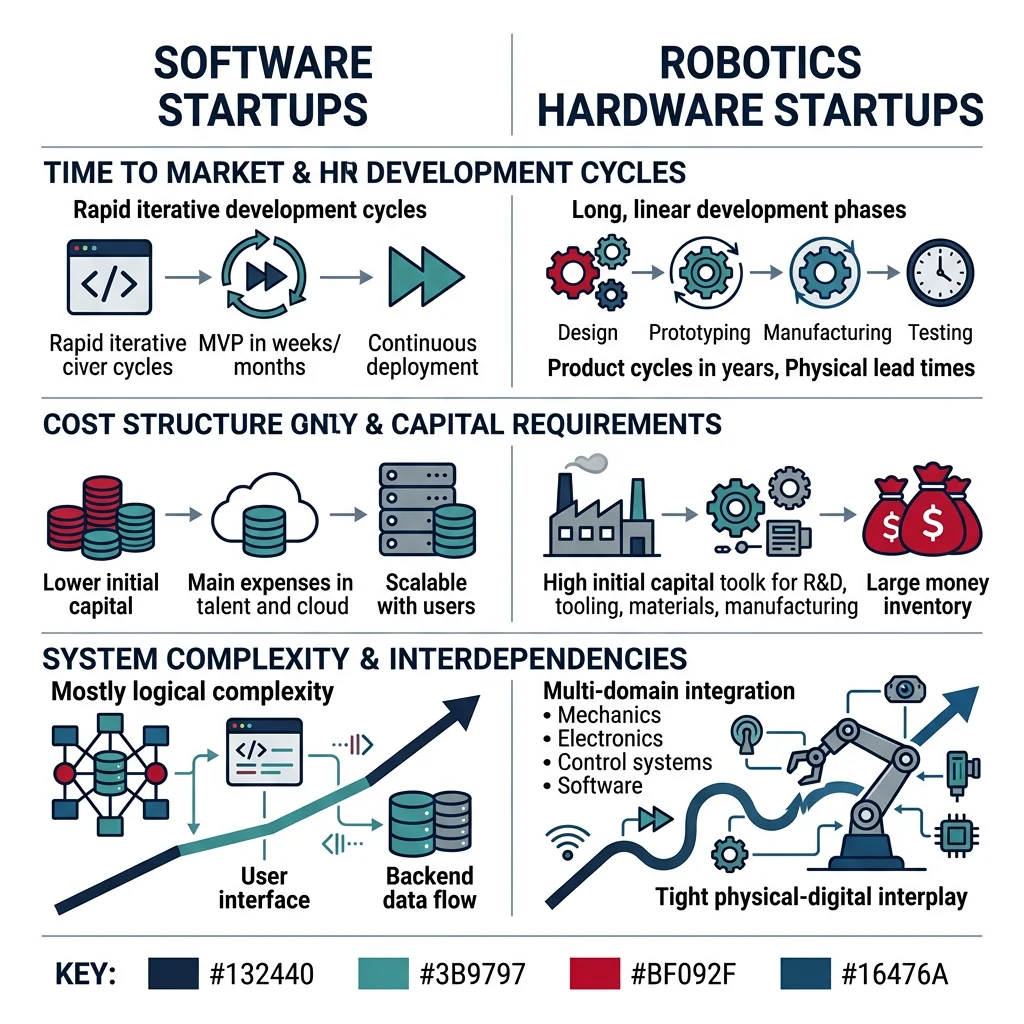
The robotics startup landscape has unique characteristics that distinguish it from both software and traditional hardware businesses:
| Dimension | Software Startup | Robotics Startup | Impact |
|---|---|---|---|
| Time to MVP | 2-6 months | 12-24 months | Longer runway needed before revenue |
| Capital Required (Seed) | $500K - $2M | $2M - $10M | Harder to bootstrap; VC-dependent earlier |
| Marginal Cost | Near zero | $500 - $50,000+/unit | Gross margins under constant pressure |
| Iteration Speed | Hours / days (deploy) | Weeks / months (hardware rev) | Every design mistake is expensive |
| Talent Required | Software engineers | Mech + EE + SW + Controls | Cross-disciplinary teams are much harder to hire |
| Regulatory Burden | Low (usually) | High (safety certs, CE/UL) | Adds 6-18 months and significant cost |
| Field Support | Remote updates | Physical service + remote | Ongoing operational cost per customer |
Case Study: Locus Robotics — From Garage to $1B Valuation
Founded in 2014 by Rick Faulk, Locus Robotics built autonomous mobile robots (AMRs) for warehouse fulfillment. Key strategic decisions that drove their success:
- RaaS model — Robots-as-a-Service eliminated customer CapEx objections; warehouses paid per pick, not per robot
- Human-collaborative — Robots worked alongside warehouse workers rather than replacing them, reducing resistance
- Fast deployment — New warehouse operational in 4 weeks vs. 6-12 months for traditional automation
- Proven ROI — Customers reported 2-3× productivity gains and 6-month payback
Result: Reached $1B valuation in 2022, operating 10,000+ robots across 200+ sites globally.
The key decisions every robotics founder faces early on include: build vs. buy hardware components, vertical vs. horizontal market focus, sell vs. lease the robot, and when to start investing in manufacturing vs. staying in prototyping mode.
Product-Market Fit for Hardware
Finding product-market fit (PMF) in robotics is fundamentally different from software. You can't just ship a beta, measure engagement, and iterate weekly. Each hardware revision costs money, takes weeks, and the feedback loop is measured in months. Think of it like designing a bridge while people are already trying to cross — you need far more upfront confidence in your design choices.
The PMF journey for robotics typically follows these stages:
- Problem Validation — Spend 2-4 months interviewing 50+ potential customers. Identify tasks that are dull, dirty, dangerous, or dear (expensive). Quantify the pain in dollars: labor cost, injury rates, throughput bottlenecks
- Technical Feasibility — Build a benchtop proof-of-concept. Not a product — just demonstrate that the core technical risk is solvable. This might be a robot arm grasping the target object, or an AMR navigating a real warehouse
- Design Partner — Find 1-3 customers willing to co-develop. They get early access at reduced cost; you get real-world feedback and a production environment to test in. This is your most valuable asset
- Alpha Deployment — Place 3-5 units at design partner sites. Measure task completion rates, uptime, failure modes, and operator experience. This is where assumptions meet reality
- Unit Economics Validation — Calculate true cost: BOM + assembly + shipping + installation + support + warranty. Does the price the market will pay cover this with healthy margins at production volume?
import numpy as np

# Robotics Unit Economics Calculator
# Each code block is independent and copy-paste executable

def calculate_unit_economics(
    bom_cost=8500,           # Bill of materials ($)
    assembly_labor=1200,     # Assembly labor per unit ($)
    overhead_per_unit=800,   # Allocated overhead ($)
    shipping=400,            # Average shipping cost ($)
    warranty_reserve=600,    # Warranty reserve per unit ($)
    install_cost=1500,       # Installation & commissioning ($)
    target_margin=0.55,      # Target gross margin (55%)
    support_annual=2000,     # Annual support cost per unit ($)
    expected_lifetime=5      # Expected product lifetime (years)
):
    """Calculate required selling price for target gross margin."""

    total_cogs = bom_cost + assembly_labor + overhead_per_unit + shipping
    total_cost_first_year = total_cogs + warranty_reserve + install_cost

    # Minimum selling price for target margin
    min_price = total_cogs / (1 - target_margin)

    # Lifetime customer value vs. lifetime cost
    lifetime_revenue = min_price + (support_annual * expected_lifetime * 0.3)  # 30% support margin
    lifetime_cost = total_cost_first_year + (support_annual * expected_lifetime)
    lifetime_margin = (lifetime_revenue - lifetime_cost) / lifetime_revenue

    print("=" * 50)
    print("ROBOTICS UNIT ECONOMICS ANALYSIS")
    print("=" * 50)
    print(f"\nBOM Cost:           ${bom_cost:>10,.0f}")
    print(f"Assembly Labor:     ${assembly_labor:>10,.0f}")
    print(f"Overhead:           ${overhead_per_unit:>10,.0f}")
    print(f"Shipping:           ${shipping:>10,.0f}")
    print(f"{'─' * 40}")
    print(f"Total COGS:         ${total_cogs:>10,.0f}")
    print(f"\nWarranty Reserve:   ${warranty_reserve:>10,.0f}")
    print(f"Installation:       ${install_cost:>10,.0f}")
    print(f"{'─' * 40}")
    print(f"Total First-Year:   ${total_cost_first_year:>10,.0f}")
    print(f"\nMin Selling Price:  ${min_price:>10,.0f}  (at {target_margin:.0%} margin)")
    print(f"Lifetime Revenue:   ${lifetime_revenue:>10,.0f}")
    print(f"Lifetime Cost:      ${lifetime_cost:>10,.0f}")
    print(f"Lifetime Margin:    {lifetime_margin:>10.1%}")

    return min_price, lifetime_margin

price, margin = calculate_unit_economics()
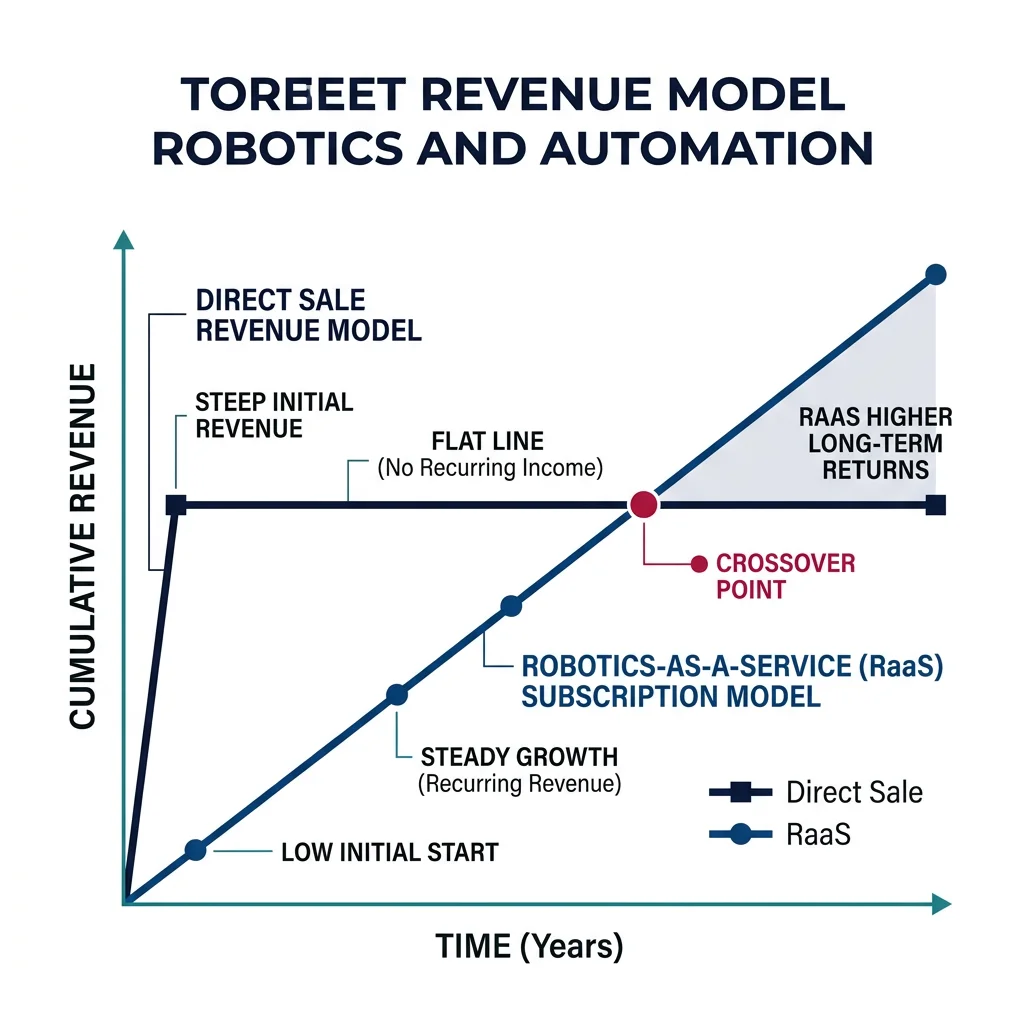
Robotics as a Service (RaaS)
The Robotics-as-a-Service (RaaS) model has transformed how robotics companies monetize their products. Instead of selling a $50,000 robot outright, companies lease it for $2,000-5,000/month — converting a large CapEx purchase into manageable OpEx for the customer. This is similar to how Xerox revolutionized copiers by charging per copy instead of selling machines.
| Model | Revenue Pattern | Customer Benefit | Company Benefit | Risk |
|---|---|---|---|---|
| Direct Sale | One-time lump sum | Own the asset | Immediate cash flow | Customer bears tech risk |
| Lease / RaaS | Monthly recurring | Low upfront cost, flexibility | Predictable ARR, higher LTV | Company bears fleet risk |
| Pay-Per-Use | Usage-based | Pay only for value delivered | Aligned incentives | Revenue tied to utilization |
| Hybrid | Base + per-use | Predictable + scalable | Floor revenue + upside | Complex pricing |
| Outcome-Based | Per outcome (pick, weld) | Zero tech risk | Maximum value capture | Hardest to forecast |
import numpy as np
import matplotlib
matplotlib.use('Agg')
import matplotlib.pyplot as plt

# RaaS vs. Direct Sale Revenue Model Comparison
# Independent, copy-paste executable

years = np.arange(0, 8, 0.25)  # Quarterly over 8 years
fleet_size = 100  # Starting fleet
unit_cost = 40000  # Cost per robot

# Direct Sale Model
units_sold_quarterly = np.array([5]*4 + [10]*4 + [15]*4 + [20]*4 + [20]*4 + [18]*4 + [15]*4 + [12]*4)
direct_price = 55000  # Selling price
direct_revenue = np.cumsum(units_sold_quarterly * direct_price)

# RaaS Model (slower start, higher ceiling)
raas_monthly = 1800  # Monthly per robot
raas_fleet = np.minimum(np.cumsum(units_sold_quarterly), 500)  # Fleet cap at 500
raas_quarterly_revenue = raas_fleet * raas_monthly * 3  # 3 months per quarter
raas_revenue = np.cumsum(raas_quarterly_revenue)

fig, (ax1, ax2) = plt.subplots(1, 2, figsize=(14, 5))

ax1.plot(years, direct_revenue / 1e6, 'b-', linewidth=2, label='Direct Sale')
ax1.plot(years, raas_revenue / 1e6, 'r-', linewidth=2, label='RaaS')
ax1.fill_between(years, direct_revenue / 1e6, alpha=0.1, color='blue')
ax1.fill_between(years, raas_revenue / 1e6, alpha=0.1, color='red')
ax1.set_xlabel('Years')
ax1.set_ylabel('Cumulative Revenue ($M)')
ax1.set_title('Revenue: Direct Sale vs. RaaS')
ax1.legend()
ax1.grid(True, alpha=0.3)

# Quarterly Revenue (non-cumulative)
ax2.bar(years - 0.1, units_sold_quarterly * direct_price / 1e6, 0.2, label='Direct Sale', color='steelblue')
ax2.bar(years + 0.1, raas_quarterly_revenue / 1e6, 0.2, label='RaaS', color='indianred')
ax2.set_xlabel('Years')
ax2.set_ylabel('Quarterly Revenue ($M)')
ax2.set_title('Quarterly Revenue Comparison')
ax2.legend()
ax2.grid(True, alpha=0.3)

plt.tight_layout()
plt.savefig('raas_comparison.png', dpi=100, bbox_inches='tight')
plt.show()
print("RaaS crossover point: Year 3-4 (when recurring revenue exceeds direct sale)")
print(f"Year 8 cumulative — Direct: ${direct_revenue[-1]/1e6:.1f}M | RaaS: ${raas_revenue[-1]/1e6:.1f}M")
Manufacturing & Scale-Up
The journey from a working prototype to production-ready manufacturing is the most treacherous phase of any hardware startup. It's called the "Valley of Death" for good reason — roughly 80% of hardware startups that raise a seed round never ship a production unit. Think of it like the difference between cooking a single gourmet meal (prototype) vs. running a restaurant kitchen (production) — the skills, processes, and infrastructure are fundamentally different.
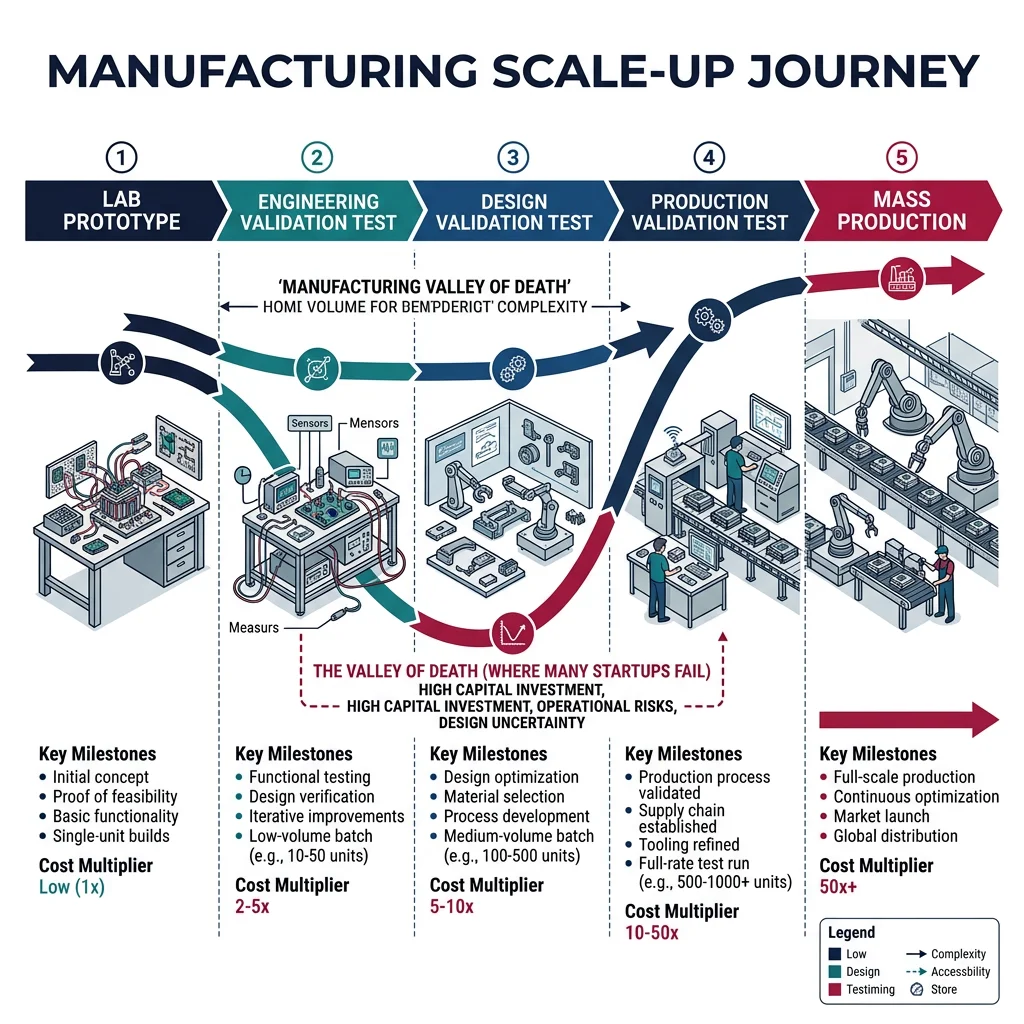
The manufacturing journey moves through distinct phases, each with its own challenges:
| Phase | Volume | Methods | Unit Cost | Key Challenge |
|---|---|---|---|---|
| Lab Prototype | 1-5 units | 3D print, hand wiring, dev boards | 5-20× production | Prove it works at all |
| Engineering Pilot (EVT) | 10-50 | CNC machining, custom PCBs, hand assembly | 3-8× production | Design for manufacturability |
| Design Validation (DVT) | 50-200 | Soft tooling, semi-automated assembly | 2-4× production | Reliability testing, certification |
| Production Validation (PVT) | 200-1,000 | Production tooling, assembly line | 1.5-2× production | Process yield and consistency |
| Mass Production (MP) | 1,000+ | Hard tooling, automated assembly | 1× (target) | Quality, supply chain, logistics |
Case Study: Universal Robots — DFM Excellence
Universal Robots (UR) was founded in 2005 by three Danish engineers who made Design for Manufacturing (DFM) a core competency from day one. Key decisions that enabled their scale-up:
- Modular joint design — All 6 joints use the same actuator module, reducing unique parts by 70%
- Aluminum extrusion arms — Standard profiles vs. custom castings, enabling rapid iteration
- Software-defined features — Same hardware platform supports UR3/UR5/UR10, differentiated by software limits
- In-house manufacturing — Maintained control of assembly in Odense, Denmark for quality assurance
Result: Grew from 0 to 75,000+ cobots deployed worldwide. Acquired by Teradyne for $285 million in 2015 — a 100× return for early investors. By 2024, UR commanded ~40% global cobot market share.
Supply Chain & Sourcing
Robotics supply chains are uniquely complex because they span multiple engineering domains — mechanical, electrical, software, and often optical or pneumatic systems. A single cobot might contain components from 50+ suppliers across 10+ countries. The 2020-2022 chip shortage exposed just how fragile these supply chains can be, with lead times for motor controllers stretching from 8 weeks to 52+ weeks.
Key supply chain strategies for robotics companies:
- Dual-source critical components — Never rely on a single supplier for any component that could halt production. For motors, controllers, and sensors, qualify at least two vendors
- Design for availability — Choose components that are available from multiple manufacturers. Using a proprietary ASIC is a risk; using an industry-standard MCU (STM32, ESP32) is safer
- Strategic inventory buffers — Hold 8-12 weeks of stock for long-lead-time items (custom PCBs, specialty motors, precision bearings). The carrying cost is worth it vs. a production shutdown
- Vertical integration decisions — Build in-house what differentiates you (custom end-effectors, perception algorithms). Buy what's commodity (power supplies, standard cables, enclosures)
- Geographic diversification — Spread suppliers across regions (China for electronics, Europe for precision components, local for final assembly) to reduce geopolitical risk
Quality & Cost Management
Quality management in robotics is a survival issue, not just a nice-to-have. A software bug can be patched remotely; a mechanical failure in a deployed robot requires an expensive field service visit — or worse, causes injury and liability. The cost of quality failures follows the 1:10:100 rule: fixing a defect in design costs $1, in manufacturing costs $10, and in the field costs $100.
import numpy as np

# Cost of Quality (CoQ) Analysis for Robotics
# Independent, copy-paste executable

def cost_of_quality_analysis(
    annual_units=500,
    unit_price=35000,
    defect_rate_percent=3.5,     # % units with defects
    field_defect_rate=1.2,       # % units failing in field
    prevention_cost_pct=2.0,     # % revenue on prevention
    appraisal_cost_pct=3.0,     # % revenue on testing/inspection
    internal_failure_cost=2500,  # Cost per internal defect
    external_failure_cost=8500,  # Cost per field failure (service visit)
    warranty_claim_cost=12000    # Average warranty claim cost
):
    """Analyze cost of quality breakdown for robotics manufacturing."""

    annual_revenue = annual_units * unit_price

    # Prevention: training, design reviews, supplier audits
    prevention = annual_revenue * (prevention_cost_pct / 100)

    # Appraisal: testing, inspection, calibration
    appraisal = annual_revenue * (appraisal_cost_pct / 100)

    # Internal failures: defects caught before shipping
    internal_defects = int(annual_units * (defect_rate_percent / 100))
    internal_failure = internal_defects * internal_failure_cost

    # External failures: defects found by customers
    field_failures = int(annual_units * (field_defect_rate / 100))
    external_failure = field_failures * external_failure_cost
    warranty_cost = field_failures * warranty_claim_cost * 0.3  # 30% result in warranty

    total_coq = prevention + appraisal + internal_failure + external_failure + warranty_cost
    coq_pct = (total_coq / annual_revenue) * 100

    print("=" * 55)
    print("COST OF QUALITY — ROBOTICS MANUFACTURING")
    print("=" * 55)
    print(f"\nAnnual Units: {annual_units} | Unit Price: ${unit_price:,.0f}")
    print(f"Annual Revenue: ${annual_revenue:,.0f}")
    print(f"\n{'Category':<25} {'Cost':>12} {'% Revenue':>10}")
    print("-" * 50)
    print(f"{'Prevention':<25} ${prevention:>11,.0f} {prevention/annual_revenue*100:>9.1f}%")
    print(f"{'Appraisal':<25} ${appraisal:>11,.0f} {appraisal/annual_revenue*100:>9.1f}%")
    print(f"{'Internal Failure':<25} ${internal_failure:>11,.0f} {internal_failure/annual_revenue*100:>9.1f}%")
    print(f"{'External Failure':<25} ${external_failure:>11,.0f} {external_failure/annual_revenue*100:>9.1f}%")
    print(f"{'Warranty Claims':<25} ${warranty_cost:>11,.0f} {warranty_cost/annual_revenue*100:>9.1f}%")
    print("-" * 50)
    print(f"{'TOTAL CoQ':<25} ${total_coq:>11,.0f} {coq_pct:>9.1f}%")
    print(f"\nDefects caught internally: {internal_defects}")
    print(f"Field failures: {field_failures}")
    print(f"\n💡 Industry benchmark: CoQ should be 5-8% of revenue.")
    print(f"   Your CoQ: {coq_pct:.1f}% — {'Within range ✓' if coq_pct <= 8 else 'Above target — invest more in prevention'}")

    return total_coq, coq_pct

total, pct = cost_of_quality_analysis()
Go-To-Market & Sales
Selling robots is fundamentally different from selling software. You're not just selling features — you're selling a physical presence in the customer's workspace that interacts with their people, processes, and infrastructure. Think of it like selling a new team member rather than a tool: the customer needs to trust that this "teammate" is reliable, safe, and productive from day one.
Robotics go-to-market strategy begins with market segmentation — choosing which customers to target first. The right beachhead market can make or break a robotics company:
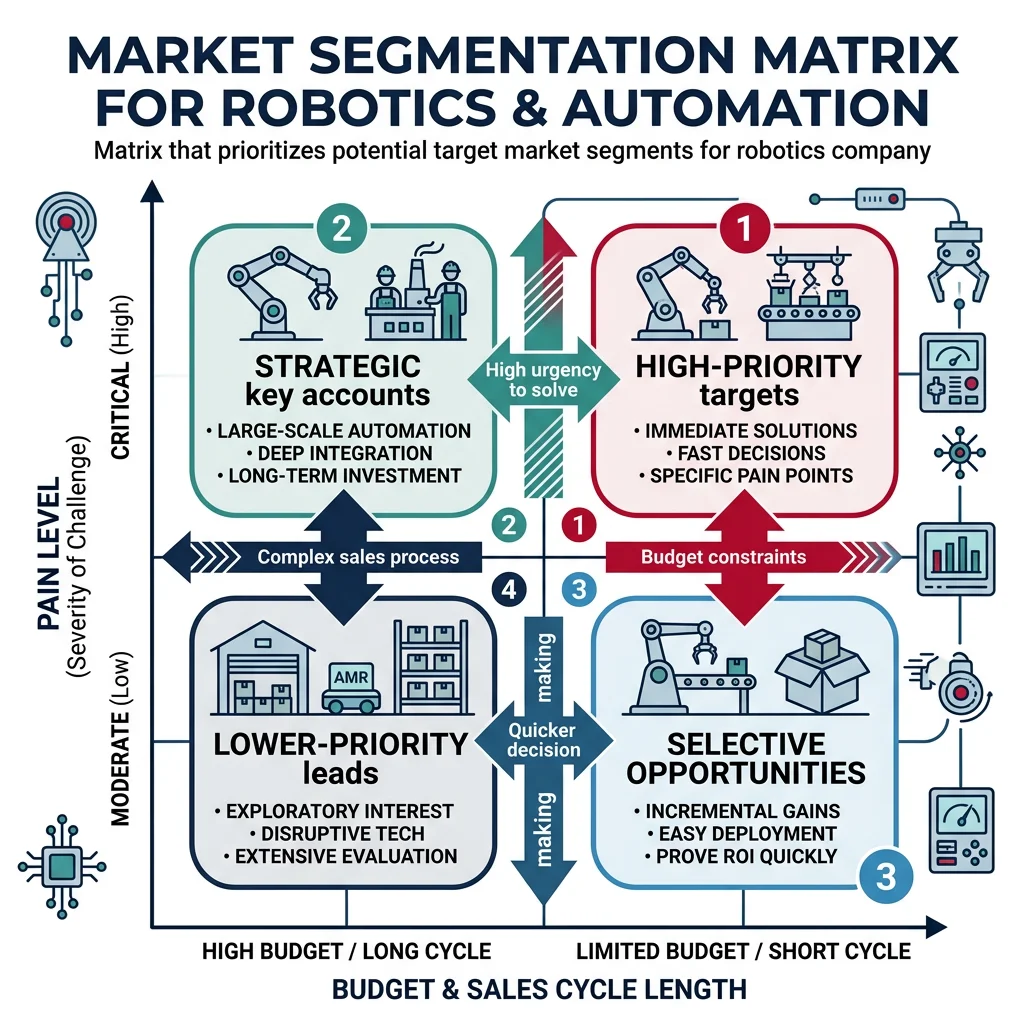
| Segment | Pain Level | Budget | Sales Cycle | Examples | Entry Strategy |
|---|---|---|---|---|---|
| Warehouse / Logistics | 🔴 Extreme | $1-50M | 3-9 months | Amazon, DHL, Walmart | Pilot → fleet deal |
| Manufacturing | 🟠 High | $500K-20M | 6-18 months | Auto OEMs, electronics | Integrator channel |
| Agriculture | 🟠 High | $100K-5M | 6-12 months | Fruit picking, weeding | Seasonal pilot → annual |
| Healthcare/Surgical | 🔴 Extreme | $1-10M | 18-36 months | Hospitals, clinics | Clinical trials → FDA |
| Construction | 🟡 Medium | $200K-5M | 6-12 months | Inspection, bricklaying | Contractor partnership |
| Consumer | 🟢 Low-Med | $200-5,000 | Immediate | Vacuums, education, toys | Retail / e-commerce |
Enterprise Robotics Sales
Enterprise robotics sales is a multi-stakeholder, consultative process with long timelines and high stakes. Unlike SaaS where a team lead can sign up with a credit card, deploying robots requires buy-in from operations, engineering, finance, safety, IT, and often executive leadership. A typical enterprise deal involves:
- Discovery & Assessment (2-4 weeks) — Site visit, workflow analysis, ROI modeling. Identify the specific tasks the robot will perform, current costs, and success metrics
- Technical Validation (4-8 weeks) — Proof of concept or simulation. Demonstrate the robot can handle the customer's specific products, environment, and edge cases
- Pilot Deployment (8-16 weeks) — 1-5 robots in production environment. Measure real performance against baseline. This is make-or-break
- Business Case & Procurement (4-12 weeks) — ROI presentation to finance, legal review, contract negotiation, procurement approval
- Fleet Rollout (ongoing) — Scale from pilot to full deployment. Typically 3-5× pilot size, with options for expansion
import numpy as np

# Enterprise Robotics ROI Calculator
# Independent, copy-paste executable

def enterprise_roi_calculation(
    num_robots=10,
    robot_cost=45000,          # Per robot (purchase or annual RaaS)
    deployment_cost=15000,     # Per robot (install, training, integration)
    annual_maintenance=4500,   # Per robot per year
    workers_replaced=0.5,      # FTE replaced per robot (augmentation, not full replacement)
    avg_worker_cost=52000,     # Fully loaded annual cost per worker
    productivity_gain=0.35,    # 35% throughput improvement
    current_throughput=1000,   # Units/day current
    revenue_per_unit=25,       # Revenue per unit produced
    downtime_reduction=0.15,   # 15% reduction in unplanned downtime
    annual_downtime_cost=250000  # Current annual downtime cost
):
    """Calculate enterprise ROI for a robotics deployment."""

    # Costs
    year1_investment = (robot_cost + deployment_cost) * num_robots
    annual_opex = annual_maintenance * num_robots

    # Benefits
    labor_savings = workers_replaced * num_robots * avg_worker_cost
    throughput_value = current_throughput * 365 * productivity_gain * revenue_per_unit
    downtime_savings = annual_downtime_cost * downtime_reduction

    annual_benefit = labor_savings + throughput_value + downtime_savings
    annual_net = annual_benefit - annual_opex

    # ROI metrics
    payback_months = year1_investment / (annual_net / 12)
    roi_3year = ((annual_net * 3) - year1_investment) / year1_investment * 100
    npv_5year = -year1_investment + sum([annual_net / (1.1 ** y) for y in range(1, 6)])

    print("=" * 55)
    print("ENTERPRISE ROBOTICS ROI ANALYSIS")
    print("=" * 55)
    print(f"\nFleet Size: {num_robots} robots")
    print(f"\n--- INVESTMENT ---")
    print(f"{'Hardware + Deployment:':<30} ${year1_investment:>12,.0f}")
    print(f"{'Annual OpEx (maintenance):':<30} ${annual_opex:>12,.0f}/yr")
    print(f"\n--- ANNUAL BENEFITS ---")
    print(f"{'Labor optimization:':<30} ${labor_savings:>12,.0f}")
    print(f"{'Throughput improvement:':<30} ${throughput_value:>12,.0f}")
    print(f"{'Downtime reduction:':<30} ${downtime_savings:>12,.0f}")
    print(f"{'─' * 44}")
    print(f"{'Total Annual Benefit:':<30} ${annual_benefit:>12,.0f}")
    print(f"{'Net Annual Value:':<30} ${annual_net:>12,.0f}")
    print(f"\n--- ROI METRICS ---")
    print(f"{'Payback Period:':<30} {payback_months:>10.1f} months")
    print(f"{'3-Year ROI:':<30} {roi_3year:>10.0f}%")
    print(f"{'5-Year NPV (10% discount):':<30} ${npv_5year:>10,.0f}")

    return payback_months, roi_3year

payback, roi = enterprise_roi_calculation()
Channel Partnerships
Most robotics companies cannot build a direct sales force large enough to cover their addressable market. Channel partnerships with system integrators, distributors, and value-added resellers (VARs) are essential for scaling go-to-market. Universal Robots' success was largely built on their integrator ecosystem — over 1,100+ certified integrators in 60+ countries doing the selling, installing, and supporting.
| Channel Type | Role | Typical Margin | Best For |
|---|---|---|---|
| System Integrators | Custom solutions, install, programming | 25-40% | Complex deployments, manufacturing |
| Distributors | Inventory, logistics, basic support | 15-25% | Commodity products, broad reach |
| VARs | Solution bundling, industry expertise | 20-35% | Vertical-specific applications |
| OEM Partners | Embed your tech in their product | 40-60% | Components, platforms |
| Strategic Alliances | Joint go-to-market, co-selling | Varies | Enterprise accounts, new markets |
IP & Funding
Intellectual property (IP) in robotics is a competitive moat and fundraising asset. Unlike software where execution speed often matters more than patents, robotics innovations — novel mechanisms, sensor fusion algorithms, material compositions — are highly patentable and can provide genuine competitive protection for 15-20 years.
A comprehensive robotics IP strategy covers multiple layers:
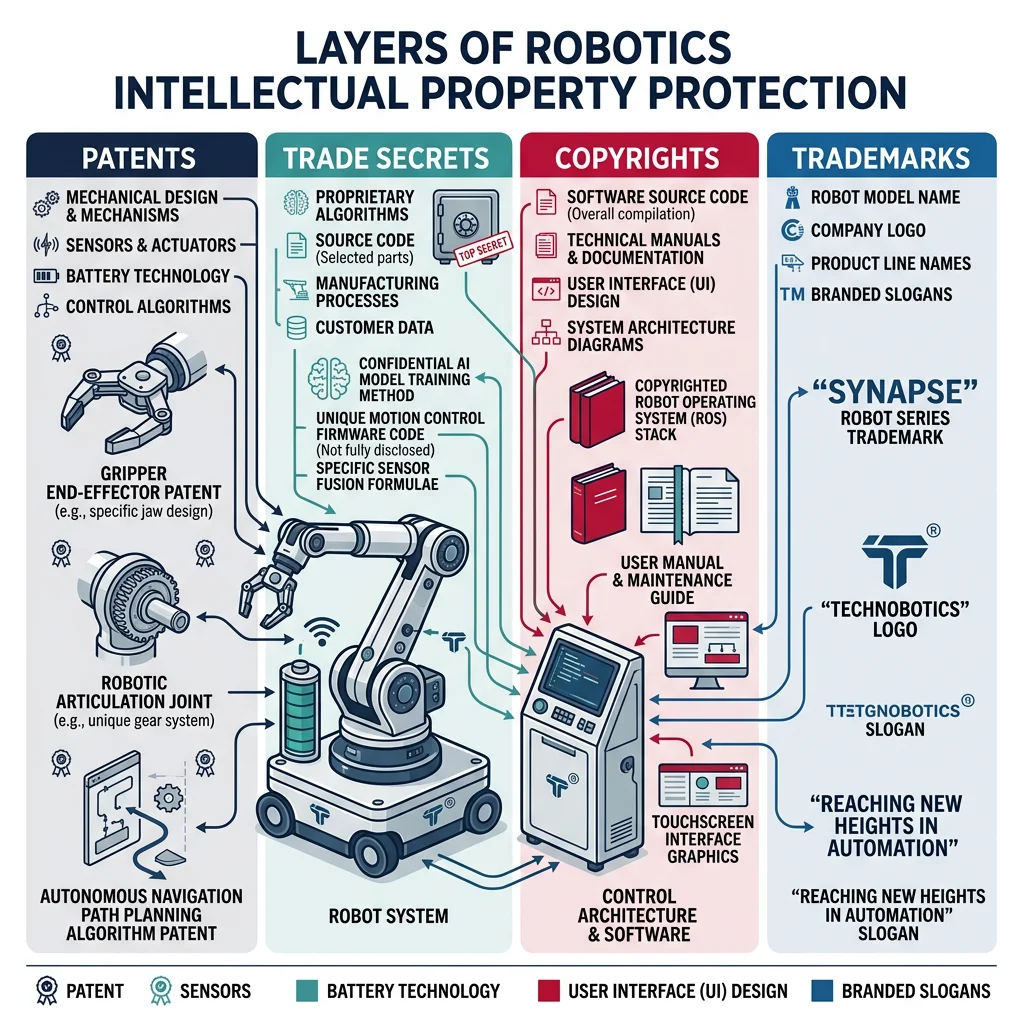
| IP Type | What It Protects | Duration | Cost to File | Robotics Examples |
|---|---|---|---|---|
| Utility Patent | Novel mechanisms, processes | 20 years | $10K-25K | Gripper design, control algorithm, sensor arrangement |
| Design Patent | Ornamental appearance | 15 years | $3K-8K | Robot body shape, UI layout, end-effector form |
| Trade Secret | Confidential know-how | Indefinite | $0 (process cost) | Calibration procedures, training data, supplier relationships |
| Copyright | Software code, documentation | Life + 70 years | $35-85 | Control software, simulation models, training materials |
| Trademark | Brand identity | Indefinite (renewal) | $250-750 | Product names, logos, distinctive sounds |
VC Funding & Pitch
Raising venture capital for robotics requires a different pitch narrative than software. VCs who invest in robotics understand the longer timelines and higher capital requirements, but they need to see defensible technology, massive market pull, and a credible path to gross margins >50% at scale.
Typical robotics funding stages and what VCs expect at each:
| Stage | Amount | What You Need | What VCs Evaluate | Key Metrics |
|---|---|---|---|---|
| Pre-Seed | $500K-2M | Technical demo, team | Founder-market fit, technical depth | Patents filed, team credentials |
| Seed | $2M-8M | Working prototype, 1-3 design partners | Technical risk reduction, market validation | Demo performance, LOIs, pilot pipeline |
| Series A | $10M-30M | Pilot results, early revenue | Product-market fit evidence, unit economics | Revenue/ARR, pilot-to-deploy conversion, COGS trajectory |
| Series B | $30M-80M | Repeatable sales, manufacturing started | Scalable GTM, manufacturing readiness | Growth rate, gross margin trend, CAC/LTV |
| Series C+ | $80M+ | Market leadership, proven unit economics | Category winner potential, path to IPO/exit | Market share, ARR $20M+, GM >50% |
Case Study: Figure AI — Record-Breaking Robotics Fundraising
Figure AI raised $675M in Series B (February 2024) at a $2.6B post-money valuation, making it one of the largest robotics raises ever. What made VCs eager to invest:
- Massive TAM narrative — Humanoid robots addressing the $40T+ global labor market
- Star team — Founded by Brett Adcock (serial entrepreneur), recruited talent from Boston Dynamics, Tesla, Google DeepMind
- Strategic investors — Microsoft, OpenAI, NVIDIA, Jeff Bezos, Intel — signaling conviction from AI/compute leaders
- BMW partnership — Pilot deployment at BMW Spartanburg plant validated industrial usefulness
- AI integration — OpenAI partnership for natural language robot control, differentiating from pure-hardware competitors
Key lesson: At early stages, the narrative + team + strategic partnerships matter more than revenue metrics. Figure had no significant revenue at Series B — the bet was on category-defining potential.
Exits & Acquisitions
Exit outcomes in robotics range from acqui-hires ($10-50M) to transformative acquisitions ($1B+). The most common acquirers are large industrial companies (ABB, Fanuc, Siemens), tech giants (Google/Alphabet, Amazon, Apple), and automotive OEMs (Hyundai, Toyota, BMW) seeking to accelerate their automation capabilities.
| Exit | Year | Acquirer | Value | Revenue Multiple |
|---|---|---|---|---|
| Universal Robots | 2015 | Teradyne | $285M | ~9× revenue |
| Kiva Systems | 2012 | Amazon | $775M | ~25× revenue |
| Boston Dynamics | 2020 | Hyundai | $1.1B | N/A (pre-revenue) |
| MiR (Mobile Industrial Robots) | 2018 | Teradyne | $272M | ~18× revenue |
| Mobileye | 2017 | Intel | $15.3B | ~24× revenue |
| Bear Robotics | IPO 2024 | Public | ~$700M | ~15× revenue |
Business Strategy Planner
Use this interactive planner to develop your robotics business strategy. Fill in the fields below and download your strategy document as Word, Excel, or PDF for investor presentations, team alignment, or business planning.
Robotics Business Strategy Planner
Develop your go-to-market strategy, unit economics, and funding plan. Download as Word, Excel, or PDF.
All data stays in your browser. Nothing is sent to or stored on any server.
Exercises & Challenges
Exercise 1: Unit Economics Deep Dive
Choose a robotics product category (cobot, AMR, drone, or surgical robot). Research the approximate BOM cost, competing products' selling prices, and typical customer ROI.
- Calculate the required selling price for 55% gross margins
- Model a RaaS pricing structure — what monthly fee achieves 24-month payback?
- Identify the target annual volume where manufacturing costs drop below $10K/unit
Exercise 2: Competitive Landscape Mapping
Select the warehouse automation segment and map the competitive landscape:
- Identify 10 companies building warehouse AMRs and categorize by revenue stage
- Create a 2×2 matrix (price vs. capability) positioning each competitor
- Identify the "white space" — underserved segments where a new entrant could win
- Draft a 1-page positioning statement for your hypothetical product
Exercise 3: Investor Pitch Deck Outline
Create a 12-slide pitch deck outline for a robotics startup of your choosing. Each slide should include:
- Slide title and 3-5 key bullet points
- One compelling data point or visual per slide
- Cover: Problem → Solution → Demo → Market → Business Model → Traction → Team → Competition → Financials → Ask
- Use the Business Strategy Planner above to structure your thinking
Conclusion & Next Steps
Building a successful robotics company requires mastering the intersection of deep technology, hardware manufacturing, and business strategy. The key takeaways from this guide:
- Robotics startups are different — longer timelines, higher capital needs, and cross-disciplinary team requirements demand patience and strategic fundraising
- PMF for hardware is harder — validate with design partners, measure real-world performance, and confirm unit economics before scaling
- RaaS transforms economics — recurring revenue models align incentives, reduce customer friction, and build higher enterprise value
- Manufacturing is the moat — scaling from prototype to production is where most startups fail; invest in DFM early and partner with experienced CMs
- Channel is king — system integrators and VARs extend your reach and provide essential customer-facing expertise
- IP matters more in robotics — patents, trade secrets, and fleet data create durable competitive advantages