Back to Technology

System Design Series Part 10: Monitoring & Observability

January 25, 2026 Wasil Zafar 40 min read

Master monitoring and observability to gain deep insights into your distributed systems' health and performance. Learn the three pillars: logs, metrics, and traces.

Table of Contents

  1. Observability
  2. Logging
  3. Metrics
  4. Distributed Tracing
  5. Alerting
  6. Next Steps

Observability

Series Navigation: This is Part 10 of the 15-part System Design Series. Review Part 9: Rate Limiting & Security first.

Observability is the ability to understand the internal state of your system by examining its outputs: logs, metrics, and traces. Unlike traditional monitoring, observability allows you to ask questions you didn't anticipate.

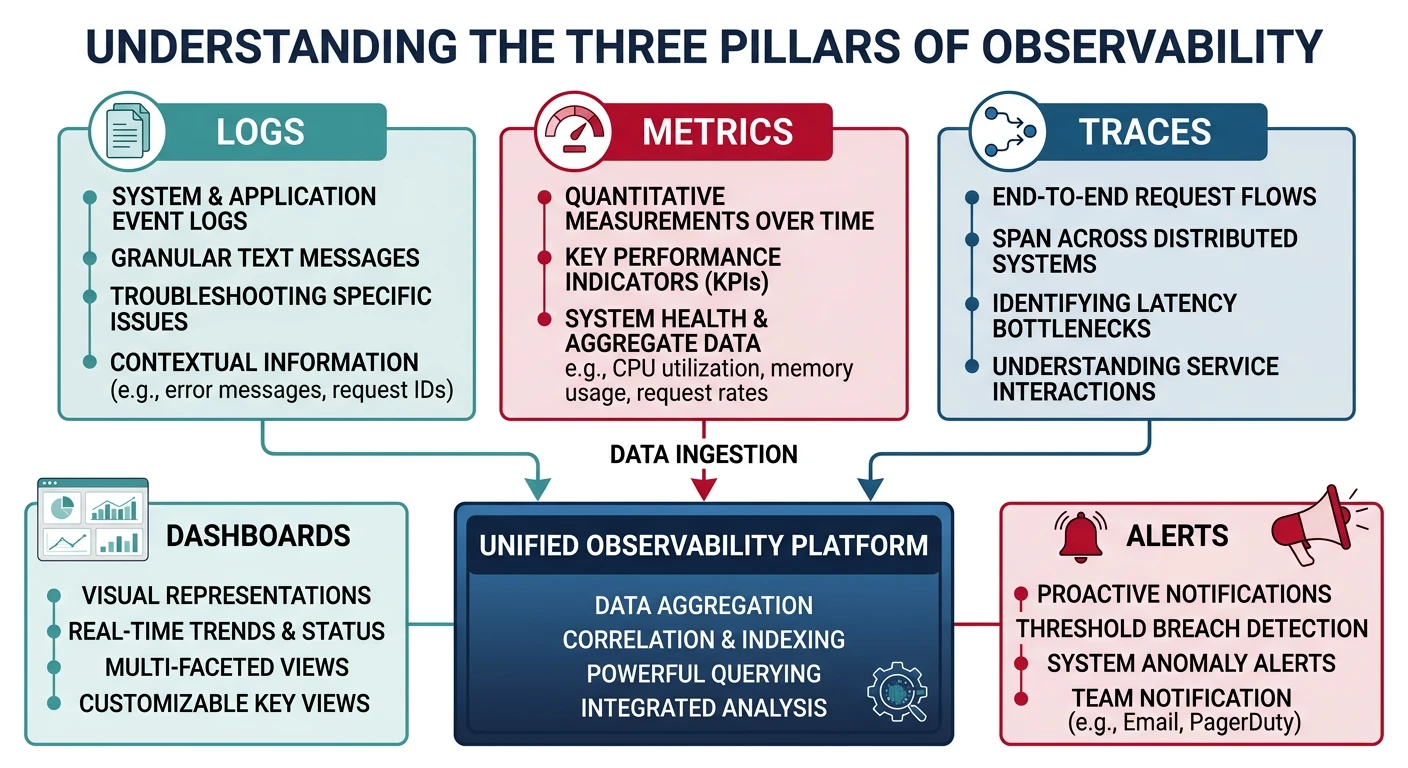
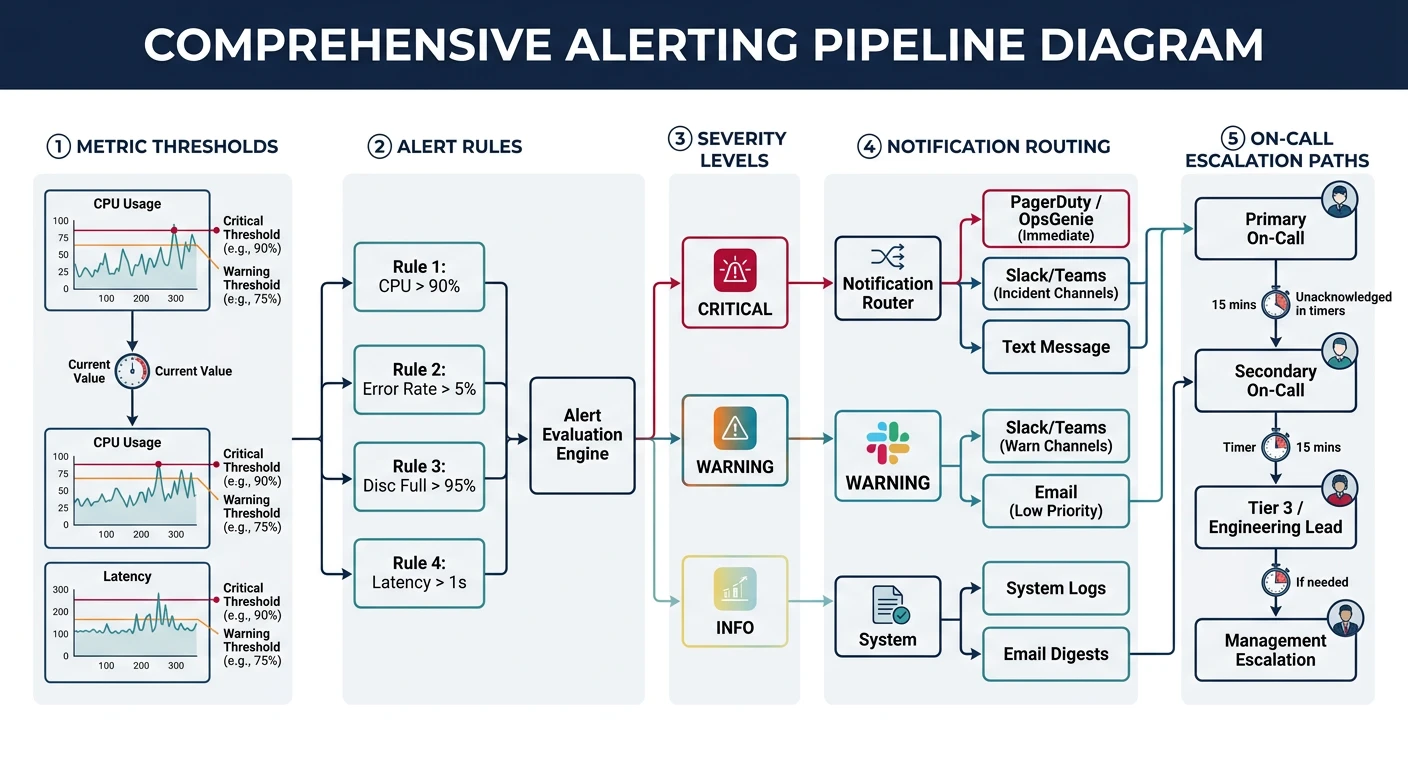
Key Insight: Monitoring tells you when something is wrong. Observability helps you understand why.

The Three Pillars

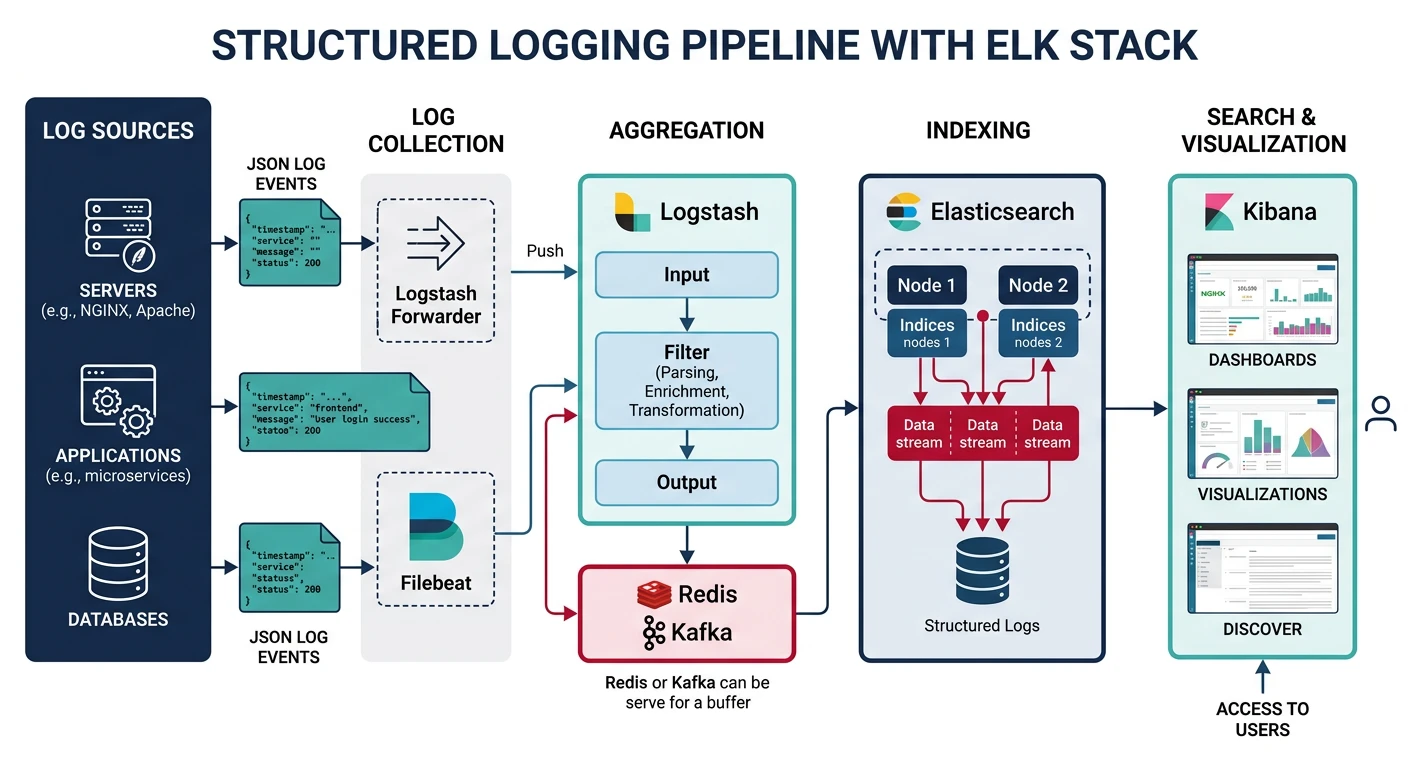
  • Logs: Discrete events with context (what happened)
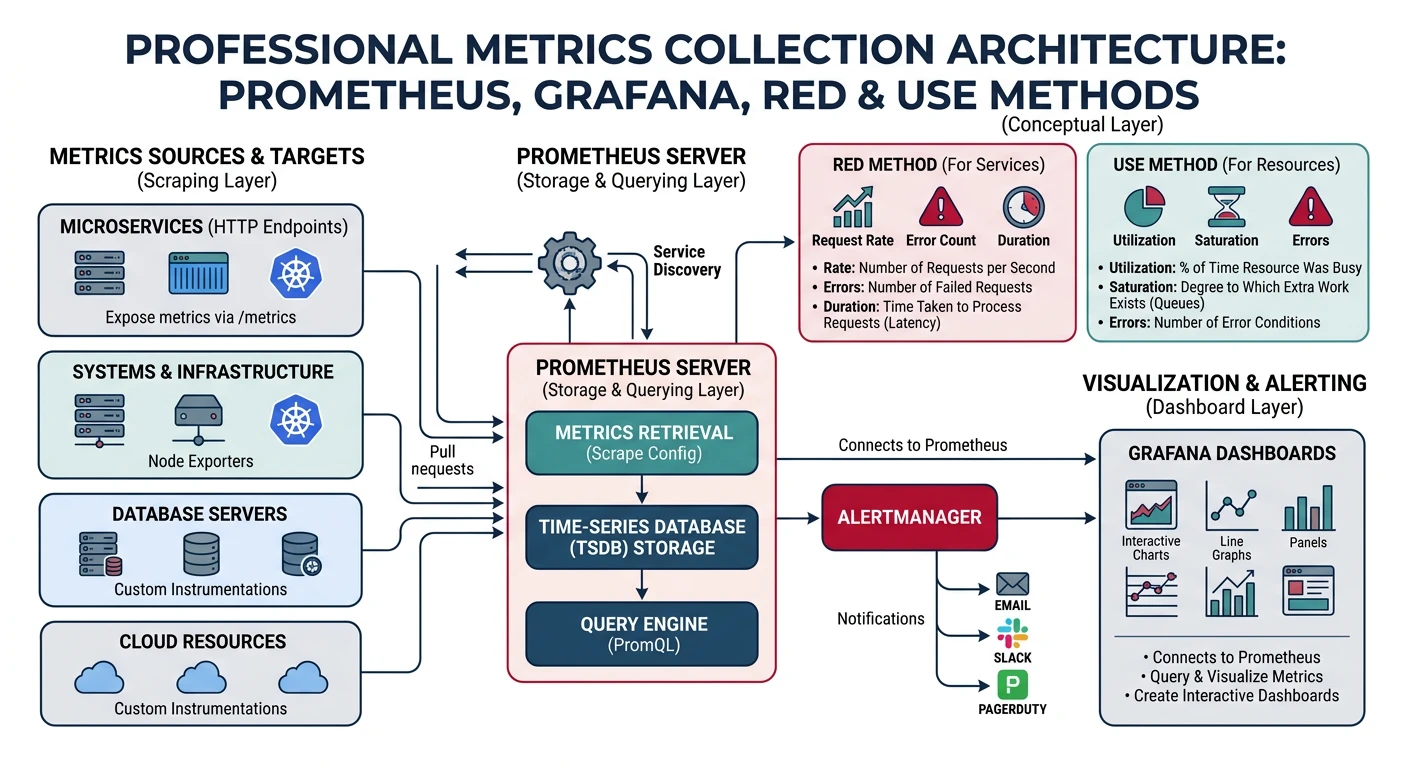
  • Metrics: Numeric measurements over time (how much)
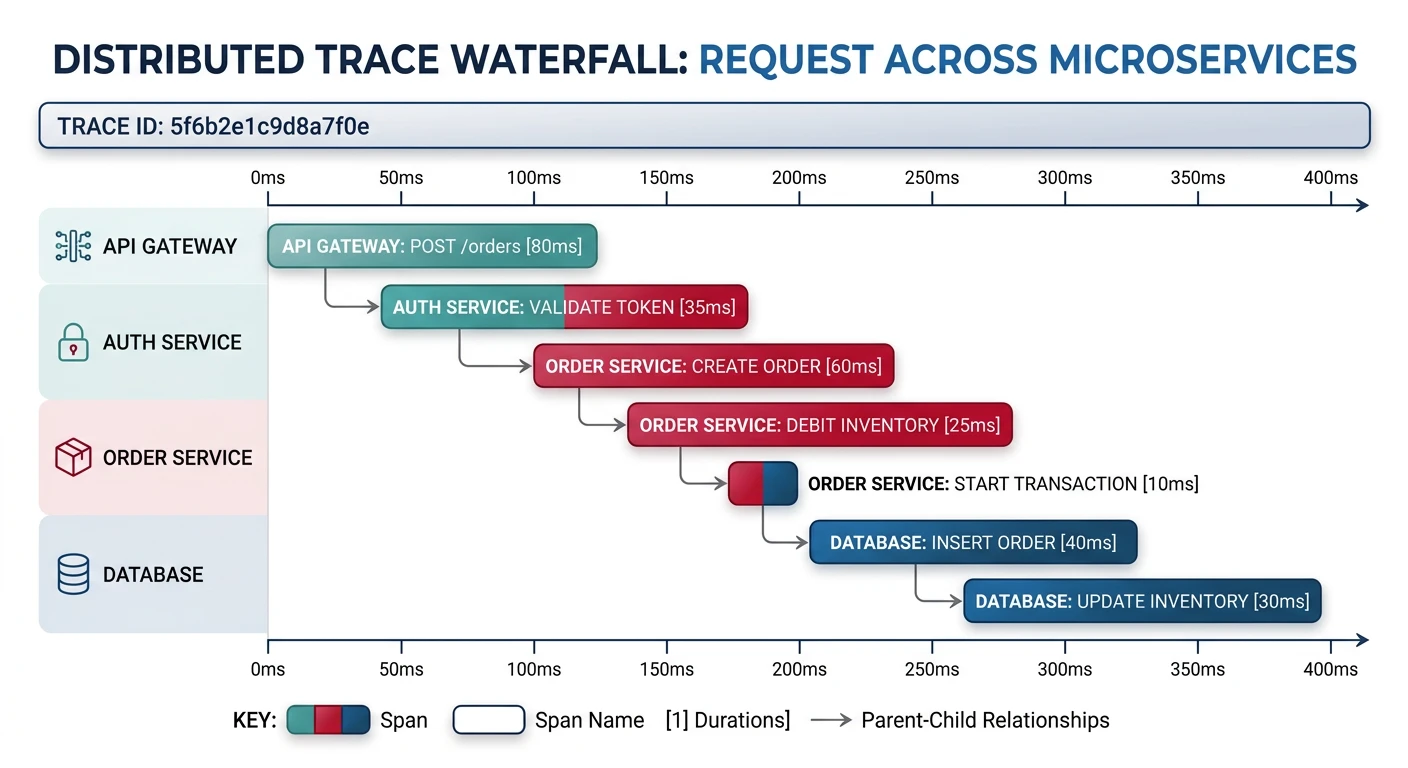
  • Traces: Request journey across services (where/how long)

Monitoring vs Observability

Aspect Monitoring Observability
Approach Predefined checks and alerts Explore and query any dimension
Questions Known unknowns Unknown unknowns
Focus Is it working? Why isn't it working?
Data Aggregated metrics High-cardinality, correlated data
Example CPU > 80% alert Why is user X experiencing slow responses?

Logging

Logs are timestamped records of discrete events. Structured logging makes logs queryable and analyzable.

Structured Logging

# Structured Logging with Python
import structlog
import logging

# Configure structured logging
structlog.configure(
    processors=[
        structlog.stdlib.filter_by_level,
        structlog.stdlib.add_logger_name,
        structlog.stdlib.add_log_level,
        structlog.processors.TimeStamper(fmt="iso"),
        structlog.processors.JSONRenderer()
    ],
    wrapper_class=structlog.stdlib.BoundLogger,
    logger_factory=structlog.stdlib.LoggerFactory(),
)

logger = structlog.get_logger()

# BAD: Unstructured logging
logger.info("User john created order 123 for $99.99")

# GOOD: Structured logging
logger.info(
    "order_created",
    user_id="john",
    order_id="123",
    amount=99.99,
    currency="USD",
    items_count=3
)

# Output (JSON - easily searchable):
# {
#     "event": "order_created",
#     "user_id": "john",
#     "order_id": "123",
#     "amount": 99.99,
#     "currency": "USD",
#     "items_count": 3,
#     "timestamp": "2024-01-15T10:30:00Z",
#     "level": "info"
# }

Log Levels

# Log Levels - Use appropriately
import logging

# DEBUG: Detailed diagnostic info (development)
logger.debug("Entering function process_order", order_id="123")

# INFO: Normal operation events
logger.info("Order processed successfully", order_id="123")

# WARNING: Unexpected but handled situations
logger.warning("Payment retry needed", order_id="123", attempt=2)

# ERROR: Operation failed but system continues
logger.error("Payment failed", order_id="123", error="card_declined")

# CRITICAL: System failure, immediate attention needed
logger.critical("Database connection lost", host="db-primary")

# Log level guidelines:
# Production: INFO and above
# Debugging: DEBUG and above
# Never log: passwords, tokens, PII without masking

Logging Best Practices

  • Correlation IDs: Track requests across services with unique IDs
  • Contextual Info: Include user_id, request_id, service_name
  • Don't Log Secrets: Mask or exclude sensitive data
  • Log at Boundaries: Entry/exit of services, APIs, external calls

Log Aggregation

Centralize logs from all services for unified search and analysis.

ELK Stack (Elasticsearch, Logstash, Kibana)

# Logstash Configuration
# logstash.conf
input {
  beats {
    port => 5044
  }
}

filter {
  json {
    source => "message"
  }
  
  date {
    match => ["timestamp", "ISO8601"]
  }
  
  # Add derived fields
  if [response_time] {
    mutate {
      add_field => {
        "is_slow" => "%{[response_time] > 1000}"
      }
    }
  }
}

output {
  elasticsearch {
    hosts => ["elasticsearch:9200"]
    index => "logs-%{+YYYY.MM.dd}"
  }
}
Elasticsearch Kibana

Log Aggregation Comparison

Tool Type Best For
ELK Stack Self-hosted Full control, customization
Loki + Grafana Self-hosted Low overhead, Prometheus integration
Datadog SaaS Full observability platform
CloudWatch AWS AWS-native workloads
Splunk Enterprise Large-scale, compliance

Metrics

Metrics are numeric measurements collected over time. They're efficient for dashboards, alerts, and trend analysis.

Metric Types

  • Counter: Monotonically increasing value (requests_total, errors_total)
  • Gauge: Point-in-time value that can increase/decrease (temperature, queue_size)
  • Histogram: Distribution of values (response_time buckets)
  • Summary: Pre-calculated quantiles (p50, p95, p99)

RED Method (Request-focused)

For every service, measure:

# RED Method - Essential service metrics
from prometheus_client import Counter, Histogram

# Rate: Requests per second
requests_total = Counter(
    'http_requests_total',
    'Total HTTP requests',
    ['method', 'endpoint', 'status']
)

# Errors: Failed requests per second
errors_total = Counter(
    'http_errors_total',
    'Total HTTP errors',
    ['method', 'endpoint', 'error_type']
)

# Duration: Response time distribution
request_duration = Histogram(
    'http_request_duration_seconds',
    'HTTP request duration',
    ['method', 'endpoint'],
    buckets=[.005, .01, .025, .05, .1, .25, .5, 1, 2.5, 5, 10]
)

# Usage in request handler
@app.route('/api/orders', methods=['POST'])
def create_order():
    with request_duration.labels(
        method='POST', 
        endpoint='/api/orders'
    ).time():
        try:
            result = process_order(request.json)
            requests_total.labels(
                method='POST',
                endpoint='/api/orders',
                status='200'
            ).inc()
            return result
        except Exception as e:
            errors_total.labels(
                method='POST',
                endpoint='/api/orders',
                error_type=type(e).__name__
            ).inc()
            raise

USE Method (Resource-focused)

For every resource (CPU, memory, disk, network):

# USE Method - Resource metrics
# U - Utilization: % time resource is busy
# S - Saturation: Amount of queued work  
# E - Errors: Error count

# CPU Metrics
cpu_utilization = Gauge('cpu_utilization_percent', 'CPU utilization')
cpu_saturation = Gauge('cpu_load_average', 'CPU load average')

# Memory Metrics
memory_utilization = Gauge('memory_used_bytes', 'Memory used')
memory_saturation = Gauge('memory_swap_used_bytes', 'Swap used')

# Disk Metrics
disk_utilization = Gauge('disk_used_percent', 'Disk used', ['mount'])
disk_io_saturation = Gauge('disk_io_queue_depth', 'IO queue depth', ['device'])

# Network Metrics
network_utilization = Gauge('network_bytes_total', 'Network bytes', ['interface', 'direction'])
network_errors = Counter('network_errors_total', 'Network errors', ['interface', 'type'])

Prometheus & Grafana

Prometheus Configuration

# prometheus.yml
global:
  scrape_interval: 15s
  evaluation_interval: 15s

alerting:
  alertmanagers:
    - static_configs:
        - targets: ['alertmanager:9093']

rule_files:
  - "alert_rules.yml"

scrape_configs:
  - job_name: 'api-servers'
    static_configs:
      - targets: ['api1:8080', 'api2:8080', 'api3:8080']
    
  - job_name: 'kubernetes-pods'
    kubernetes_sd_configs:
      - role: pod
    relabel_configs:
      - source_labels: [__meta_kubernetes_pod_annotation_prometheus_io_scrape]
        action: keep
        regex: true

PromQL Queries

# Request rate (requests per second)
rate(http_requests_total[5m])

# Error rate percentage
sum(rate(http_requests_total{status=~"5.."}[5m])) 
/ sum(rate(http_requests_total[5m])) * 100

# 95th percentile response time
histogram_quantile(0.95, 
  sum(rate(http_request_duration_seconds_bucket[5m])) by (le)
)

# Top 5 endpoints by request count
topk(5, sum by (endpoint) (rate(http_requests_total[1h])))

# Memory usage per pod
container_memory_usage_bytes{namespace="production"}

# CPU throttling
rate(container_cpu_cfs_throttled_seconds_total[5m])

Distributed Tracing

Traces follow requests as they flow through multiple services, revealing latency bottlenecks and dependencies.

Trace Anatomy

# Trace structure
# Trace: End-to-end request journey (one trace_id)
# Span: Single operation within a trace (many spans per trace)
# Context: trace_id + span_id propagated between services

"""
Trace: user_checkout (trace_id: abc123)
+-- Span: api-gateway (50ms)
¦   +-- Span: auth-service.verify_token (10ms)
¦   +-- Span: order-service.create_order (35ms)
¦       +-- Span: inventory-service.reserve (15ms)
¦       +-- Span: payment-service.charge (18ms)
¦       +-- Span: db.insert_order (2ms)
"""

# Each span contains:
# - trace_id: Links all spans in a trace
# - span_id: Unique identifier for this span
# - parent_span_id: Parent span (null for root)
# - operation_name: What operation this represents
# - start_time, duration: Timing
# - tags: Key-value metadata
# - logs: Timestamped events within span

OpenTelemetry

OpenTelemetry (OTel) is the standard for instrumenting distributed systems. It provides unified APIs for traces, metrics, and logs.

OpenTelemetry Python

# OpenTelemetry Setup
from opentelemetry import trace
from opentelemetry.sdk.trace import TracerProvider
from opentelemetry.sdk.trace.export import BatchSpanProcessor
from opentelemetry.exporter.otlp.proto.grpc.trace_exporter import OTLPSpanExporter
from opentelemetry.instrumentation.flask import FlaskInstrumentor
from opentelemetry.instrumentation.requests import RequestsInstrumentor

# Configure tracing
trace.set_tracer_provider(TracerProvider())
tracer = trace.get_tracer(__name__)

# Export to Jaeger/Tempo/etc
otlp_exporter = OTLPSpanExporter(endpoint="http://collector:4317")
trace.get_tracer_provider().add_span_processor(
    BatchSpanProcessor(otlp_exporter)
)

# Auto-instrument frameworks
FlaskInstrumentor().instrument()
RequestsInstrumentor().instrument()

# Manual instrumentation
@tracer.start_as_current_span("process_payment")
def process_payment(order_id, amount):
    span = trace.get_current_span()
    span.set_attribute("order_id", order_id)
    span.set_attribute("amount", amount)
    
    with tracer.start_as_current_span("validate_card") as child_span:
        child_span.set_attribute("card_type", "visa")
        validate_card()
    
    with tracer.start_as_current_span("charge_card"):
        result = charge_card(amount)
        span.add_event("payment_completed", {"status": result.status})
    
    return result

Tracing Tools Comparison

Tool Type Best For
Jaeger Self-hosted Kubernetes, microservices
Zipkin Self-hosted Simple setup, Spring Boot
Tempo Self-hosted Grafana ecosystem, cost-effective
AWS X-Ray AWS AWS-native workloads
Datadog APM SaaS Full platform, ML insights

Alerting

Alert Rules

# Prometheus Alert Rules
groups:
  - name: sla_alerts
    rules:
      # High error rate
      - alert: HighErrorRate
        expr: |
          sum(rate(http_requests_total{status=~"5.."}[5m])) 
          / sum(rate(http_requests_total[5m])) > 0.01
        for: 5m
        labels:
          severity: critical
        annotations:
          summary: "Error rate above 1%"
          description: "{{ $value | humanizePercentage }} error rate"
      
      # Slow responses
      - alert: HighLatency
        expr: |
          histogram_quantile(0.95, 
            sum(rate(http_request_duration_seconds_bucket[5m])) by (le)
          ) > 0.5
        for: 10m
        labels:
          severity: warning
        annotations:
          summary: "P95 latency above 500ms"
      
      # Service down
      - alert: ServiceDown
        expr: up == 0
        for: 1m
        labels:
          severity: critical
        annotations:
          summary: "{{ $labels.job }} is down"
Alerting Best Practices:
  • Alert on symptoms, not causes: "Users experiencing errors" not "CPU high"
  • Include runbook links: What to do when alert fires
  • Avoid alert fatigue: Every alert should be actionable
  • Use severity levels: Critical (page), Warning (ticket), Info (dashboard)

SLOs and Error Budgets

# Service Level Objectives (SLOs)
# Define target reliability

# SLI: Service Level Indicator (what you measure)
# SLO: Service Level Objective (target for SLI)
# Error Budget: 100% - SLO (acceptable failure)

# Example SLOs:
# Availability: 99.9% of requests successful
# Latency: 95% of requests < 200ms

# Error Budget Calculation:
# 99.9% availability = 0.1% error budget
# Monthly: 43,200 minutes * 0.001 = 43.2 minutes downtime allowed

# Alert when burning error budget too fast
# burn_rate = error_rate / (1 - SLO)
# Alert if burn_rate > 14.4 (burns monthly budget in 2 days)

Next Steps

Observability & Monitoring Plan Generator

Design your monitoring stack with the three pillars of observability, SLOs, and alerting strategy. Download as Word, Excel, or PDF.

Draft auto-saved

All data stays in your browser. Nothing is sent to or stored on any server.

Technology