We use cookies to enhance your browsing experience, serve personalized content, and analyze our traffic.
By clicking "Accept All", you consent to our use of cookies. See our
Privacy Policy
for more information.
Phase 16 Goals: By the end of this phase, your OS will have disk and page caching, an optimized scheduler, efficient memory allocation, and profiling tools to measure and improve performance.
We've built a functional operating system over 15 phases. But "works" isn't the same as "works well". An OS that freezes when copying files or stutters during video playback isn't usable. Performance optimization is what transforms a toy OS into something production-ready.
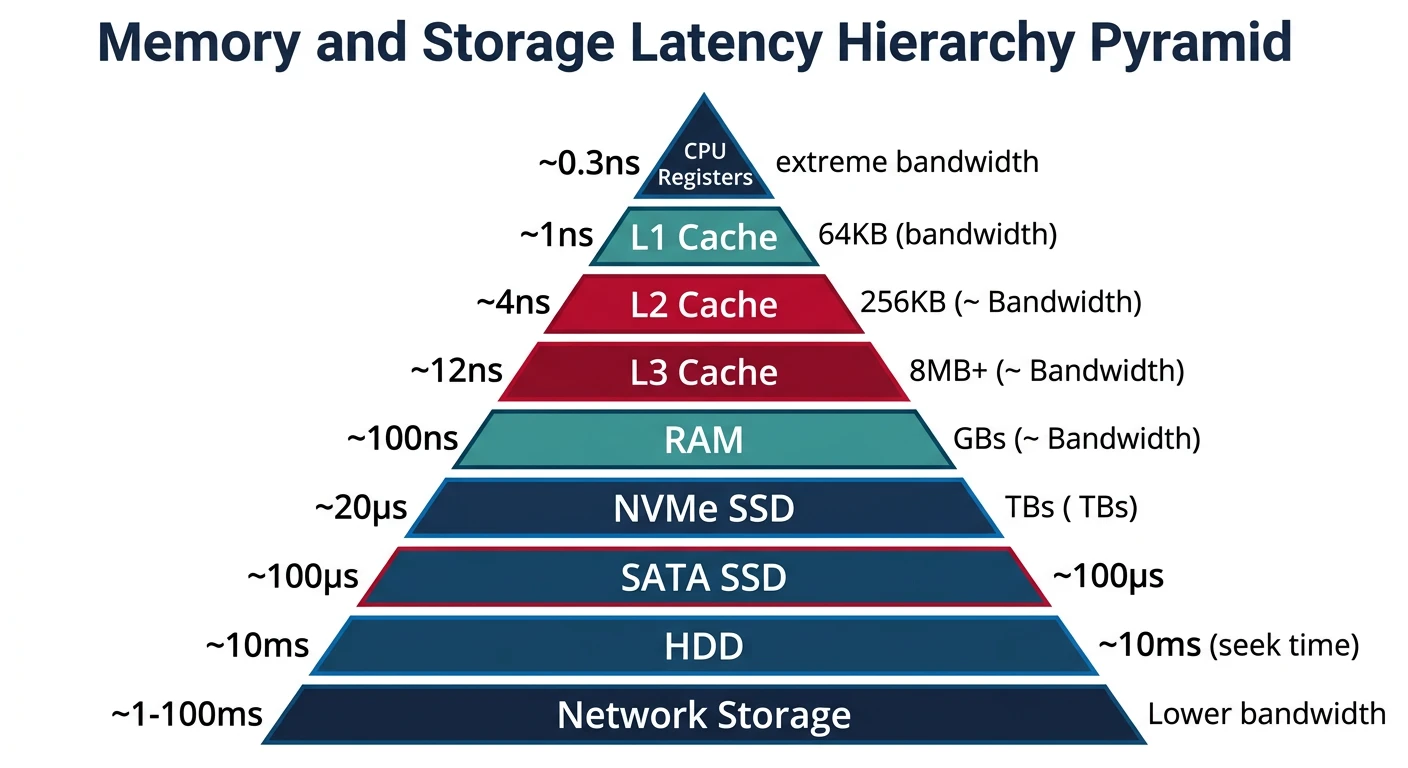
Memory and storage latency hierarchy — from 1ns registers to 10ms disk access
╔═════════════════════════════════════════════════════════════════════════════╗║ MEMORY & STORAGE LATENCY HIERARCHY ║╠═════════════════════════════════════════════════════════════════════════════╣║║║Access TimeComponentTypical Size║║────────────────────────────────────────────║║║║~1 nsL1 Cache32-64 KB║║~4 nsL2 Cache256 KB - 1 MB║║~10 nsL3 Cache8-64 MB║║~100 nsRAM (DDR4/5)8-128 GB║║~10,000 nsNVMe SSD256 GB - 8 TB║║~10,000,000 nsHDD (Spinning)1-20 TB║║║║HDD is 10,000,000x slower than L1 cache!║║Caching transforms disk access from unusable to instant.║║║╚═════════════════════════════════════════════════════════════════════════════╝
Key Insight: Making an OS fast requires understanding where time is spent. Caching reduces disk latency, scheduler tuning improves responsiveness, and memory optimizations reduce allocation overhead.
Performance Mindset
Before optimizing, you need to measure. Donald Knuth famously said: "Premature optimization is the root of all evil." The corollary is: profile first, optimize second.
Principle
Meaning
Example
Measure First
Profile before optimizing
Find that 90% of time is in disk I/O, not CPU
Amdahl's Law
Speedup limited by serial portions
10% serial code limits speedup to 10x max
Locality
Access nearby data together
Array of structs vs struct of arrays
Avoid Copies
Zero-copy where possible
Pass pointers, use DMA for disk I/O
Batch Operations
Amortize overhead over many items
Write 100 sectors at once, not 1 at a time
Common Bottlenecks
In an OS, the major performance bottlenecks are:
╔═════════════════════════════════════════════════════════════════════════════╗║ OS PERFORMANCE BOTTLENECKS ║╠═════════════════════════════════════════════════════════════════════════════╣║║║┌───────────────────────────────────────────────────────────────────┐║║│1. DISK I/O ─ Uncached disk reads are killers (~10ms each!) │║║│ → Solution: Block cache, read-ahead, async I/O │║║└───────────────────────────────────────────────────────────────────┘║║║║┌───────────────────────────────────────────────────────────────────┐║║│2. CONTEXT SWITCHES ─ Task switching overhead adds up │║║│ → Solution: Smart scheduler, longer time slices where OK │║║└───────────────────────────────────────────────────────────────────┘║║║║┌───────────────────────────────────────────────────────────────────┐║║│3. MEMORY ALLOCATION ─ malloc/free are surprisingly slow │║║│ → Solution: Slab allocator, object pools │║║└───────────────────────────────────────────────────────────────────┘║║║║┌───────────────────────────────────────────────────────────────────┐║║│4. TLB MISSES ─ Page table walks are expensive (~100 cycles) │║║│ → Solution: Huge pages, minimize mappings, locality │║║└───────────────────────────────────────────────────────────────────┘║║║║┌───────────────────────────────────────────────────────────────────┐║║│5. LOCK CONTENTION ─ Threads waiting on each other │║║│ → Solution: Lock-free structures, finer-grained locks │║║└───────────────────────────────────────────────────────────────────┘║║║╚═════════════════════════════════════════════════════════════════════════════╝
Caching Strategies
Caching is the single most important performance optimization in an OS. By keeping frequently accessed data in memory, we avoid slow disk operations. A good cache can make your OS feel 100x faster!
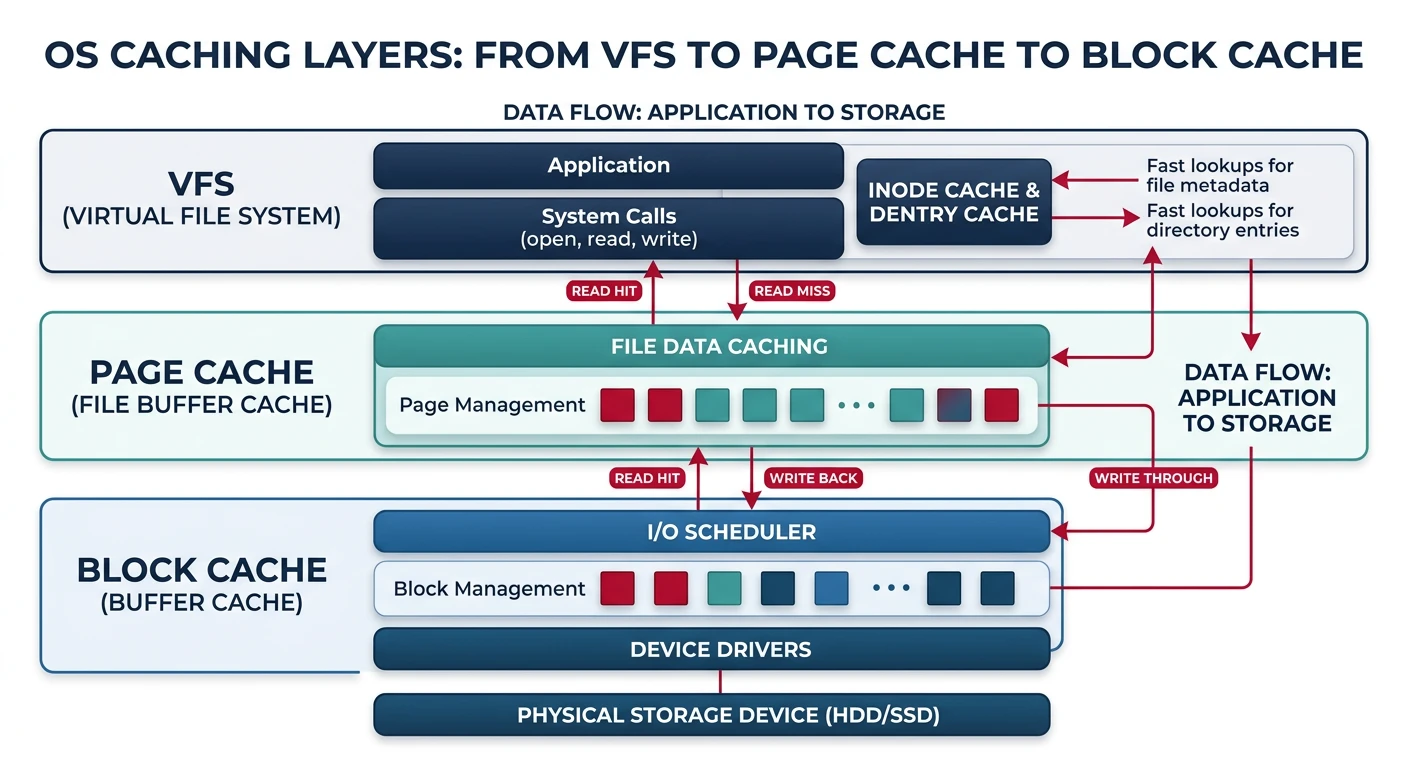
OS caching layers — VFS cache, page cache, and block cache working together
╔═════════════════════════════════════════════════════════════════════════════╗║ OS CACHING LAYERS ║╠═════════════════════════════════════════════════════════════════════════════╣║║║Application║║ │ ║║ ▼ read("/home/user/file.txt")║║┌─────────────────────────────┐║║│Page Cache│File data cached as memory pages║║│(virtual file pages)│Serves most read() calls from RAM║║└─────────────┬───────────────┘║║ │ ║║ ▼ Page miss → lookup block number║║┌─────────────────────────────┐║║│Block Cache│Raw disk sectors cached in RAM║║│(disk sectors/blocks)│Indexed by (device, block_num)║║└─────────────┬───────────────┘║║ │ ║║ ▼ Block miss → actual disk I/O║║┌─────────────────────────────┐║║│Disk Driver│AHCI/NVMe actually reads from disk║║│(SLOW! Avoid at all cost)│HDD: ~10ms, SSD: ~0.1ms║║└─────────────────────────────┘║║║╚═════════════════════════════════════════════════════════════════════════════╝
Block Cache
The block cache stores recently accessed disk sectors in memory. Before reading from disk, we check the cache—a hit returns instantly (nanoseconds vs. milliseconds).
/* Block Cache Entry */
typedef struct cache_entry {
    uint64_t block_num;         // Disk block number
    uint8_t* data;              // Block data (512/4096 bytes)
    uint32_t flags;             // Dirty, valid, etc.
    uint64_t access_time;       // For LRU eviction
    struct cache_entry* next;   // Hash chain
    struct cache_entry* lru_prev;
    struct cache_entry* lru_next;
} cache_entry_t;

/* Block Cache */
#define CACHE_SIZE 1024  // Number of cached blocks
#define HASH_SIZE  256

typedef struct {
    cache_entry_t* hash[HASH_SIZE];
    cache_entry_t* lru_head;
    cache_entry_t* lru_tail;
    uint32_t hits;
    uint32_t misses;
} block_cache_t;

/* Get cached block or read from disk */
cache_entry_t* cache_get(block_cache_t* cache, uint64_t block) {
    uint32_t hash = block % HASH_SIZE;

    // Search hash chain
    for (cache_entry_t* e = cache->hash[hash]; e; e = e->next) {
        if (e->block_num == block) {
            cache->hits++;
            lru_touch(cache, e);  // Move to front
            return e;
        }
    }

    // Cache miss - read from disk
    cache->misses++;
    cache_entry_t* entry = lru_evict_or_alloc(cache);
    entry->block_num = block;
    disk_read(block, entry->data);

    // Insert into hash
    entry->next = cache->hash[hash];
    cache->hash[hash] = entry;

    return entry;
}
Cache Hit Rate: Track hits / (hits + misses). A good block cache achieves 90%+ hit rate for typical workloads. Even 90% means only 10% of accesses hit disk!
Page Cache
While the block cache stores raw sectors, the page cache stores file data as memory pages. This integrates with virtual memory—a memory-mapped file is just pages in the page cache!
/* Page Cache - Indexed by (inode, offset) */
typedef struct page_cache_entry {
    struct inode* inode;        // File inode
    uint64_t offset;            // Page offset within file
    void* page;                 // 4KB page of file data
    uint32_t flags;             // PG_DIRTY, PG_UPTODATE, etc.
    atomic_t ref_count;         // Reference count
    struct list_head lru;       // LRU list linkage
    struct hlist_node hash;     // Hash table linkage
} page_cache_entry_t;

/* Find or create page in cache */
page_cache_entry_t* page_cache_lookup(struct inode* inode, uint64_t offset) {
    uint64_t page_offset = offset & ~0xFFF;  // Align to page
    uint32_t hash = hash_page(inode, page_offset);

    // Search hash bucket
    spin_lock(&page_cache_lock);
    page_cache_entry_t* entry;
    hlist_for_each_entry(entry, &page_hash[hash], hash) {
        if (entry->inode == inode && entry->offset == page_offset) {
            atomic_inc(&entry->ref_count);
            lru_touch(entry);  // Move to front of LRU
            spin_unlock(&page_cache_lock);
            return entry;
        }
    }
    spin_unlock(&page_cache_lock);

    // Cache miss - allocate new page and read from disk
    entry = alloc_page_cache_entry();
    entry->inode = inode;
    entry->offset = page_offset;
    entry->page = alloc_page();

    // Read file data into page (uses block cache internally)
    inode->i_op->readpage(inode, entry->page, page_offset);

    // Insert into cache
    spin_lock(&page_cache_lock);
    hlist_add_head(&entry->hash, &page_hash[hash]);
    list_add(&entry->lru, &page_lru_list);
    spin_unlock(&page_cache_lock);

    return entry;
}

/* Memory-mapped file read - just returns cached page */
void* mmap_read(struct file* file, uint64_t offset) {
    page_cache_entry_t* entry = page_cache_lookup(file->f_inode, offset);
    return entry->page + (offset & 0xFFF);  // Return pointer within page
}
LRU Eviction
When the cache is full, we need to evict old entries. LRU (Least Recently Used) is the classic algorithm—evict the entry that hasn't been accessed for the longest time.
/* LRU List Operations - O(1) */
void lru_touch(block_cache_t* cache, cache_entry_t* entry) {
    // Remove from current position
    if (entry->lru_prev) entry->lru_prev->lru_next = entry->lru_next;
    if (entry->lru_next) entry->lru_next->lru_prev = entry->lru_prev;
    if (cache->lru_tail == entry) cache->lru_tail = entry->lru_prev;

    // Insert at head
    entry->lru_prev = NULL;
    entry->lru_next = cache->lru_head;
    if (cache->lru_head) cache->lru_head->lru_prev = entry;
    cache->lru_head = entry;
    if (!cache->lru_tail) cache->lru_tail = entry;
}

cache_entry_t* lru_evict(block_cache_t* cache) {
    cache_entry_t* victim = cache->lru_tail;
    if (!victim) return NULL;

    // Remove from tail
    cache->lru_tail = victim->lru_prev;
    if (cache->lru_tail) cache->lru_tail->lru_next = NULL;
    else cache->lru_head = NULL;

    // If dirty, write back to disk first
    if (victim->flags & CACHE_DIRTY) {
        disk_write(victim->block_num, victim->data);
    }

    // Remove from hash chain
    cache_hash_remove(cache, victim);

    return victim;
}
Write-Back vs Write-Through:
Write-Through: Every write immediately goes to disk. Safe but slow.
Write-Back: Writes stay in cache (marked dirty), flushed later. Fast but requires careful fsync.
Scheduler Tuning
The scheduler determines which process runs when. A bad scheduler makes the system feel sluggish even with a fast CPU. Good scheduling balances throughput (total work done) with latency (responsiveness to user input).
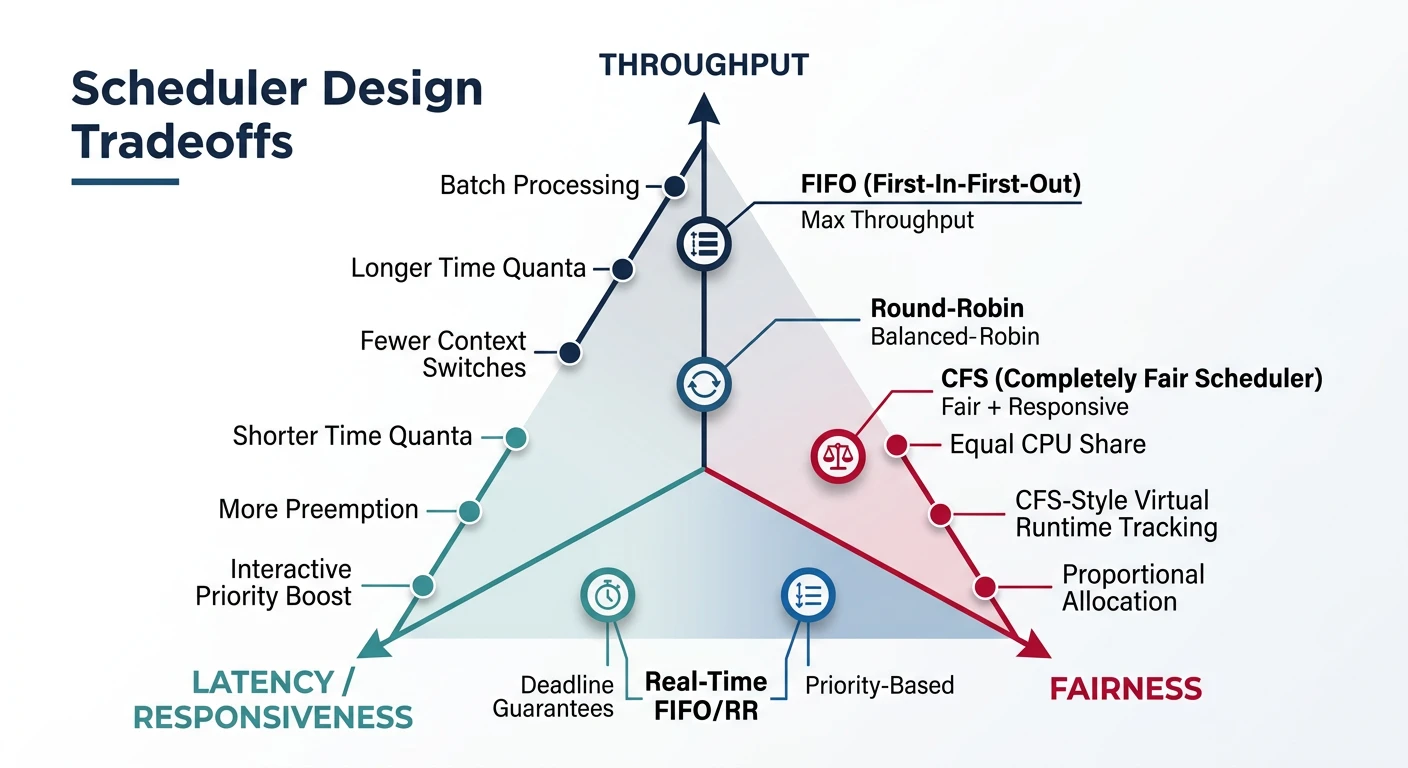
Scheduler design tradeoffs — balancing throughput, latency, and fairness
╔═════════════════════════════════════════════════════════════════════════════╗║ SCHEDULER DESIGN TRADEOFFS ║╠═════════════════════════════════════════════════════════════════════════════╣║║║┌─────────────────────────────────┐┌──────────────────────────────┐║║│THROUGHPUT││LATENCY│║║│Total work completed/second││Time to respond to events│║║││││║║│• Long time slices││• Short time slices│║║│• Batch processing││• Interactive priority│║║│• Minimize context switches││• Preemption│║║└─────────────────────────────────┘└──────────────────────────────┘║║║║Server (compile farm): Throughput priority║║Desktop (user interaction): Latency priority║║Real-time (audio): Hard latency guarantees║║║╚═════════════════════════════════════════════════════════════════════════════╝
Priority Queues (MLFQ)
Multi-Level Feedback Queue (MLFQ) is a classic scheduler that automatically categorizes processes. New processes start at high priority (assumed interactive). If they use their full time slice, they're demoted (likely CPU-bound batch). If they yield early, they stay high (likely I/O-bound interactive).
Linux's Completely Fair Scheduler (CFS) uses a red-black tree to give each task a "fair" share of CPU. Instead of fixed priority queues, CFS tracks virtual runtime (vruntime)—the amount of CPU time a task "should" have received.
╔═════════════════════════════════════════════════════════════════════════════╗║ CFS RED-BLACK TREE (sorted by vruntime) ║╠═════════════════════════════════════════════════════════════════════════════╣║║║┌───────────┐║║│ Task C │║║│ vrun=500 │║║└─────┬─────┘║║ ┌──────────┴──────────┐ ║║ ▼ ▼ ║║┌───────────┐┌───────────┐║║│ Task A ││ Task E │║║│ vrun=200 ││ vrun=800 │║║└─────┬─────┘└───────────┘║║ ┌──────────┴──────────┐ ║║ ▼ ▼ ║║┌───────────┐┌───────────┐║║│ Task B │←LEFTMOST │ Task D │║║│ vrun=100 ││ vrun=350 │║║└───────────┘└───────────┘║║^ NEXT TO RUN║║║║• Leftmost node = smallest vruntime = most "starved" for CPU║║• After running, task's vruntime increases, moves right in tree║║• Nice value affects HOW FAST vruntime increases (lower nice = slower)║║║╚═════════════════════════════════════════════════════════════════════════════╝
Why vruntime is Brilliant: CFS doesn't need complex priority queues. A task that used 50ms of CPU will have higher vruntime than one that used 10ms—so the 10ms task runs next. The "nice" value affects the rate at which vruntime increases.
Scheduler
Data Structure
Complexity
Best For
Round-Robin
Queue
O(1)
Simple, equal priority
MLFQ
Multiple Queues
O(1)
Auto-detects interactive
CFS
Red-Black Tree
O(log n)
General-purpose fairness
EDF
Sorted by deadline
O(n) or O(log n)
Real-time systems
Memory Optimization
Memory management has hidden costs that cripple performance when ignored. Every memory access triggers address translation, and every allocation has overhead. Optimizing these paths makes a huge difference.
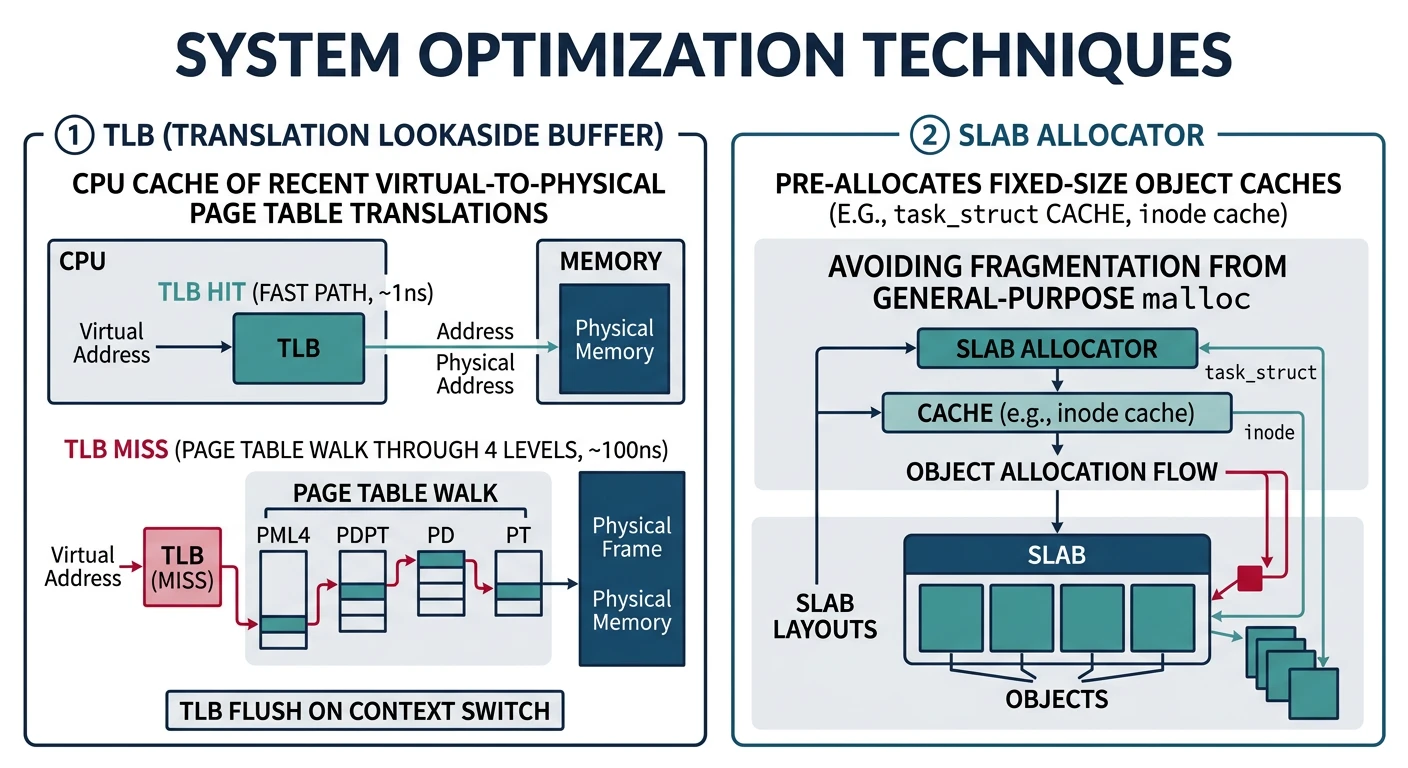
The Translation Lookaside Buffer (TLB) caches recent page table lookups. A TLB hit is ~1 cycle; a TLB miss requires a page table walk (~100 cycles on x86-64 with 4-level paging). With thousands of memory accesses per function call, TLB efficiency is critical!
╔═════════════════════════════════════════════════════════════════════════════╗║ TLB HIT vs MISS ║╠═════════════════════════════════════════════════════════════════════════════╣║║║TLB HIT (~1 cycle)║║┌───────────┐hit!┌────────────────┐║║│ CPU │─────────▶│ TLB Cache │──────▶ Physical Address ║║│ (virtual) ││ (64-1024 entries)│║║└───────────┘└────────────────┘║║║║TLB MISS (~100+ cycles)║║┌───────────┐miss┌────────────────┐║║│ CPU │─────────▶│ TLB Cache │║║│ (virtual) │││║║└───────────┘└───────┬────────┘║║ │ ║║ ▼ Page Table Walk (4 memory accesses!)║║┌─────┐──▶┌─────┐──▶┌─────┐──▶┌─────┐──▶ Physical Address ║║│ PML4││ PDPT││ PD ││ PT │║║└─────┘└─────┘└─────┘└─────┘║║║╚═════════════════════════════════════════════════════════════════════════════╝
TLB Size Matters: A typical CPU has only 64-1024 TLB entries. With 4KB pages, that covers only 256KB-4MB of address space. Access scattered memory and you'll TLB miss constantly!
Huge Pages
Huge pages (2MB or 1GB) cover more memory with fewer TLB entries. One 2MB huge page covers 512× as much memory as a 4KB page—perfect for large allocations!
The kernel allocates many small, fixed-size objects (task structs, file descriptors, inodes). A general-purpose allocator like malloc has overhead for each allocation. The slab allocator pre-allocates "slabs" of memory divided into fixed-size slots.
╔═════════════════════════════════════════════════════════════════════════════╗║ SLAB ALLOCATOR STRUCTURE ║╠═════════════════════════════════════════════════════════════════════════════╣║║║kmem_cache "task_struct"(object_size = 2048 bytes)║║┌────────────────────────────────────────────────────────┐║║│ partial ──▶ ┌───────────────────────────────────┐│║║││ Slab 1 (has free slots) ││║║││┌────┬────┬────┬────┬────┬────┐││║║│││used│free│used│used│free│free│││║║││└────┴────┴────┴────┴────┴────┘││║║│└───────────────────────────────────┘│║║││║║│ full ─────▶ ┌───────────────────────────────────┐│║║││ Slab 2 (all used) ││║║││┌────┬────┬────┬────┬────┬────┐││║║│││used│used│used│used│used│used│││║║││└────┴────┴────┴────┴────┴────┘││║║│└───────────────────────────────────┘│║║└────────────────────────────────────────────────────────┘║║║║• Allocation: Find partial slab, flip bit in bitmap, return pointer║║• Free: Clear bit in bitmap, move to partial list if was full║║• No fragmentation—all objects same size!║║║╚═════════════════════════════════════════════════════════════════════════════╝
/* Slab Allocator for Fixed-Size Objects */
typedef struct slab {
    void*  base;            // Slab memory base
    size_t object_size;     // Size of each object
    size_t num_objects;     // Objects per slab
    uint64_t* bitmap;       // Allocation bitmap
    struct slab* next;      // Next slab in cache
} slab_t;

typedef struct {
    const char* name;
    size_t object_size;
    slab_t* slabs;
    slab_t* partial;        // Slabs with free space
    uint64_t allocations;
    uint64_t frees;
} slab_cache_t;

/* Allocate object from slab cache */
void* slab_alloc(slab_cache_t* cache) {
    // Find slab with free space
    for (slab_t* slab = cache->partial; slab; slab = slab->next) {
        int idx = find_first_zero_bit(slab->bitmap, slab->num_objects);
        if (idx >= 0) {
            set_bit(slab->bitmap, idx);
            cache->allocations++;
            return slab->base + idx * cache->object_size;
        }
    }

    // No space - create new slab
    slab_t* new_slab = create_slab(cache);
    set_bit(new_slab->bitmap, 0);
    new_slab->next = cache->partial;
    cache->partial = new_slab;
    cache->allocations++;

    return new_slab->base;
}
Profiling Tools
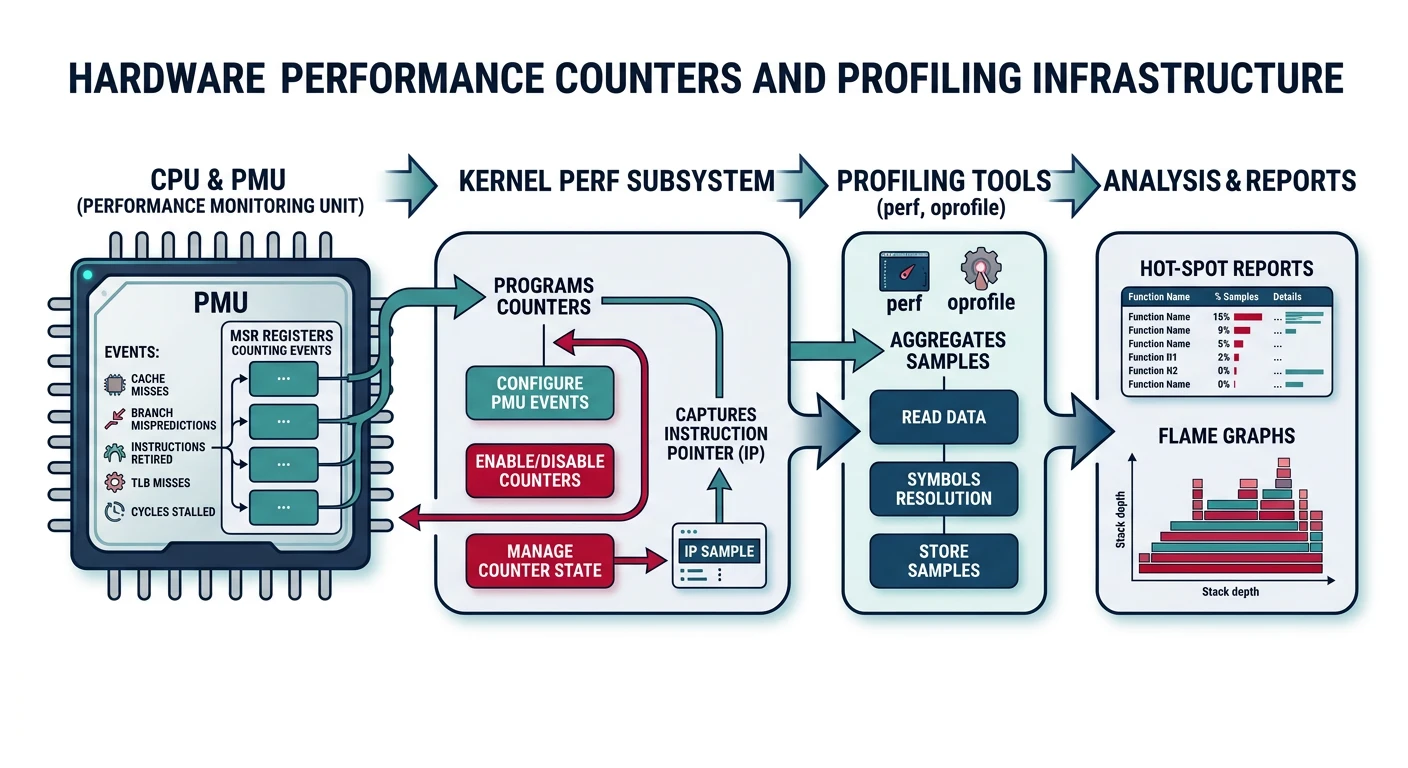
You can't optimize what you can't measure. Modern CPUs provide hardware performance counters that track cache misses, branch mispredictions, and cycles with zero overhead. Building profiling into your OS is essential for finding bottlenecks.
Profiling infrastructure — hardware performance counters, sampling, and trace analysis
Performance Counters (PMC)
Performance Monitoring Counters (PMC) are special CPU registers that count hardware events. x86 CPUs have 4-8 general-purpose counters that can track various events.
Kernel tracing records events as they happen—syscalls, interrupts, context switches—creating a timeline you can analyze. This is invaluable for finding why the system "feels slow."
/* Simple Ring Buffer for Kernel Tracing */
#define TRACE_BUFFER_SIZE 65536

typedef struct trace_event {
    uint64_t timestamp;     // TSC timestamp
    uint32_t event_type;    // TRACE_SYSCALL, TRACE_IRQ, etc.
    uint32_t cpu;           // Which CPU
    uint32_t pid;           // Process ID
    uint64_t arg1, arg2;    // Event-specific data
} trace_event_t;

typedef struct trace_buffer {
    trace_event_t events[TRACE_BUFFER_SIZE];
    volatile uint32_t head;
    volatile uint32_t tail;
    bool enabled;
} trace_buffer_t;

trace_buffer_t trace_buf;

/* Record trace event (called from kernel code) */
void trace_record(uint32_t type, uint64_t arg1, uint64_t arg2) {
    if (!trace_buf.enabled) return;

    uint32_t idx = atomic_inc(&trace_buf.head) % TRACE_BUFFER_SIZE;
    trace_event_t* e = &trace_buf.events[idx];

    e->timestamp = read_tsc();
    e->event_type = type;
    e->cpu = get_cpu_id();
    e->pid = current->pid;
    e->arg1 = arg1;
    e->arg2 = arg2;
}

/* Trace points in kernel */
#define TRACE_SYSCALL_ENTER  1
#define TRACE_SYSCALL_EXIT   2
#define TRACE_IRQ_ENTER      3
#define TRACE_IRQ_EXIT       4
#define TRACE_SCHED_SWITCH   5
#define TRACE_PAGE_FAULT     6

/* Example: Trace syscall entry */
long syscall_handler(long num, ...) {
    trace_record(TRACE_SYSCALL_ENTER, num, 0);

    long result = do_syscall(num, ...);

    trace_record(TRACE_SYSCALL_EXIT, num, result);
    return result;
}
Visualization: Export trace data to a file, then visualize with tools like Chrome's chrome://tracing or Perfetto. You'll see exactly what the kernel was doing at each microsecond!
What You Can Build
Phase 16 Project: A fast OS! Your system now has disk caching for fast file access, an optimized scheduler for responsive multitasking, efficient memory allocation, and tools to measure performance.
Let's build a performance benchmark suite that measures all the optimizations we've implemented:
With performance optimized, it's time to make the OS stable and secure. In Phase 17, we'll add debugging tools, implement security hardening, and put the finishing touches on our complete operating system.