GDB Basics
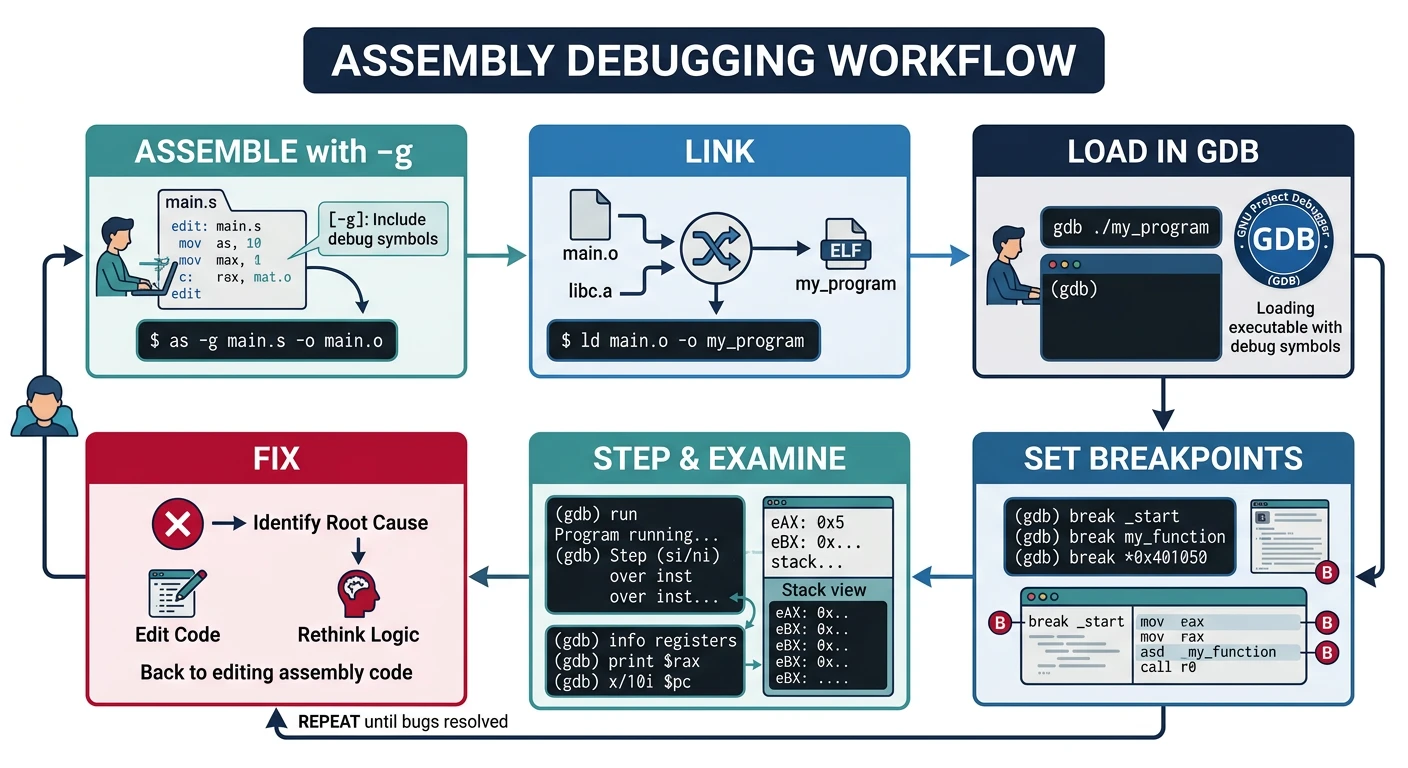
Build with Debug Symbols: Always compile with
-g flag for DWARF debug info. Without it, GDB can't map addresses to source lines.
x86 Assembly Mastery
Your 25-step learning path • Currently on Step 15
Development Environment, Tooling & Workflow
IDEs, debuggers, build tools, workflow setupAssembly Language Fundamentals & Toolchain Setup
Syntax basics, assemblers, linkers, object filesx86 CPU Architecture Overview
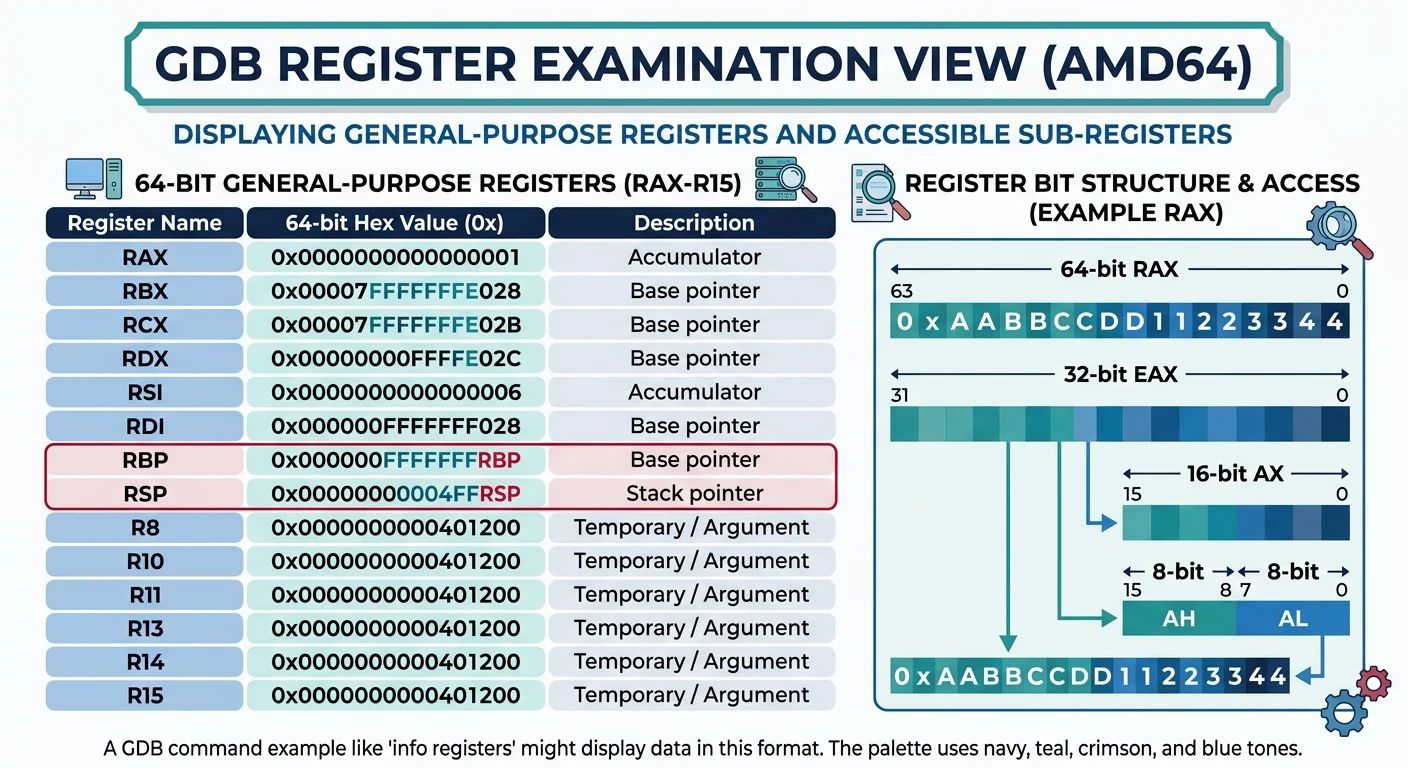
Instruction pipeline, execution units, microarchitectureRegisters – Complete Deep Dive
GPRs, segment, control, flags, MSRsInstruction Encoding & Binary Layout
Opcode bytes, ModR/M, SIB, prefixes, encoding schemesNASM Syntax, Directives & Macros
Sections, labels, EQU, %macro, conditional assemblyComplete Assembler Comparison
NASM vs MASM vs GAS vs FASM, syntax differencesMemory Addressing Modes
Direct, indirect, indexed, base+displacement, RIP-relativeStack Internals & Calling Conventions
Push/pop, stack frames, cdecl, System V ABI, fastcallControl Flow & Procedures
Jumps, loops, conditionals, CALL/RET, function designInteger, Bitwise & Arithmetic Operations
ADD, SUB, MUL, DIV, AND, OR, XOR, shifts, rotatesFloating Point & SIMD Foundations
x87 FPU, IEEE 754, SSE scalar, precision controlSIMD, Vectorization & Performance
SSE, AVX, AVX-512, data-parallel processingSystem Calls, Interrupts & Privilege Transitions
INT, SYSCALL, IDT, ring transitions, exception handling15
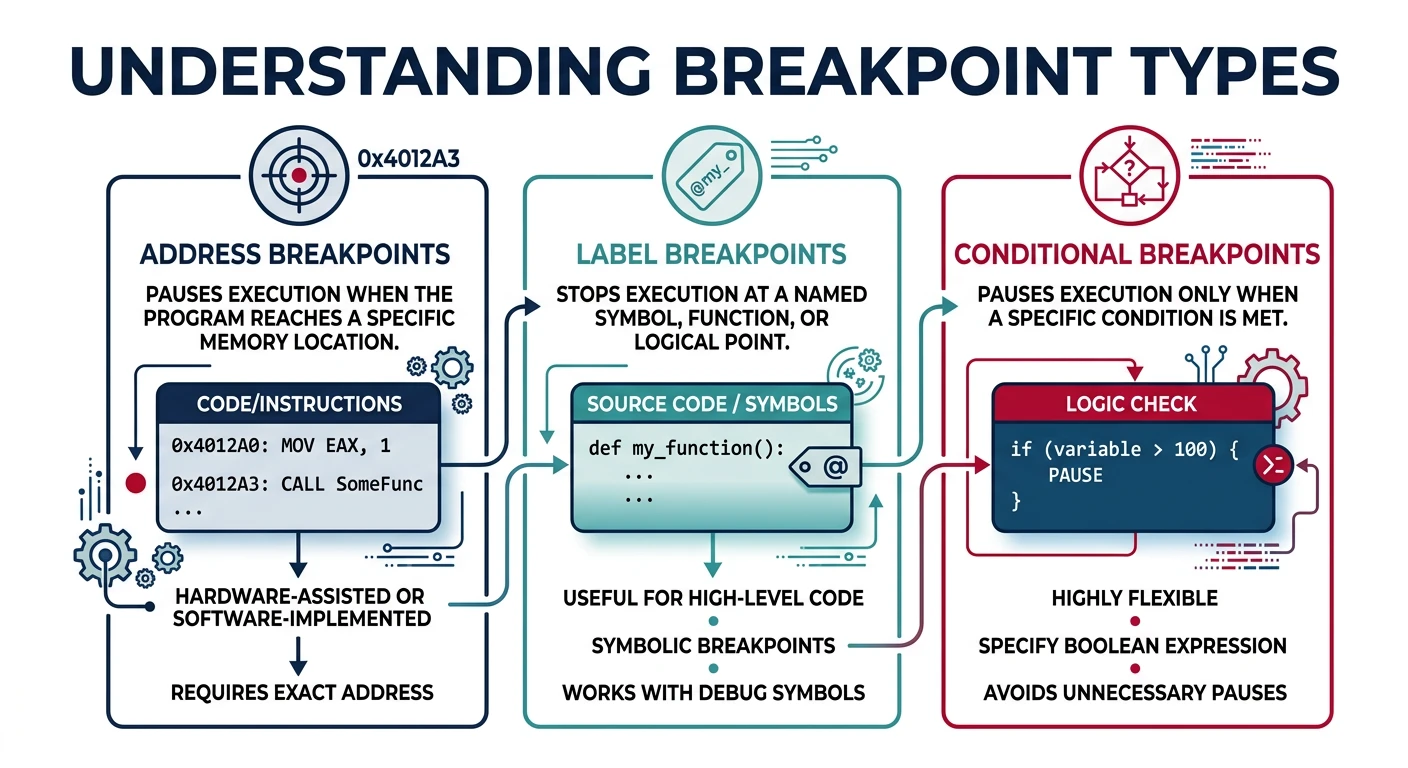
Debugging & Reverse Engineering
GDB, breakpoints, disassembly, binary analysis, IDA16
Linking, Relocation & Loader Behavior
ELF/PE formats, symbol resolution, dynamic linking, GOT/PLT17
x86-64 Long Mode & Advanced Features
64-bit extensions, RIP addressing, canonical addresses18
Assembly + C/C++ Interoperability
Inline assembly, calling C from ASM, ABI compliance19
Memory Protection & Security Concepts
DEP, ASLR, stack canaries, ROP, mitigations20
Bootloaders & Bare-Metal Programming
BIOS/UEFI, MBR, real mode, protected mode transition21
Kernel-Level Assembly
Context switching, interrupt handlers, TSS, GDT/LDT22
Complete Emulator & Simulator Guide
QEMU, Bochs, instruction-level simulation, debugging VMs23
Advanced Optimization & CPU Internals
Pipeline hazards, branch prediction, cache optimization, ILP24
Real-World Assembly Projects
Shellcode, drivers, cryptography, signal processing25
Assembly Mastery Capstone
Final project, comprehensive review, advanced techniques# Assemble with debug info
nasm -f elf64 -g -F dwarf program.asm -o program.o
ld -o program program.o
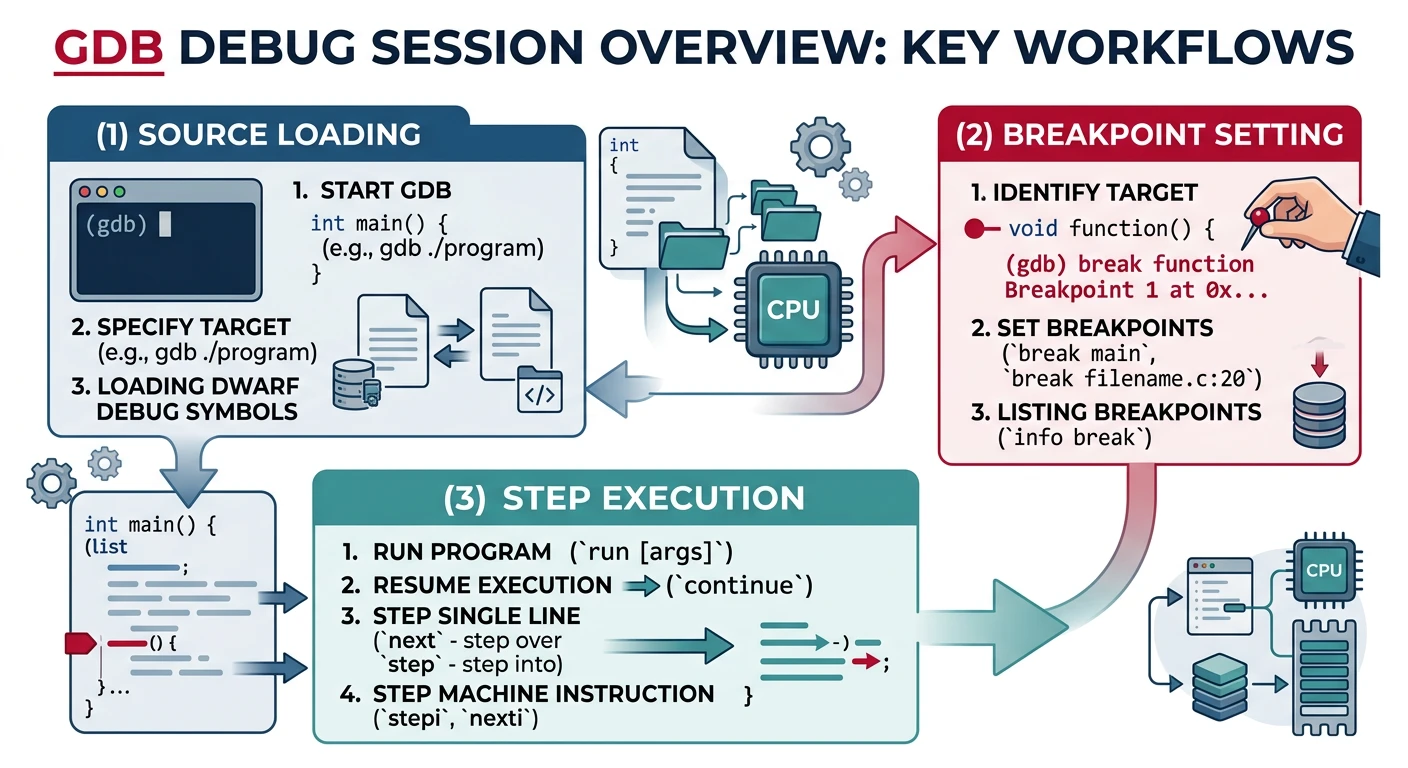
# Start GDB
gdb ./program
# Essential commands
(gdb) run # Run program
(gdb) quit # Exit GDB
(gdb) help <command> # Get help