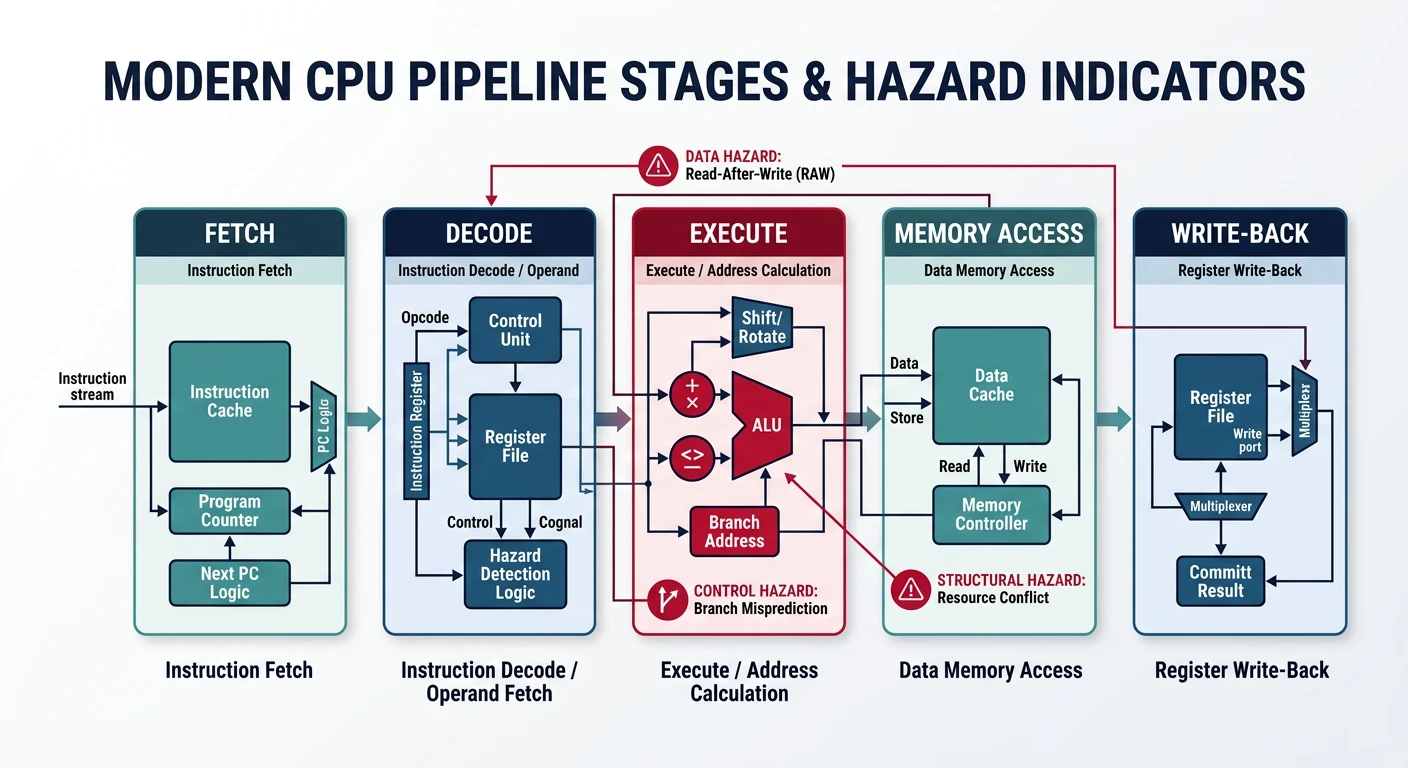
Modern CPUs execute instructions through multiple pipeline stages. Understanding the pipeline helps you write code that keeps it flowing without stalls.
Figure: CPU pipeline stages – instructions flow through fetch, decode, execute, memory, and write-back; hazards cause stalls that reduce throughput.
Hazard Type Description Solution
Data Hazard Instruction waits for Register renaming,
result from previous out-of-order exec
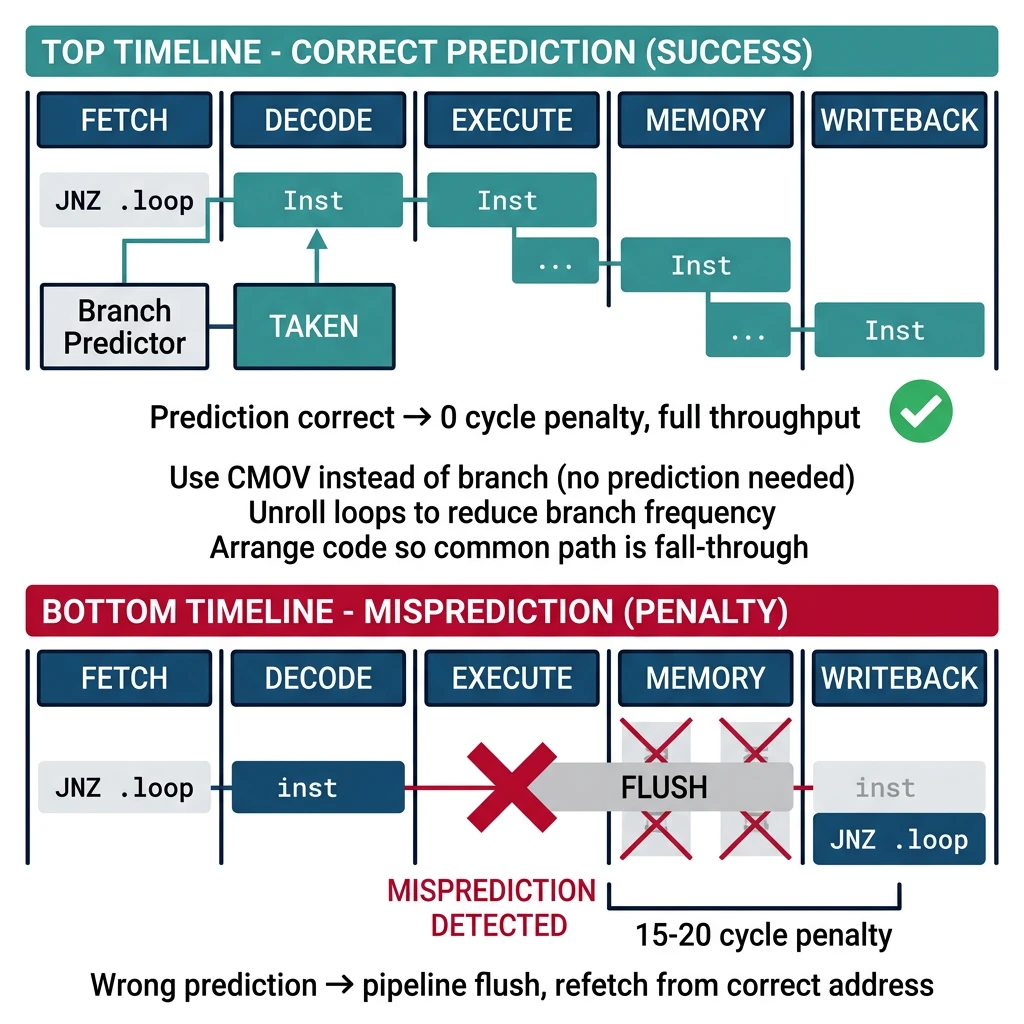
Control Branch misprediction Branch prediction
Hazard causes pipeline flush
Structural Resource conflict Multi-port ALUs
Branch Prediction
Figure: Branch prediction impact – correct predictions maintain pipeline flow while mispredictions flush the pipeline, costing 15-20 cycles.
; Poor: Unpredictable branch
cmp rax, rbx
jg .greater         ; 50/50 branch hard to predict

; Better: Use conditional move (no branch)
cmp rax, rbx
cmovg rcx, rdx      ; No branch, no misprediction

; Unroll loops to reduce branches
; Instead of:
.loop:
    add rax, [rsi]
    add rsi, 8
    dec rcx
    jnz .loop

; Unroll 4x:
.loop_unrolled:
    add rax, [rsi]
    add rax, [rsi+8]
    add rax, [rsi+16]
    add rax, [rsi+24]
    add rsi, 32
    sub rcx, 4
    jnz .loop_unrolled
Cache Optimization
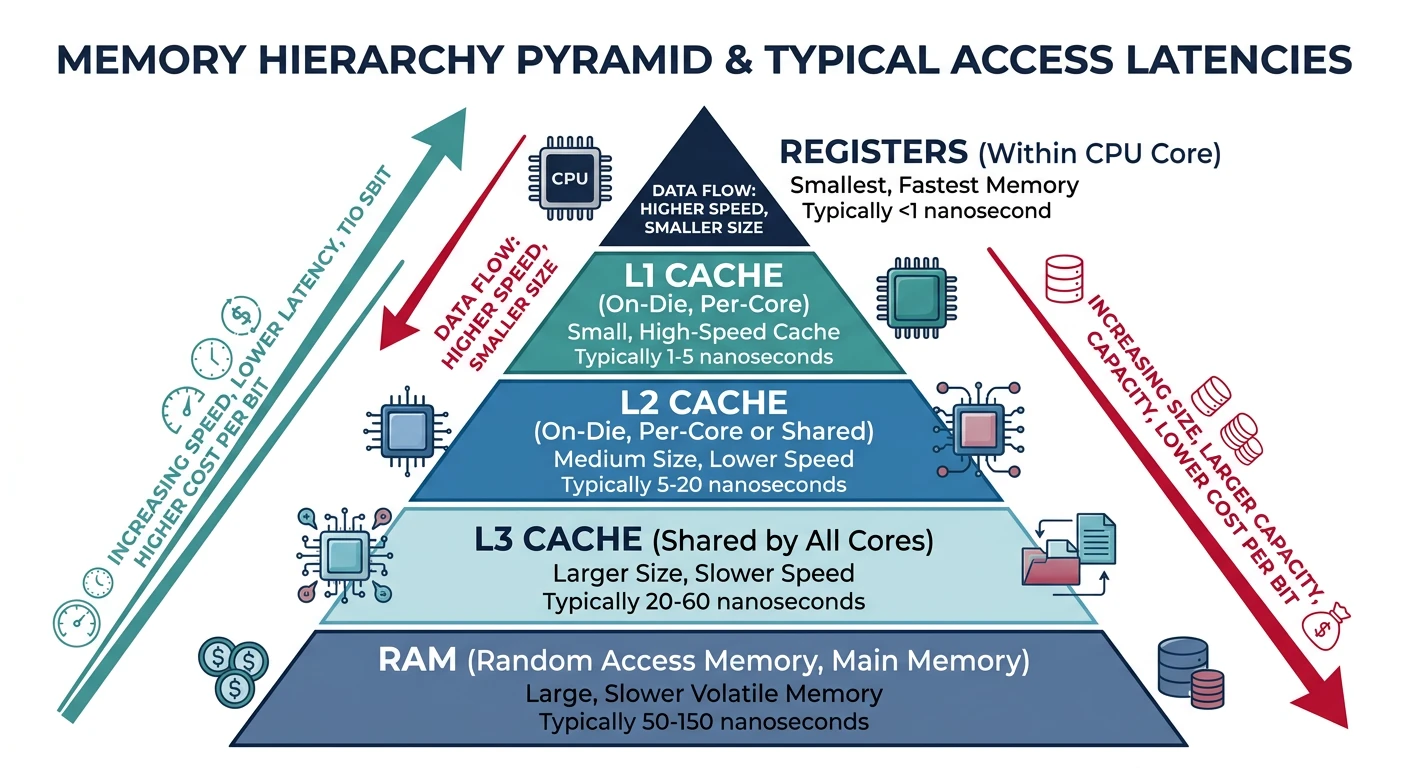
The memory hierarchy is a pyramid: small/fast at the top (registers), large/slow at the bottom (RAM). Cache misses are the #1 performance killer in modern code.
Figure: Memory hierarchy latencies – each level trades capacity for speed, from ~1-cycle registers to ~200-cycle main memory access.
Key Concept: Memory is loaded in 64-byte chunks called cache lines. Access one byte, and the CPU fetches the entire 64-byte line. Sequential access patterns are fast; random access is slow.
; BAD: Stride-1024 access (cache thrashing)
mov rsi, array
mov rcx, 1024
.bad_loop:
    add eax, [rsi]          ; Load from different cache lines
    add rsi, 1024           ; Huge stride = cache miss every time!
    dec rcx
    jnz .bad_loop

; GOOD: Sequential access (cache-friendly)
mov rsi, array
mov rcx, 1024
.good_loop:
    add eax, [rsi]          ; Sequential: same cache line hit
    add rsi, 4              ; Small stride = ~16 hits per line
    dec rcx
    jnz .good_loop
Software Prefetching
; Prefetch data before it's needed
; Hides memory latency behind computation

process_array:
    mov rcx, array_size
    lea rsi, [array]

.loop:
    ; Prefetch data 256 bytes ahead
    prefetcht0 [rsi + 256]  ; T0 = all cache levels

    ; Process current data (while prefetch completes)
    movdqa xmm0, [rsi]
    ; ... process xmm0 ...
    movdqa [rsi], xmm0

    add rsi, 16
    sub rcx, 4              ; 4 floats per iteration
    jnz .loop
    ret

; Prefetch variants:
; prefetcht0 - Fetch to all cache levels
; prefetcht1 - Fetch to L2 and higher
; prefetcht2 - Fetch to L3 and higher
; prefetchnta - Non-temporal (minimize cache pollution)
Data Layout for Cache Efficiency
Array of Structures (AoS) - Poor for SIMD, mixed cache usage:
┌────────────────────────────────────────────────────┐
│ x0 y0 z0 | x1 y1 z1 | x2 y2 z2 | x3 y3 z3 | ... │
└────────────────────────────────────────────────────┘

Structure of Arrays (SoA) - Great for SIMD, efficient cache:
┌────────────────────────────────────────────────────┐
│ x0 x1 x2 x3 x4 x5 x6 x7 ... (all X values)       │
├────────────────────────────────────────────────────┤
│ y0 y1 y2 y3 y4 y5 y6 y7 ... (all Y values)       │
├────────────────────────────────────────────────────┤
│ z0 z1 z2 z3 z4 z5 z6 z7 ... (all Z values)       │
└────────────────────────────────────────────────────┘
SoA lets you load 4/8/16 X values into one SIMD register!
Instruction Scheduling
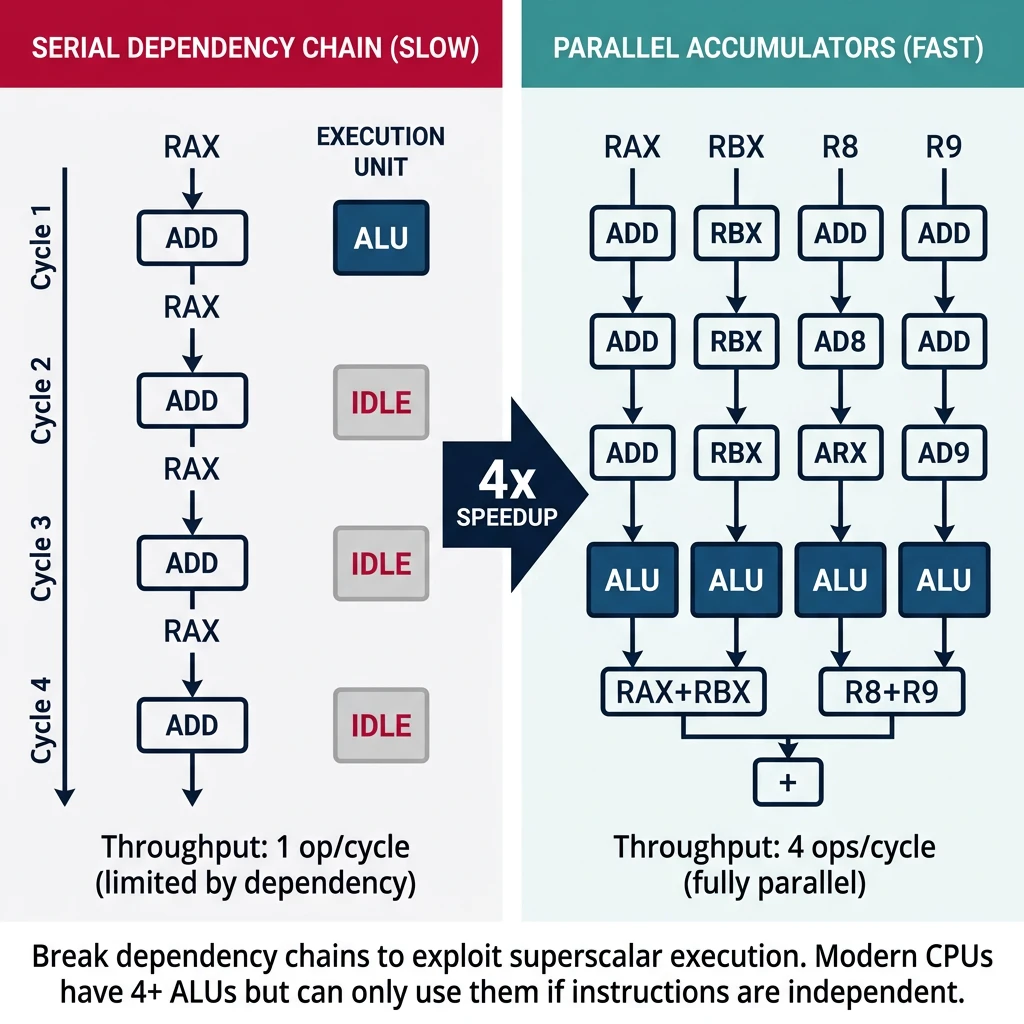
Modern CPUs execute multiple instructions simultaneously. Understanding latency and throughput helps you write code that keeps all execution units busy.
Figure: Breaking dependency chains – multiple independent accumulators enable parallel execution, increasing throughput from 1 to 4 operations per cycle.
Key Concepts
Term
Definition
Example
Latency
Cycles until result is usable
mulsd: 5 cycles
Throughput
Instructions per cycle (IPC)
addsd: 2 per cycle
Dependency Chain
Instructions that depend on earlier results
add rax,rbx; mul rax
Breaking Dependency Chains
; BAD: Serial dependency chain (limited by latency)
mov rax, 0
.slow_sum:
    add rax, [rsi]          ; Each ADD waits for previous result
    add rsi, 8              ; 1 ADD retired per cycle
    dec rcx
    jnz .slow_sum

; GOOD: Parallel accumulators (exploit throughput)
xor eax, eax
xor ebx, ebx
xor r8d, r8d
xor r9d, r9d
.fast_sum:
    add rax, [rsi]          ; 4 independent chains
    add rbx, [rsi+8]        ; CPU executes in parallel
    add r8,  [rsi+16]       ; ~4 ADDs retired per cycle!
    add r9,  [rsi+24]
    add rsi, 32
    sub rcx, 4
    jnz .fast_sum

    add rax, rbx            ; Combine at the end
    add r8, r9
    add rax, r8
Instruction Latency Reference
Instruction
Latency (cycles)
Throughput (per cycle)
add/sub
1
4
imul r64, r64
3
1
div r64
35-90
1/~30
addsd
4
2
mulsd
5
2
divsd
14
1/4
vaddps ymm
4
2
vmulps ymm
5
2
L1 cache load
4
2
L2 cache load
12
1/2
Rule of Thumb: If your loop body has N cycles of latency, use N parallel accumulators to fully utilize throughput. For 5-cycle mulsd, use 5 independent multiply chains.
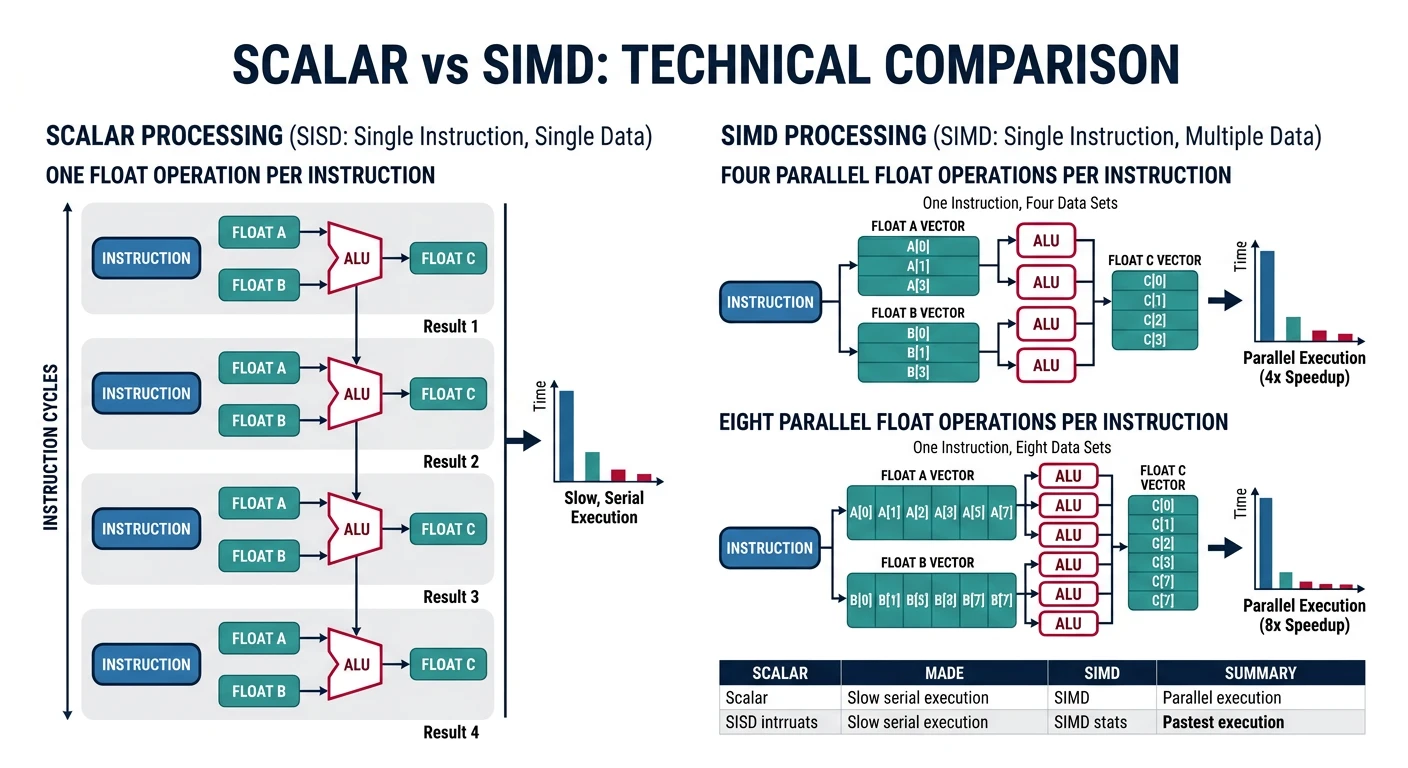
SIMD Optimization
SIMD (Single Instruction, Multiple Data) processes multiple elements in parallel. A single AVX instruction can perform 8 float operations simultaneously.
Figure: Scalar vs SIMD processing – a single SSE instruction processes 4 floats simultaneously, with AVX doubling to 8 parallel operations.
Vectorization Strategy
Vectorization Checklist:

1. ☐ Identify the hot loop (profiler shows high cycle count)
2. ☐ Check data alignment (16/32/64-byte for SSE/AVX/AVX-512)
3. ☐ Ensure no loop-carried dependencies (each iteration independent)
4. ☐ Convert branching to masks (avoid jumps in SIMD loops)
5. ☐ Handle remainder elements (when count not divisible by width)
Scalar to SIMD Conversion
; SCALAR: Process one float at a time
scalar_add:
    mov rcx, count
.loop:
    movss xmm0, [rdi]       ; Load 1 float
    addss xmm0, [rsi]       ; Add 1 float
    movss [rdi], xmm0       ; Store 1 float
    add rdi, 4
    add rsi, 4
    dec rcx
    jnz .loop
    ret

; SSE: Process 4 floats at a time (4x speedup potential)
sse_add:
    mov rcx, count
    shr rcx, 2              ; count / 4
.sse_loop:
    movaps xmm0, [rdi]      ; Load 4 floats
    addps xmm0, [rsi]       ; Add 4 floats in parallel
    movaps [rdi], xmm0      ; Store 4 floats
    add rdi, 16
    add rsi, 16
    dec rcx
    jnz .sse_loop
    ; Handle remainder...
    ret

; AVX: Process 8 floats at a time (8x speedup potential)
avx_add:
    mov rcx, count
    shr rcx, 3              ; count / 8
.avx_loop:
    vmovaps ymm0, [rdi]     ; Load 8 floats
    vaddps ymm0, ymm0, [rsi] ; Add 8 floats
    vmovaps [rdi], ymm0     ; Store 8 floats
    add rdi, 32
    add rsi, 32
    dec rcx
    jnz .avx_loop
    vzeroupper              ; Clear upper YMM bits (SSE transition)
    ret
Handling Branches with Masks
; Scalar: if (a[i] > 0) b[i] = sqrt(a[i])
scalar_conditional:
    movss xmm0, [rdi]       ; Load a[i]
    xorps xmm1, xmm1        ; 0.0
    comiss xmm0, xmm1       ; Compare a[i] > 0
    jbe .skip
    sqrtss xmm0, xmm0       ; sqrt(a[i])
    movss [rsi], xmm0       ; Store to b[i]
.skip:
    ; ... branches are slow in SIMD

; SIMD: Use blend/mask instead of branches
simd_conditional:
    vmovaps ymm0, [rdi]     ; Load 8 floats
    vxorps ymm1, ymm1, ymm1 ; 0.0
    vcmpps ymm2, ymm0, ymm1, 14 ; Compare a > 0 (mask)
    vsqrtps ymm3, ymm0      ; sqrt(a) for all
    vblendvps ymm4, ymm1, ymm3, ymm2  ; Select: mask ? sqrt : 0
    vmovaps [rsi], ymm4     ; Store result
    ; No branches! All 8 elements processed in parallel
Exercise
SIMD Dot Product
Implement a vectorized dot product of two float arrays:
// Compute: sum(a[i] * b[i]) for i = 0 to n-1
float dot_product(float* a, float* b, int n);
Hint: Use vmulps for parallel multiply, vhaddps for horizontal add, or accumulate with vaddps and reduce at the end.
Profiling Tools
# Linux perf - CPU performance counters
perf stat ./program
perf record ./program
perf report

# Key metrics
perf stat -e cycles,instructions,cache-misses ./program

# Sample output:
#   1,234,567,890   cycles
#     987,654,321   instructions   #  0.80 IPC
#          12,345   cache-misses   #  0.01%