You can't manage what you can't measure. Network management protocols provide visibility into device health, traffic patterns, and system events—essential for troubleshooting and capacity planning.
Series Context: This is Part 16 of 20 in the Complete Protocols Master series. These protocols operate at the Application Layer but monitor all layers of the network stack.
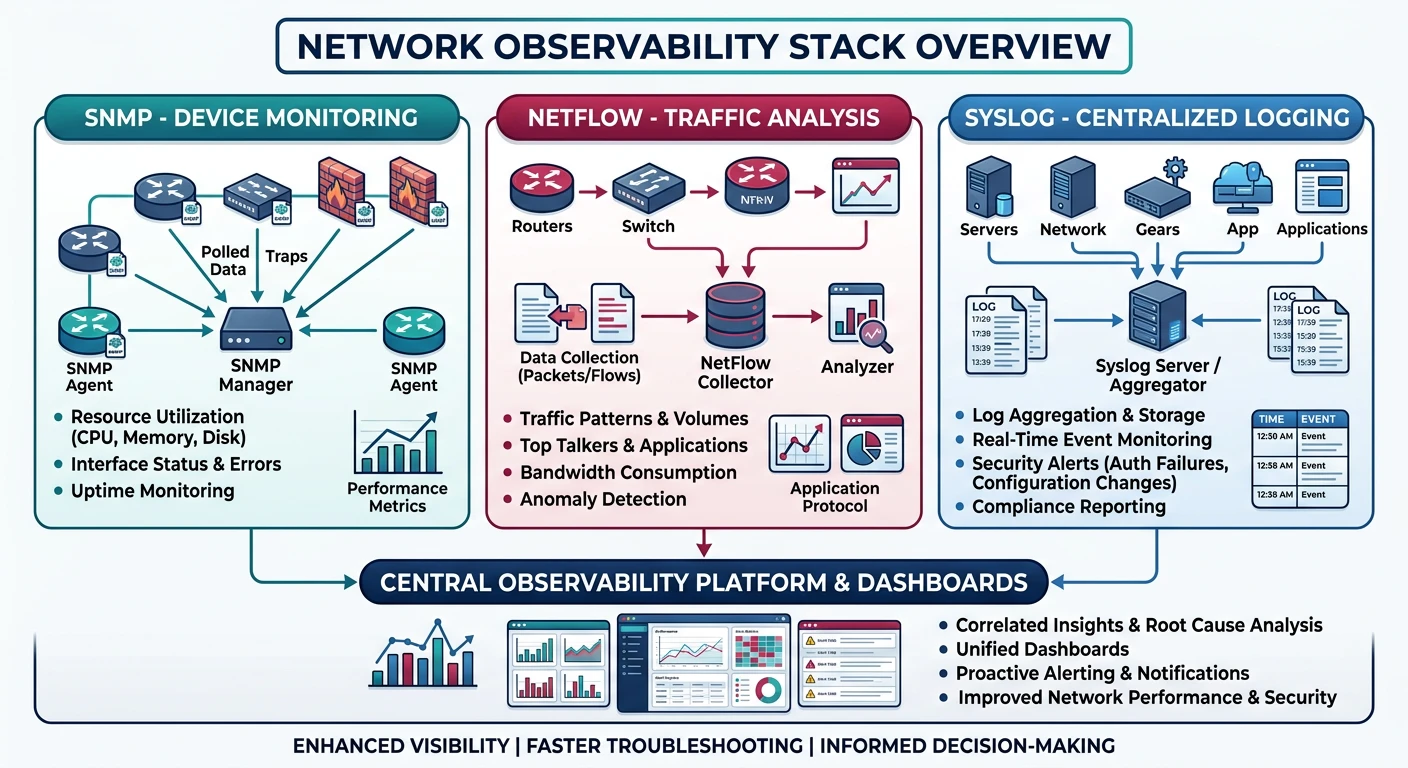
Network Observability Pillars:

1. METRICS (SNMP)
   • Device health (CPU, memory, uptime)
   • Interface statistics (bytes, errors)
   • Configuration state

2. FLOWS (NetFlow/IPFIX)
   • Traffic patterns (who talks to whom)
   • Bandwidth usage per application
   • Security anomaly detection

3. LOGS (Syslog)
   • Events and alerts
   • Configuration changes
   • Security incidents

Together they answer:
• SNMP: "Is the device healthy?"
• NetFlow: "What traffic is flowing?"
• Syslog: "What events occurred?"
SNMP: Simple Network Management Protocol
SNMP is the universal language for device monitoring. Query router interfaces, check printer ink, monitor server CPU—if it's networked, SNMP can probably monitor it.
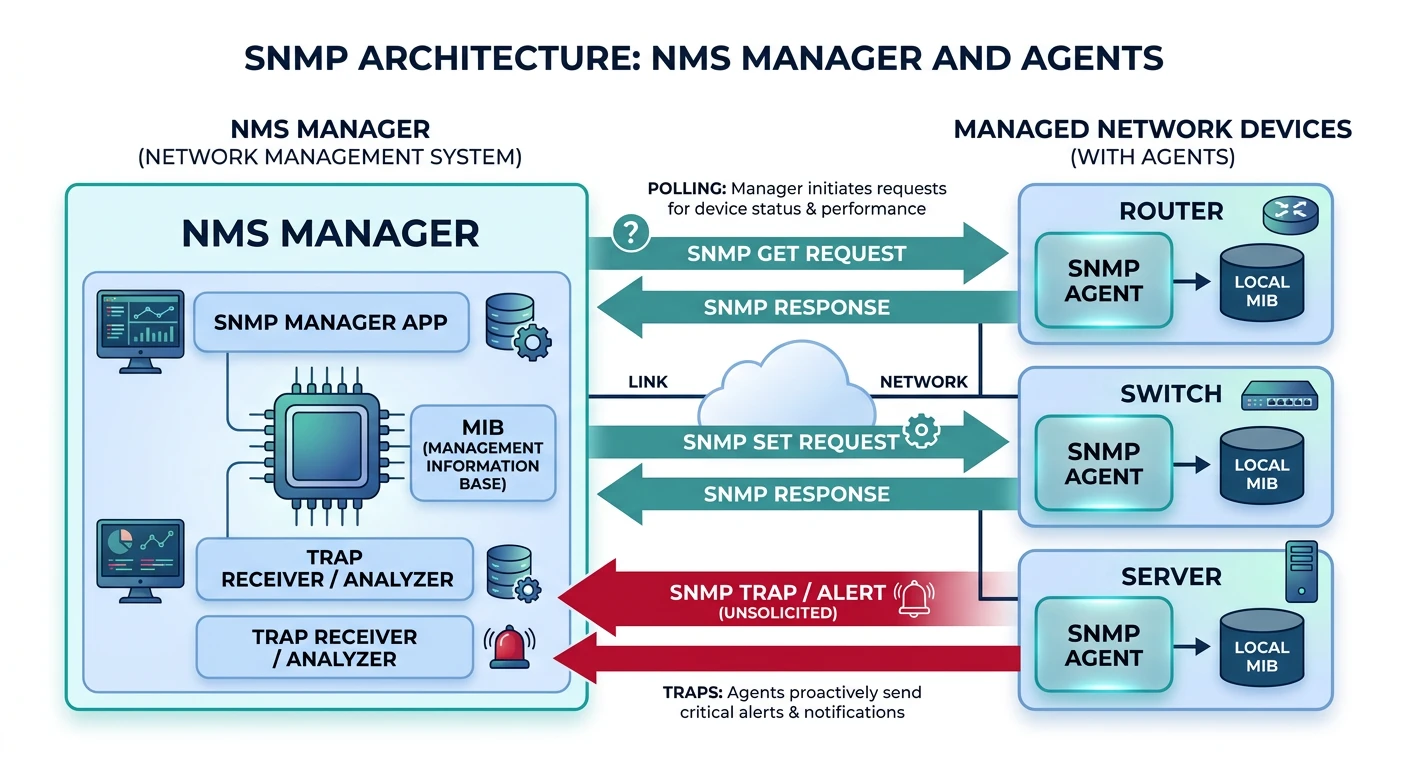
SNMP architecture: manager polls agents via OID queries, agents send traps on events, MIB defines the data hierarchy
Components
SNMP Architecture
SNMP Components:

1. MANAGER (NMS)
   • Polls agents for data
   • Receives traps/informs
   • Examples: Nagios, Zabbix, PRTG

2. AGENT
   • Runs on managed device
   • Responds to queries
   • Sends traps on events

3. MIB (Management Information Base)
   • Database of manageable objects
   • Hierarchical tree structure
   • Standard + vendor-specific

4. OID (Object Identifier)
   • Unique address for each object
   • Numeric: 1.3.6.1.2.1.1.1.0
   • Named: iso.org.dod.internet.mgmt.mib-2.system.sysDescr.0

Operations:
• GET: Read single value
• GETNEXT: Walk through tree
• GETBULK: Efficient bulk read (v2c+)
• SET: Write value (configuration)
• TRAP: Unsolicited alert
• INFORM: Acknowledged trap (v2c+)
Versions
SNMP Versions
Version
Security
Features
Use Case
v1
Community string (plaintext)
Basic
Legacy only
v2c
Community string (plaintext)
GETBULK, INFORM
Most common
v3
Auth + Encryption
User-based security
Secure deployments
# SNMP queries with snmpwalk and snmpget

# Get system description
snmpget -v2c -c public 192.168.1.1 1.3.6.1.2.1.1.1.0
# Response: STRING: "Cisco IOS Software, C2900 Software..."

# Get system uptime
snmpget -v2c -c public 192.168.1.1 sysUpTime.0

# Walk entire system tree
snmpwalk -v2c -c public 192.168.1.1 system

# Walk interface table
snmpwalk -v2c -c public 192.168.1.1 ifTable

# Get interface stats (index 1)
snmpget -v2c -c public 192.168.1.1 \
  ifInOctets.1 ifOutOctets.1 ifInErrors.1

# SNMPv3 with authentication
snmpget -v3 -l authPriv \
  -u admin \
  -a SHA -A "authpassword" \
  -x AES -X "privpassword" \
  192.168.1.1 sysDescr.0
# SNMP monitoring with Python (pysnmp)

from pysnmp.hlapi import *

def snmp_get(host, community, oid):
    """Get single SNMP value"""

    iterator = getCmd(
        SnmpEngine(),
        CommunityData(community, mpModel=1),  # v2c
        UdpTransportTarget((host, 161)),
        ContextData(),
        ObjectType(ObjectIdentity(oid))
    )

    errorIndication, errorStatus, errorIndex, varBinds = next(iterator)

    if errorIndication:
        print(f"Error: {errorIndication}")
        return None
    elif errorStatus:
        print(f"Error: {errorStatus.prettyPrint()}")
        return None
    else:
        for varBind in varBinds:
            return varBind[1].prettyPrint()

def snmp_walk(host, community, oid):
    """Walk SNMP tree"""

    results = []

    for (errorIndication, errorStatus, errorIndex, varBinds) in nextCmd(
        SnmpEngine(),
        CommunityData(community, mpModel=1),
        UdpTransportTarget((host, 161)),
        ContextData(),
        ObjectType(ObjectIdentity(oid)),
        lexicographicMode=False
    ):
        if errorIndication:
            print(f"Error: {errorIndication}")
            break
        elif errorStatus:
            print(f"Error: {errorStatus.prettyPrint()}")
            break
        else:
            for varBind in varBinds:
                results.append((varBind[0].prettyPrint(),
                              varBind[1].prettyPrint()))

    return results

# Example usage
print("System Description:", snmp_get('192.168.1.1', 'public',
      '1.3.6.1.2.1.1.1.0'))
print("\nInterfaces:")
for oid, val in snmp_walk('192.168.1.1', 'public', '1.3.6.1.2.1.2.2.1.2'):
    print(f"  {oid}: {val}")
Common OIDs
Essential SNMP OIDs
Common SNMP OIDs (MIB-2):

System Group (1.3.6.1.2.1.1):
• sysDescr.0     - System description
• sysUpTime.0    - Uptime (timeticks)
• sysContact.0   - Admin contact
• sysName.0      - Hostname
• sysLocation.0  - Physical location

Interface Group (1.3.6.1.2.1.2):
• ifNumber.0     - Number of interfaces
• ifDescr.X      - Interface name
• ifSpeed.X      - Bandwidth (bps)
• ifAdminStatus.X - Admin up/down
• ifOperStatus.X  - Operational status
• ifInOctets.X   - Bytes received
• ifOutOctets.X  - Bytes sent
• ifInErrors.X   - Input errors
• ifOutErrors.X  - Output errors

CPU/Memory (vendor-specific):
• Cisco: 1.3.6.1.4.1.9.9.109
• Linux (HOST-RESOURCES): 1.3.6.1.2.1.25
NetFlow: Traffic Analysis
NetFlow captures metadata about network conversations—who's talking to whom, on what ports, how much data. Essential for capacity planning and security monitoring.
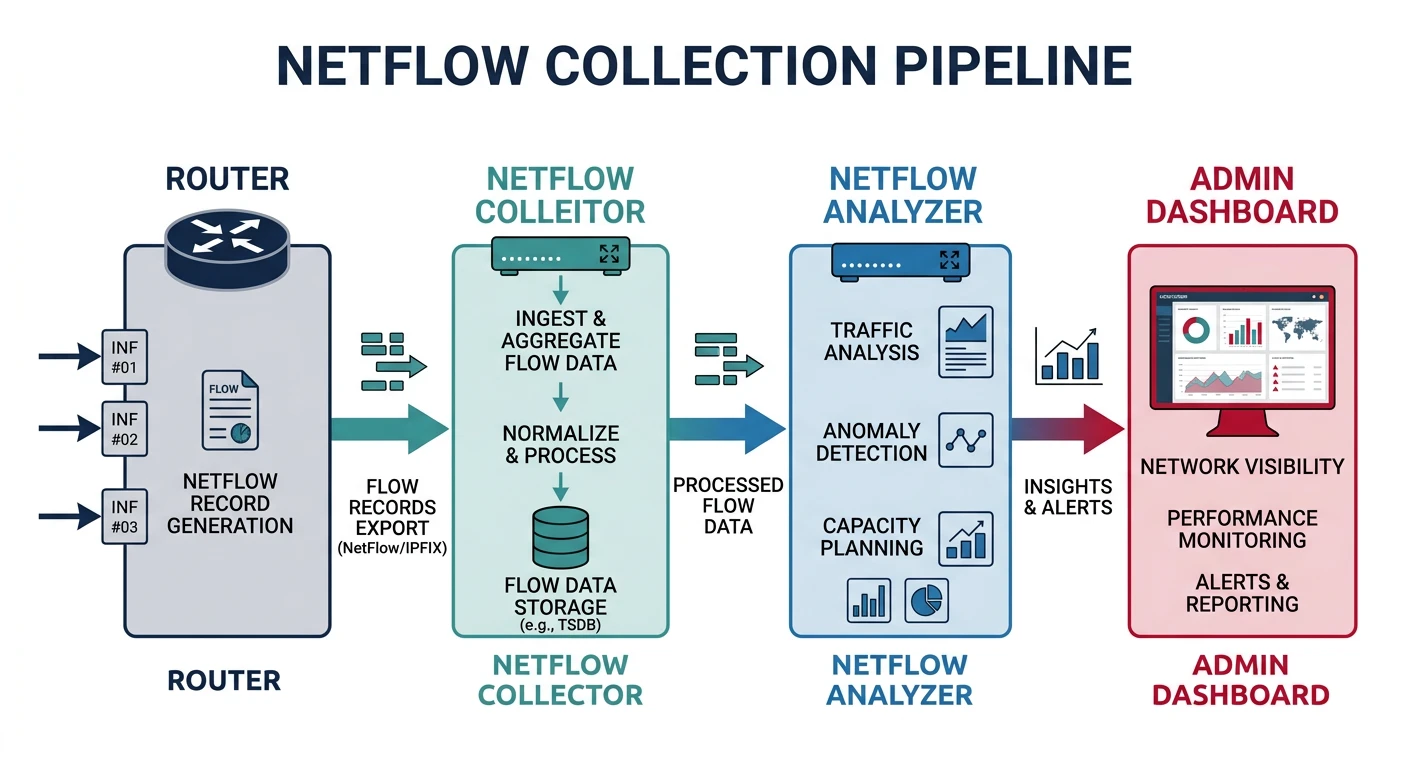
NetFlow pipeline: routers export flow metadata to collectors for traffic analysis and capacity planning
Key Insight: NetFlow doesn't capture packet contents—just flow metadata. Like phone records vs call recordings.
Flow Data
What's in a Flow?
NetFlow v5 Record (7 Tuple):

1. Source IP
2. Destination IP
3. Source Port
4. Destination Port
5. Protocol (TCP/UDP/ICMP)
6. Type of Service (ToS)
7. Input Interface

Plus:
• Packet count
• Byte count
• Start/end timestamps
• TCP flags
• Next-hop IP

NetFlow v9 / IPFIX:
• Template-based (flexible fields)
• IPv6 support
• Variable length fields
• Vendor extensions
# NetFlow architecture

         [Router]
             |
             | NetFlow export (UDP 2055)
             ↓
        [Collector]
             |
             | Store flows
             ↓
        [Analyzer]
             |
             | Reports, dashboards
             ↓
        [Admin UI]

Popular Collectors:
• ntopng (open source)
• Elasticsearch + Logstash
• SolarWinds NTA
• PRTG

# Enable NetFlow on Cisco
interface GigabitEthernet0/0
  ip flow ingress
  ip flow egress

ip flow-export version 9
ip flow-export destination 10.0.0.100 2055
ip flow-export source Loopback0
# Parse NetFlow with Python

def parse_netflow_concepts():
    """NetFlow analysis concepts"""

    print("NetFlow Analysis Use Cases")
    print("=" * 50)

    print("""
    # Using ntopng API or custom collector

    Common Analysis Queries:

    1. TOP TALKERS (bandwidth hogs)
       SELECT src_ip, SUM(bytes) as total
       FROM flows
       GROUP BY src_ip
       ORDER BY total DESC
       LIMIT 10

    2. APPLICATION BREAKDOWN
       SELECT dst_port, SUM(bytes) as total
       FROM flows
       GROUP BY dst_port
       ORDER BY total DESC

       Port 443: HTTPS
       Port 80: HTTP
       Port 22: SSH

    3. SECURITY: Unusual traffic
       SELECT src_ip, dst_ip, dst_port
       FROM flows
       WHERE dst_port NOT IN (80, 443, 22, 53)
       AND bytes > 1000000

    4. BANDWIDTH OVER TIME
       SELECT
         DATE_TRUNC('hour', timestamp) as hour,
         SUM(bytes) as total_bytes
       FROM flows
       GROUP BY hour
       ORDER BY hour
    """)

    print("\nNetFlow Sampling:")
    print("• 1:100 sampling = analyze 1% of packets")
    print("• Reduces collector load")
    print("• Statistically accurate for top-N analysis")

parse_netflow_concepts()
Syslog: Centralized Logging
Syslog is the standard for forwarding log messages. Every Unix system, router, and firewall speaks syslog—send logs to a central server for analysis and retention.
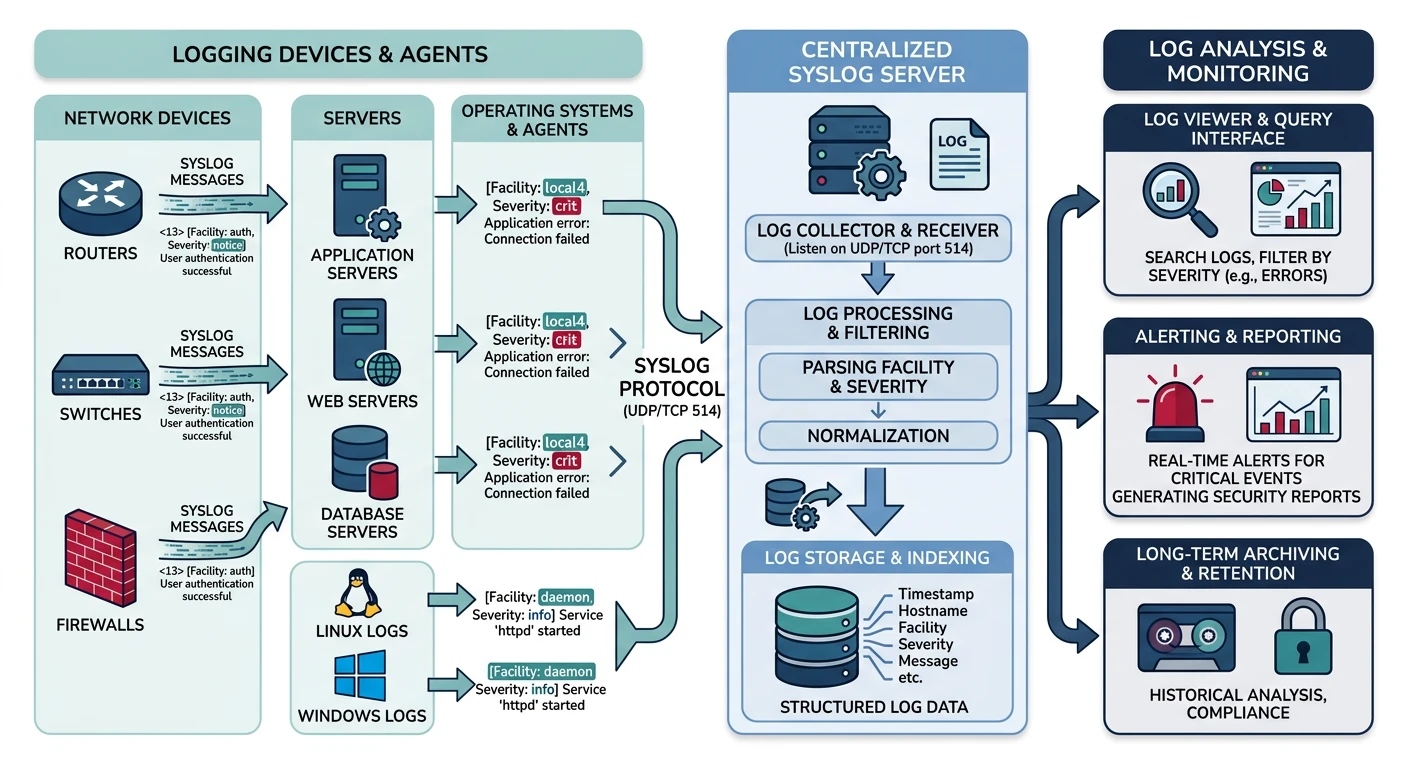
Syslog: devices forward log messages with facility/severity classification to a central logging server
Format
Syslog Message Structure
Syslog Components:

FACILITY (source type):
0  kernel       4  auth        8  uucp
1  user         5  syslog      9-15 local0-7
2  mail         6  lpr         16-23 local0-7
3  daemon       7  news

SEVERITY (0-7, lower=worse):
0  Emergency    System unusable
1  Alert        Immediate action needed
2  Critical     Critical conditions
3  Error        Error conditions
4  Warning      Warning conditions
5  Notice       Normal but significant
6  Info         Informational
7  Debug        Debug messages

MESSAGE FORMAT (RFC 5424):
VERSION TIMESTAMP HOSTNAME APP-NAME PROCID MSGID MSG

Example:
<34>1 2026-01-31T10:30:00Z router1 sshd 12345 - - Failed login from 10.0.0.5

PRI = Facility * 8 + Severity
<34> = 4*8 + 2 = auth.critical
# Syslog configuration

# Linux rsyslog.conf - send to remote server
*.* @syslog.example.com:514      # UDP
*.* @@syslog.example.com:514     # TCP

# Filter by facility/severity
auth.* @syslog.example.com:514
*.err @syslog.example.com:514

# Cisco IOS
logging host 10.0.0.100
logging trap informational
logging facility local7

# Test syslog
logger -p local0.info "Test message from $(hostname)"

# View logs
tail -f /var/log/syslog
journalctl -f
# Syslog server with Python

import socketserver
import re
from datetime import datetime

class SyslogHandler(socketserver.BaseRequestHandler):
    """Simple syslog receiver"""

    def handle(self):
        data = self.request[0].strip().decode('utf-8')

        # Parse syslog message
        match = re.match(r'<(\d+)>(.+)', data)
        if match:
            pri = int(match.group(1))
            message = match.group(2)

            facility = pri // 8
            severity = pri % 8

            facilities = ['kern', 'user', 'mail', 'daemon',
                         'auth', 'syslog', 'lpr', 'news']
            severities = ['emerg', 'alert', 'crit', 'err',
                         'warning', 'notice', 'info', 'debug']

            fac_name = facilities[facility] if facility < len(facilities) else f'local{facility-16}'
            sev_name = severities[severity]

            print(f"[{datetime.now()}] {self.client_address[0]} "
                  f"{fac_name}.{sev_name}: {message}")

def start_syslog_server(port=514):
    """Start UDP syslog server"""

    server = socketserver.UDPServer(('0.0.0.0', port), SyslogHandler)
    print(f"Syslog server listening on UDP {port}")
    server.serve_forever()

# Production: Use rsyslog, syslog-ng, or ELK stack
# start_syslog_server()

print("""
Production Syslog Stack:

[Devices] → [rsyslog/syslog-ng] → [Kafka] → [Logstash] → [Elasticsearch]
                                                              ↓
                                                          [Kibana]
""")
NMS Integration
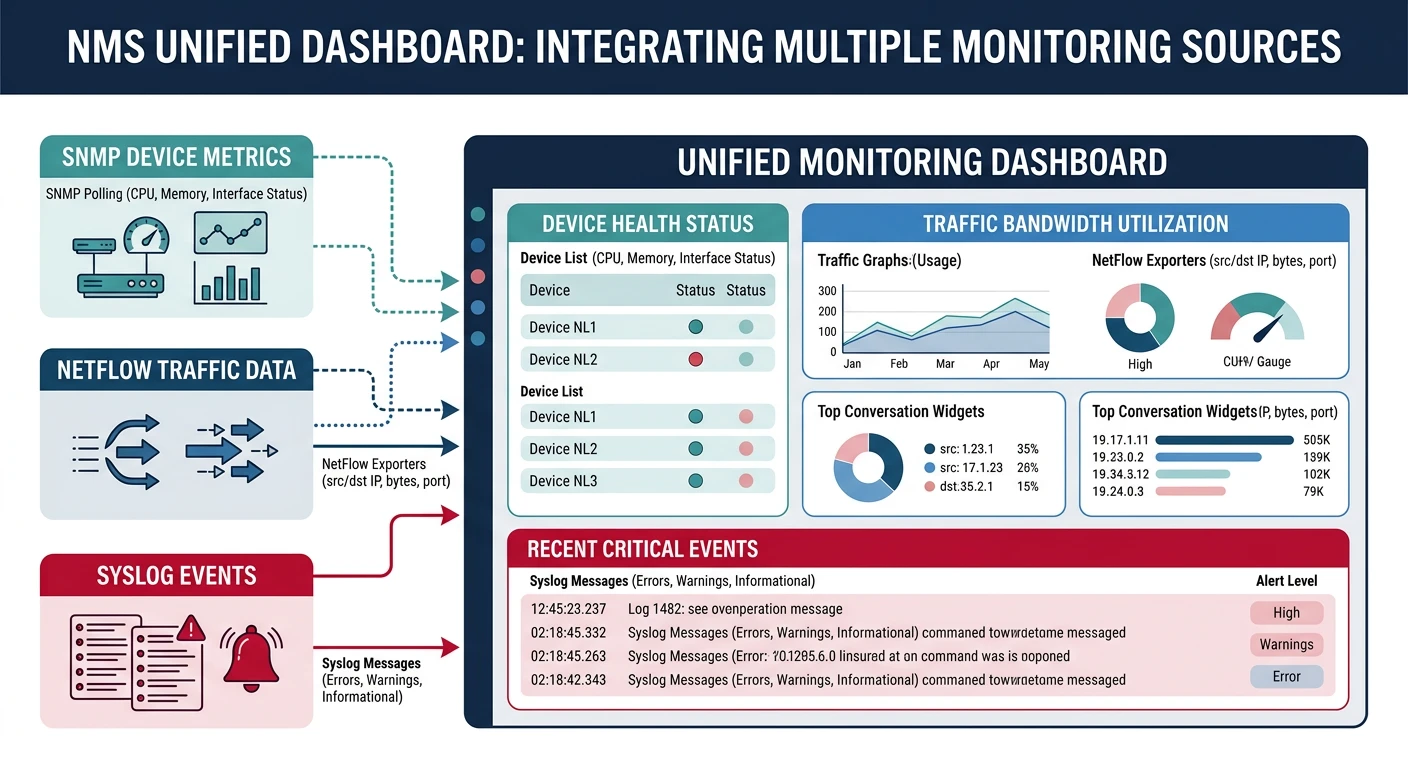
Network Management Systems (NMS) combine SNMP, NetFlow, and syslog into unified dashboards. Popular options include Zabbix, Nagios, PRTG, and cloud-native solutions like Datadog.
NMS integration: unified dashboards combine SNMP, NetFlow, and Syslog for complete network visibility
Tools
NMS Options
Tool
Type
Best For
Zabbix
Open source
Enterprise monitoring
Nagios
Open source
Alert-focused
PRTG
Commercial
Windows environments
Grafana
Open source
Visualization
Datadog
SaaS
Cloud-native
LibreNMS
Open source
Autodiscovery
# Zabbix SNMP monitoring example

# 1. Add host with SNMP interface
# 2. Link template (e.g., Template Net Cisco IOS SNMPv2)
# 3. Items automatically created from MIB

# Zabbix agent configuration (alternative)
Server=zabbix.example.com
ServerActive=zabbix.example.com
Hostname=web-server-01

# Custom user parameter
UserParameter=custom.metric,/path/to/script.sh

# Prometheus metrics (modern alternative)
# SNMP Exporter + Prometheus + Grafana stack
Summary & Next Steps
Key Takeaways:
SNMP: Universal device monitoring (metrics)
NetFlow: Traffic analysis (flows)
Syslog: Centralized logging (events)
SNMPv3: Use for security (auth + encryption)
NMS: Unified monitoring dashboards
Quiz
Test Your Knowledge
SNMP v2c vs v3 security? (Community string vs auth+encryption)
What's an OID? (Object Identifier, unique address)
NetFlow captures what? (Flow metadata, not content)
Syslog severity 0? (Emergency, worst)
SNMP TRAP vs INFORM? (Unacknowledged vs acknowledged)